Parseable data source plugin allows you to query and visualize log data stored in Parseable server, in your Grafana dashboard.
Pre-requisites
- Parseable server setup and receiving logs from your application.
- Grafana installed and running.
Installation
There are several ways to install the plugin:
-
Grafana UI: Install the plugin from your Grafana instance (Configuration > Data sources > Add Data source). Add Parseable as a data source at the data source configuration page.
-
Grafana CLI: Install the plugin using the command
grafana-cli plugins install parseable-parseable-datasource. Then restart Grafana. -
Grafana Helm Chart: Install the plugin by modifying the Grafana Chart
values.yamlfile. Add the following lines underplugins:section.
plugins:
# - digrich-bubblechart-panel
# - grafana-clock-panel
## You can also use other plugin download URL, as long as they are valid zip ## files, and specify the name of the plugin after the semicolon. Like this:
- https://grafana.com/api/plugins/parseable-parseable-datasource/versions/1.0.2/download;parseable-parseable-datasource
Add the following lines under datasources: section.
## Configure grafana datasources
## ref: http://docs.grafana.org/administration/provisioning/#datasources
##
datasources:
datasources.yaml:
apiVersion: 1
datasources:
- name: Parseable
type: parseable-parseable-datasource
url: http://parseable.parseable
access: proxy
isDefault: true
basicAuth: true
basicAuthUser: admin
secureJsonData:
basicAuthPassword: admin
Please remember to update the url, basicAuthUser and basicAuthPassword values with your Parseable server instance details.
-
If you're deploying Grafana and would like to install the plugin at the same time, you can use the
GF_INSTALL_PLUGINSenvironment variable. For example,GF_INSTALL_PLUGINS=parseable-parseable-datasource 1.0.2. Then restart Grafana. -
If you're provisioning Grafana using config management tools like Ansible, you can manage data sources in Grafana by adding YAML configuration files in the
provisioning/datasourcesdirectory. Refer Grafana documentation for more details.
Configuration
-
Configure the data source specifying URL and port like https://demo.parseable.com:443. Parseable supports basic auth, so toggle the
Basic Authoption underAuthsection and enter the username and password underBasic Auth Detailssection. If you're using Parseable demo server as the backend, useadmin,adminas the credentials. -
Push the Save and Test button, if there is an error message, check the credentials and connection.

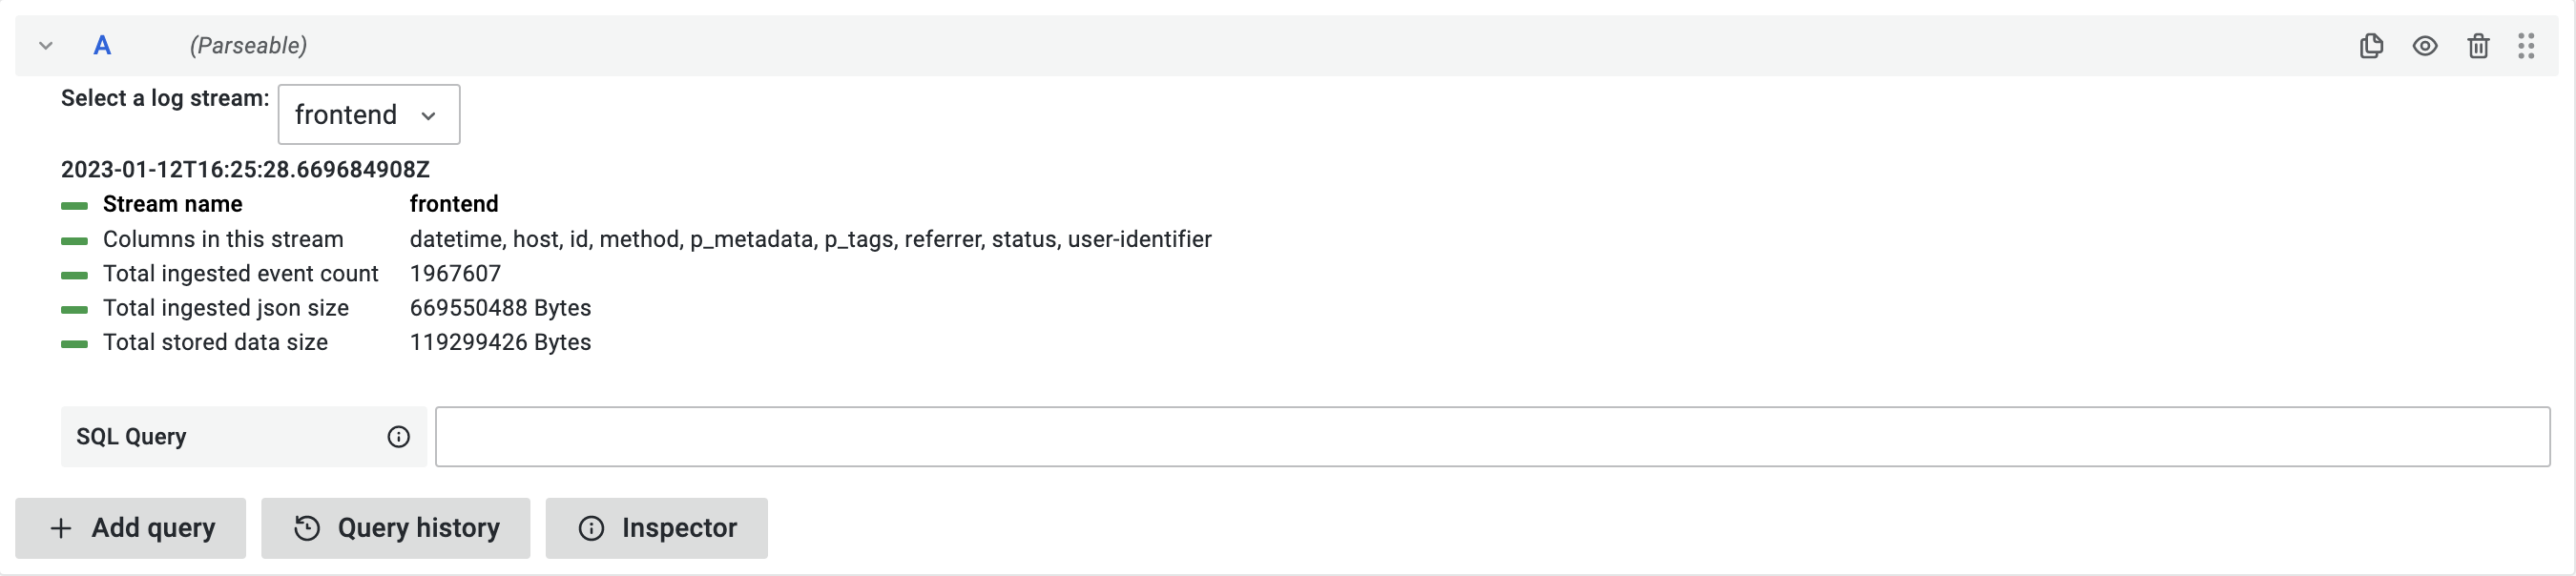
Usage
Once the plugin is configured with correct Parseable server instance. You can start using it to query and visualize logs. Use the query editor to write your own queries.
Alerts
Grafana allows you to set up alerts to continuously monitor your data and notify you when specific conditions are met. It ensures that you are promptly informed about any critical issues, allowing for quick resolution and maintaining system reliability.
Setting Up an Alert
- Navigate to
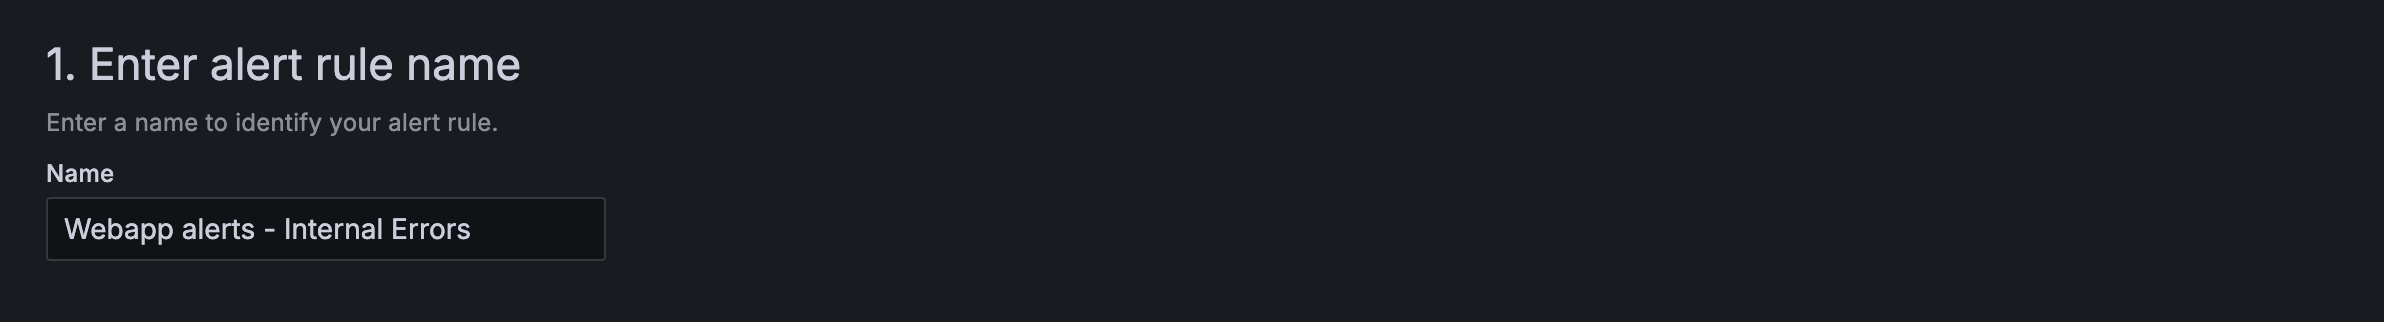
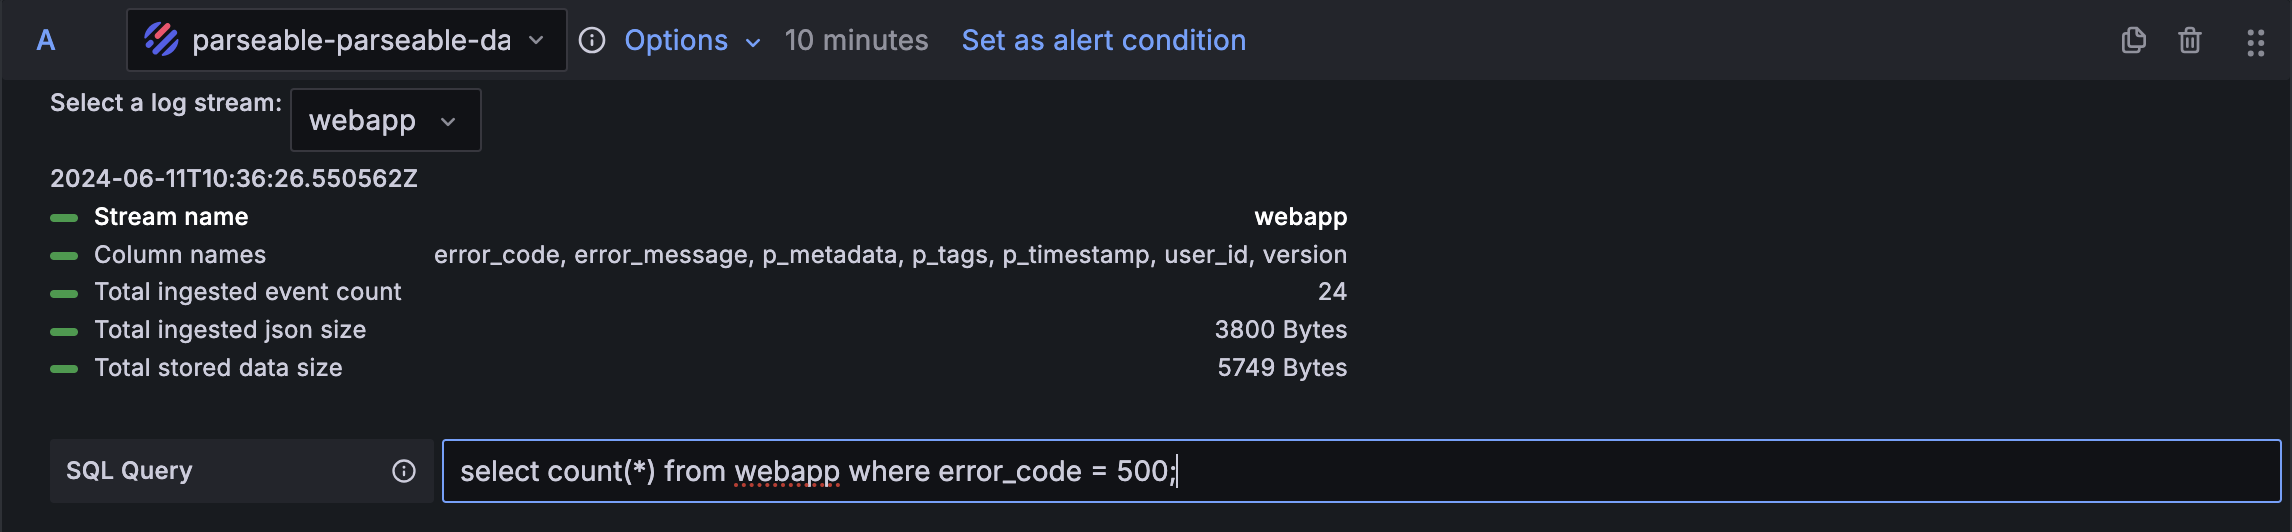
your-domain:port/alerting/new/alerting. - Add a unique rule name to identify the alert.
- Add a query that returns numerical values, as Grafana supports alerts only on numerical data.
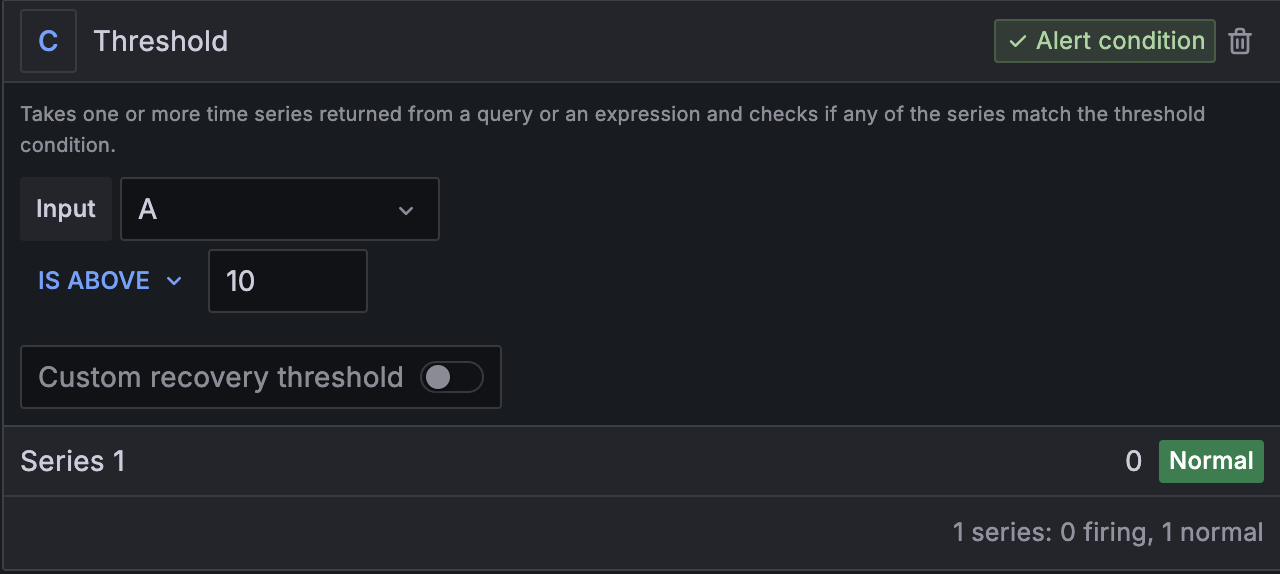
- Specify threshold behavior for the defined rule query.
- Define the evaluation behavior (e.g., eval frequency, grouping).
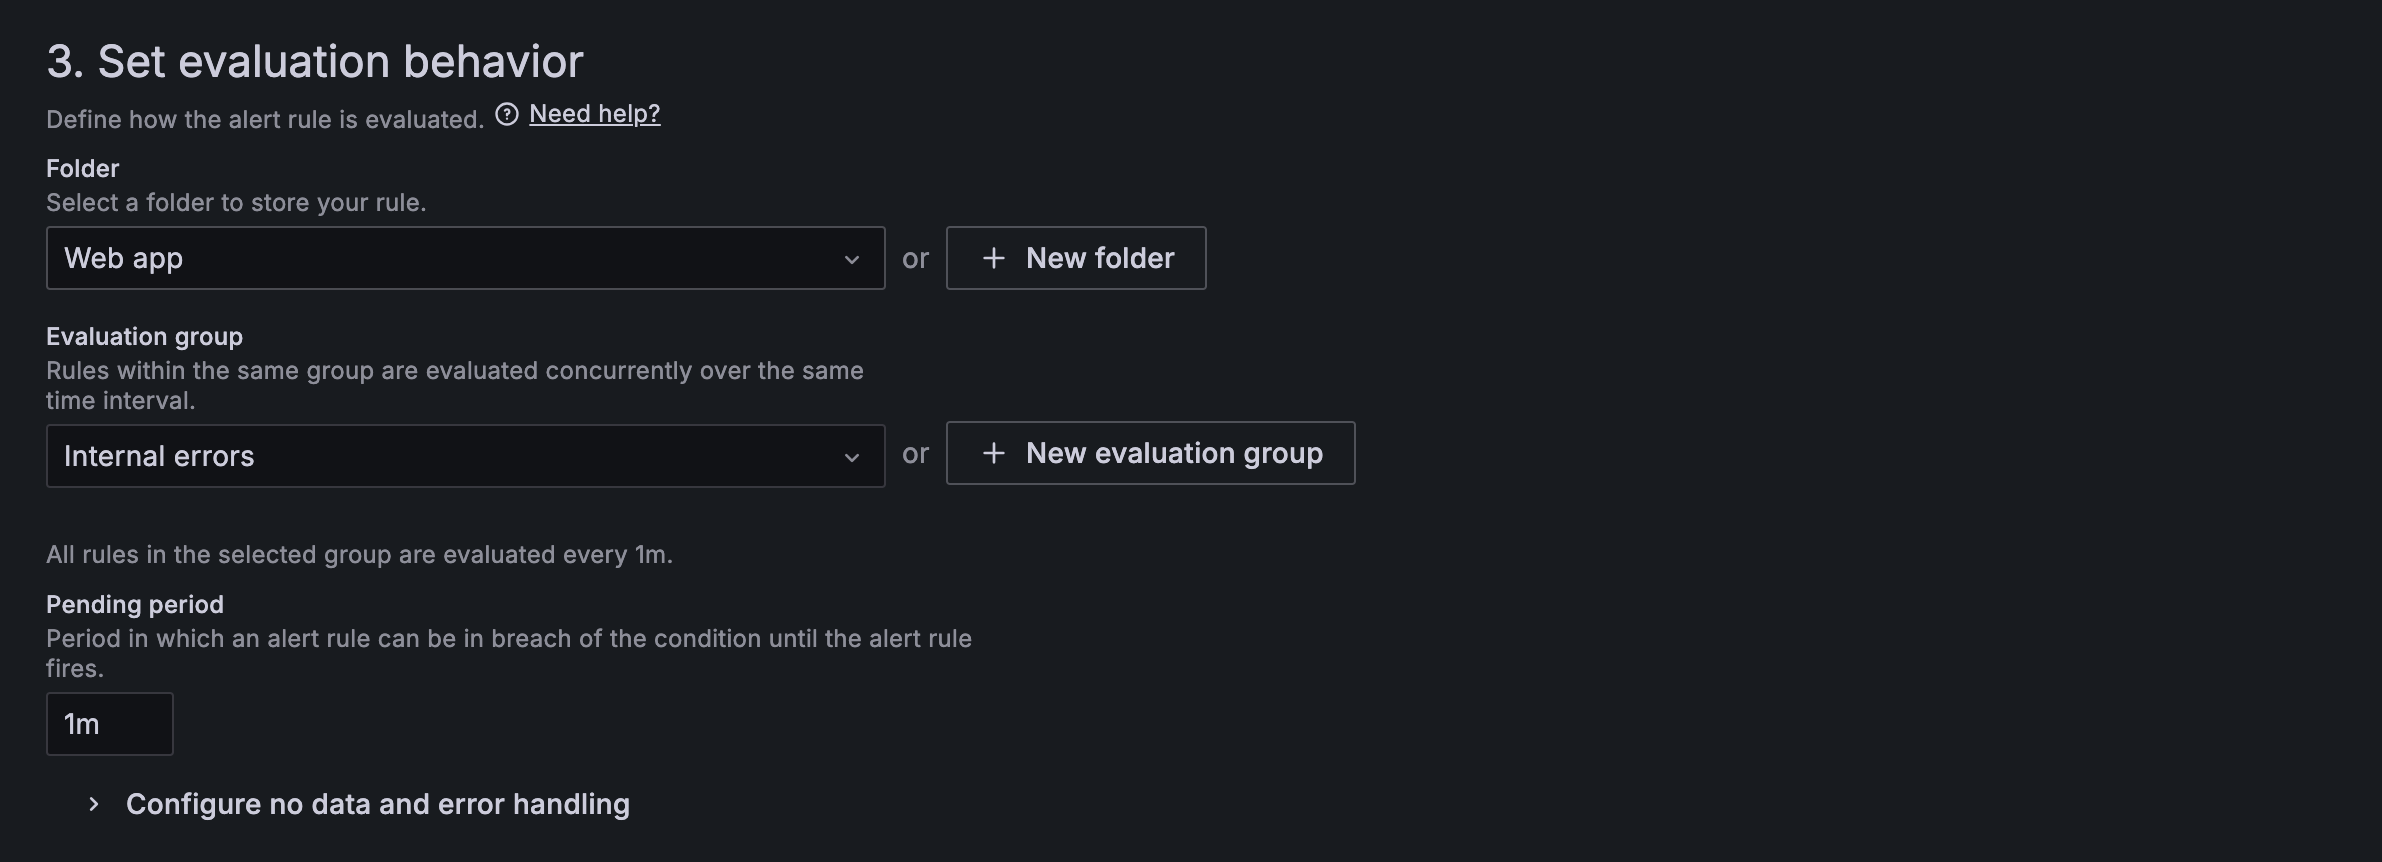
- Save the alert.
Managing Alerts
You can list, update, or delete all the alerts you have created by navigating to your-domain:port/alerting/list.

Alert Notification Channels
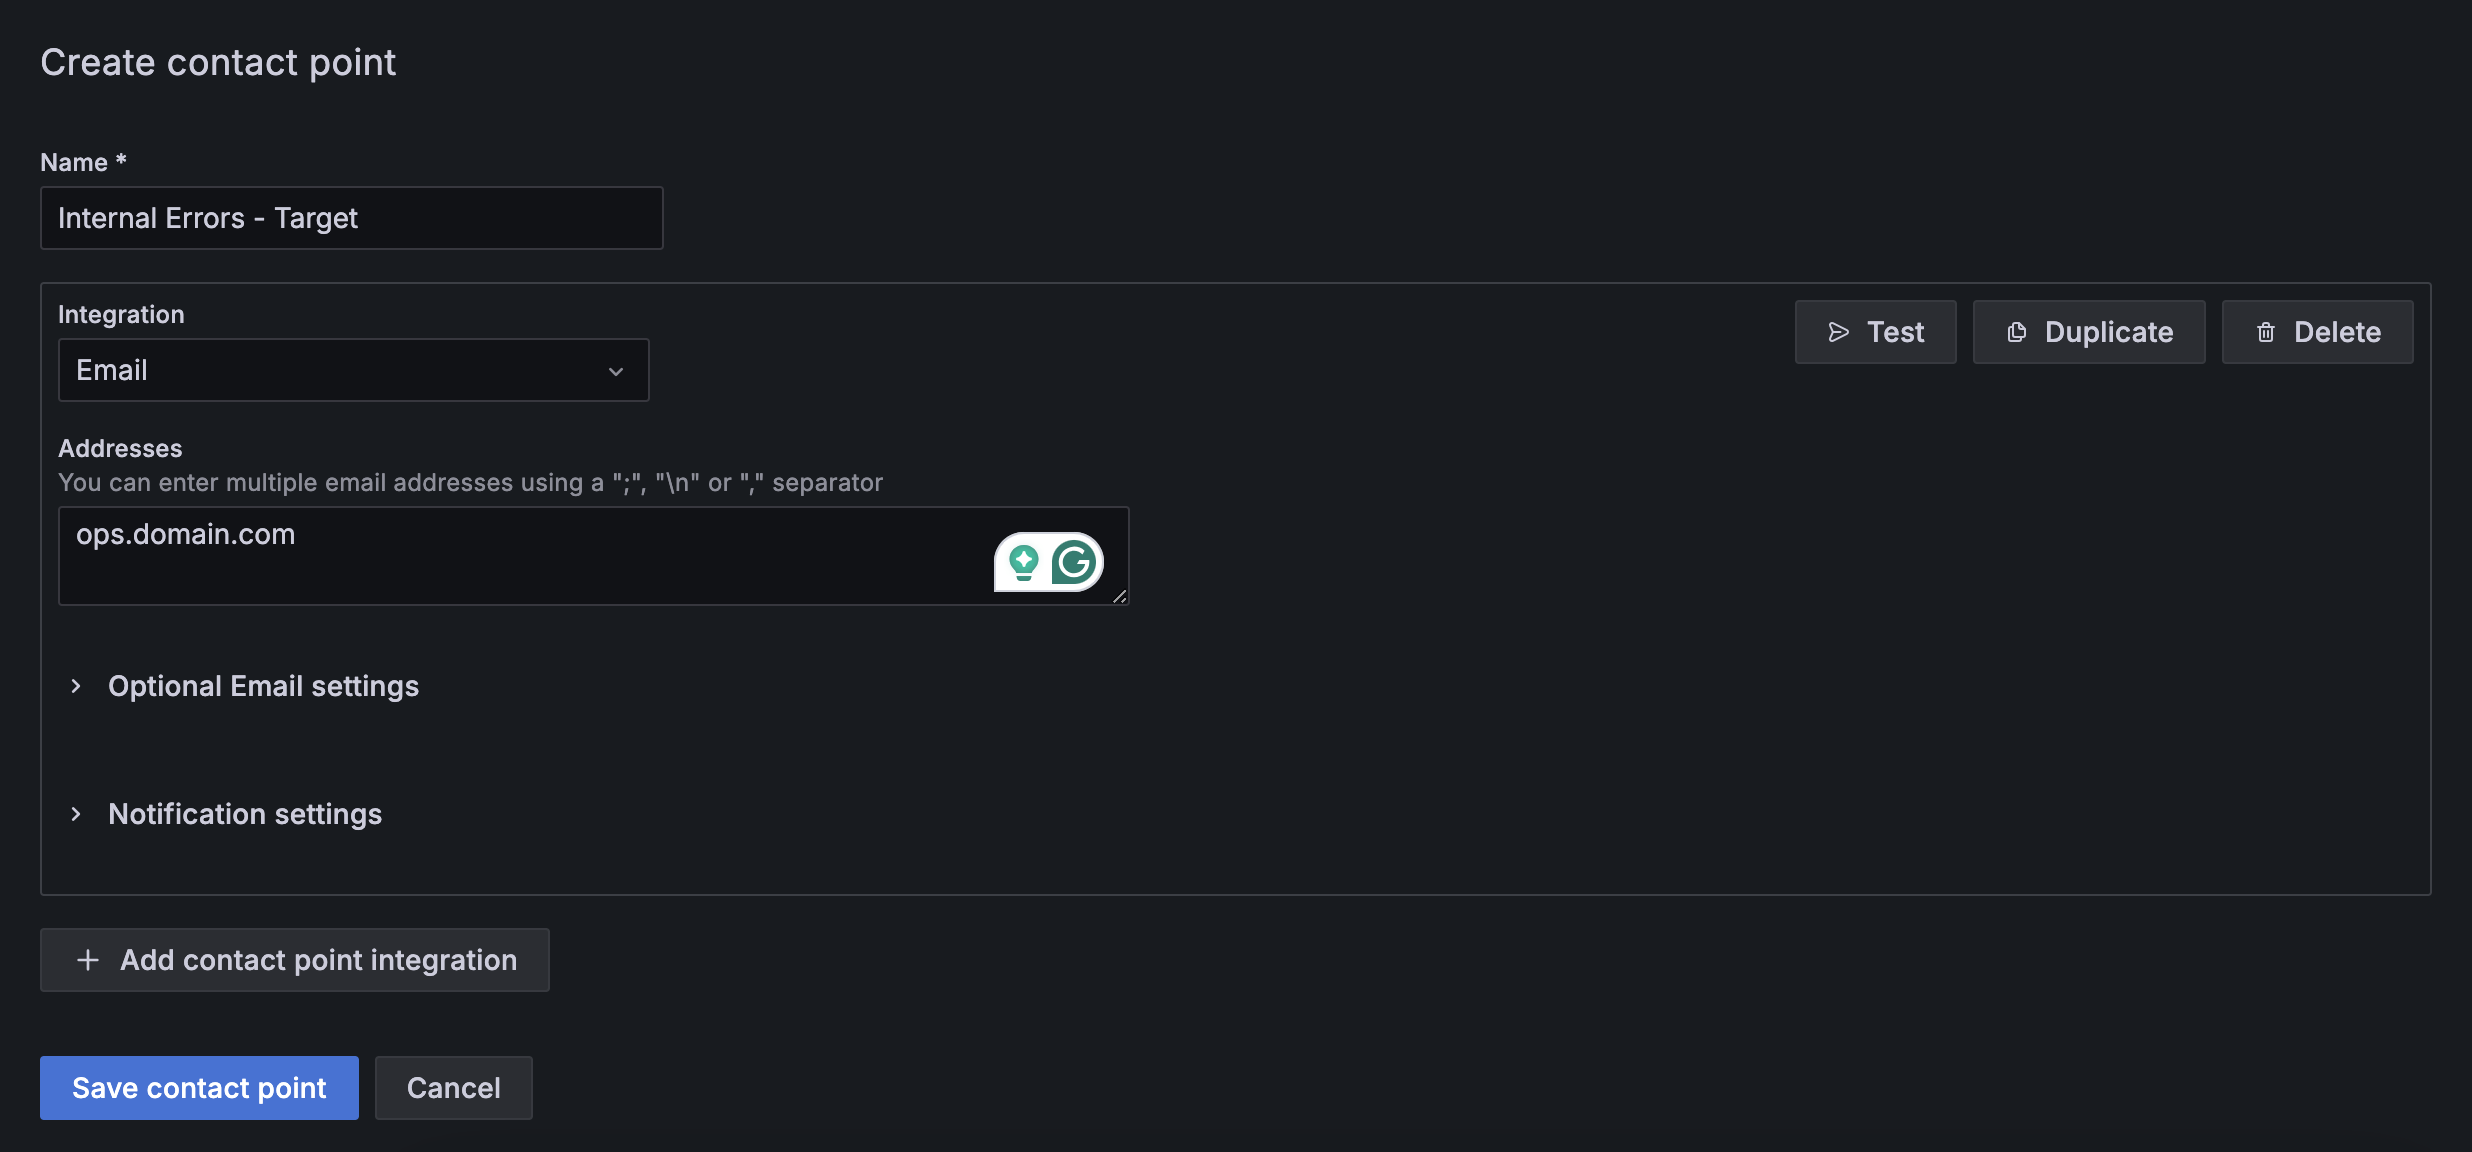
Set alert notification channels to receive alerts by navigating to your-domain:port/alerting/notifications/receivers/new. Grafana supports multiple integration targets, including Alertmanager, Email, Slack, Telegram, Webhook, Microsoft Teams, etc.
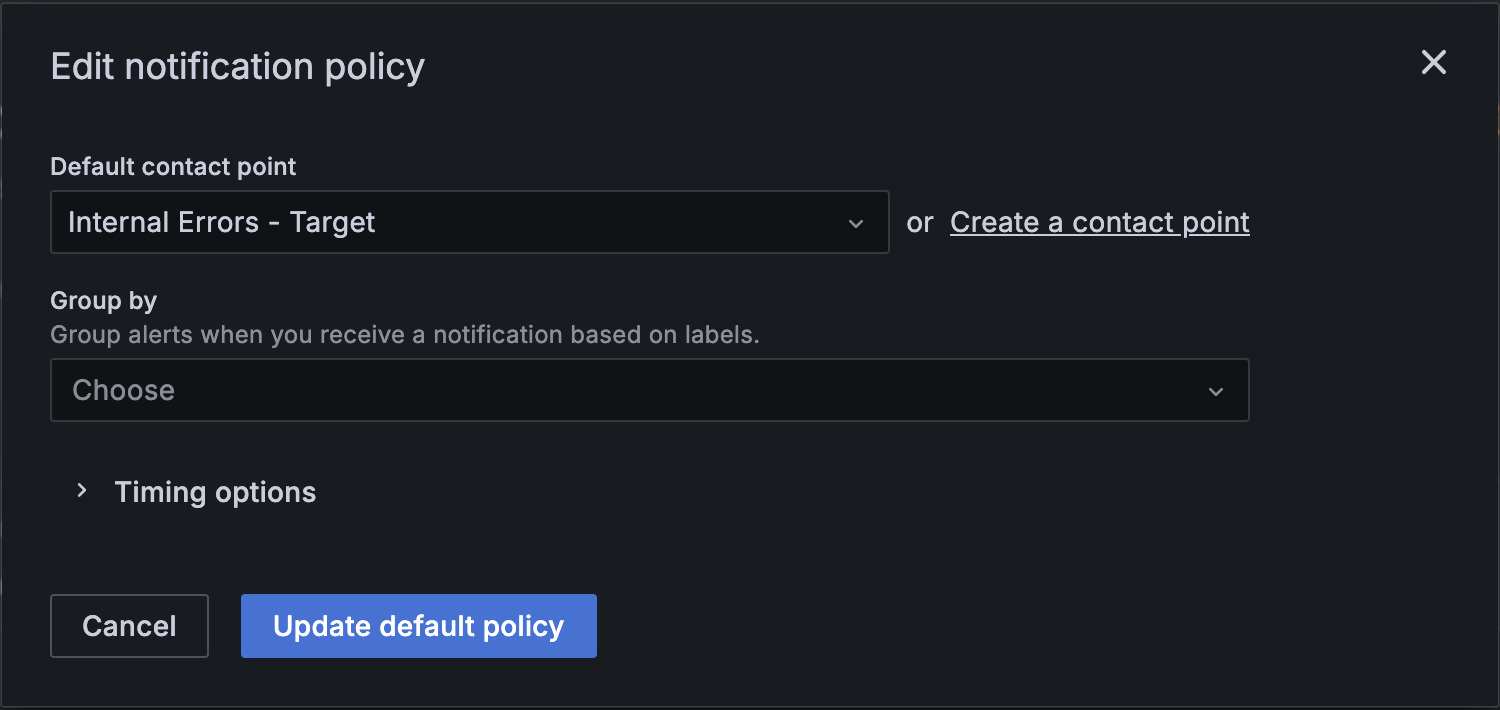
Notification Policies
Define notification policies to ensure you receive alerts on your preferred channels by configuring settings in your-domain:port/alerting/routes.
You can also check the alert status in the Grafana UI by navigating to the list page. There, you can view the current status of alerts, last fired time, last evaluated time, and rule query results.

Workarounds for Non-Numeric Data
In Grafana, alerting is primarily designed for numeric data since it relies on evaluating numerical thresholds and conditions. This means that most alert rules are based on numerical metrics, such as CPU usage, memory consumption, error rates, etc. However, you can get creative with how you process and transform other types of data into numeric forms suitable for alerting.
For example, you can map statuses like "OK", "WARN", and "ERROR" to values like 0, 1, and 2 respectively.
SELECT
...
CASE
WHEN status = 'OK' THEN 0
WHEN status = 'WARN' THEN 1
WHEN status = 'ERROR' THEN 2
END as status_value
FROM
table_name
Dashboards
Refer sample dashboard here: Grafana Dashboard Demo. Credentials (admin, admin123).
Screenshots