

Introduction
Shipping code is getting easier everyday with AI. Knowing if your deploys worked, why they slowed down, and how to fix them is hard. GitOps hides most of CD behind commits and controllers. You need clear signals, metrics, events, and logs, mapped to delivery outcomes.
In this post, we’ll wire Argo CD to Parseable, collect telemetry data, and turn it into answers with famous DORA metrics approach.
Quick refresher on DORA metrics
DORA metrics are four key performance indicators developed by Google's DevOps Research and Assessment team to evaluate the performance of software development and delivery processes. They help teams understand how effectively they deliver software and identify areas for improvement. The four DORA metrics are: Deployment Frequency, Change Failure Rate, Time to Restore Service, and Lead Time for Changes.
Tying DORA metrics to Argo CD telemetry
Tie your checks to the four DORA metrics. They frame the “so what?” of CD:
-
Deployment Frequency — How often did you ship? Source: successful syncs per app/env.
-
Change Failure Rate (CFR) — How many deploys fail or roll back? Source: failed syncs + rollbacks vs total.
-
Time to Restore — How fast do you recover from a bad deploy? Source: time from Degraded to next Healthy.
-
Lead Time (CD view) — How fast from merge to production? Source: commit/PR metadata + deploy timestamp.
All the DORA metrics can be tied to below Argo CD signals:
sync_status,health_statusargocd_app_sync_total,argocd_app_sync_duration_seconds_*- Repo request errors, API latencies (
argocd_git_*, server metrics) - Argo roll outs metrics (canary success rate, aborts, step durations)
Setup
Parseable installation
First, deploy Parseable using Docker or Kubernetes following the installation guide. For this setup, ensure Parseable is configured with OTLP ingestion enabled on port 8000. Configure authentication by setting up the username and password that will be used by the OpenTelemetry Collector and other components to securely send data to Parseable.
OpenTelemetry Collector
In this step we create a Collector config that scrapes Argo CD’s metrics ports and exports over OTLP/HTTP to Parseable. Please ensure to adjust service names/ports to your install (common ports shown).
# otel-argocd.yaml
receivers:
  prometheus:
    config:
      scrape_configs:
        - job_name: argocd
          scrape_interval: 10s
          static_configs:
            - targets:
                - argocd-application-controller:8082
                - argocd-server-metrics:8083
                - argocd-repo-server:8084
                - argocd-commit-server:8087

exporters:
  otlphttp/parseablemetrics:
    endpoint: "http://parseable:8000"
    headers:
      Authorization: "Basic YWRtaW46YWRtaW4="
      X-P-Stream: argo-metrics
      X-P-Log-Source: otel-metrics
      Content-Type: application/json
    tls:
      insecure: true

processors:
  batch:
    send_batch_size: 8192
    timeout: 5s

service:
  pipelines:
    metrics:
      receivers: [prometheus]
      processors: [batch]
      exporters: [otlphttp/parseablemetrics]
Deploy the Collector (DaemonSet or Deployment). Pass PARSEABLE_TOKEN as a secret/env and PARSEABLE_HOST. Keep scrape intervals consistent with your alerting windows.
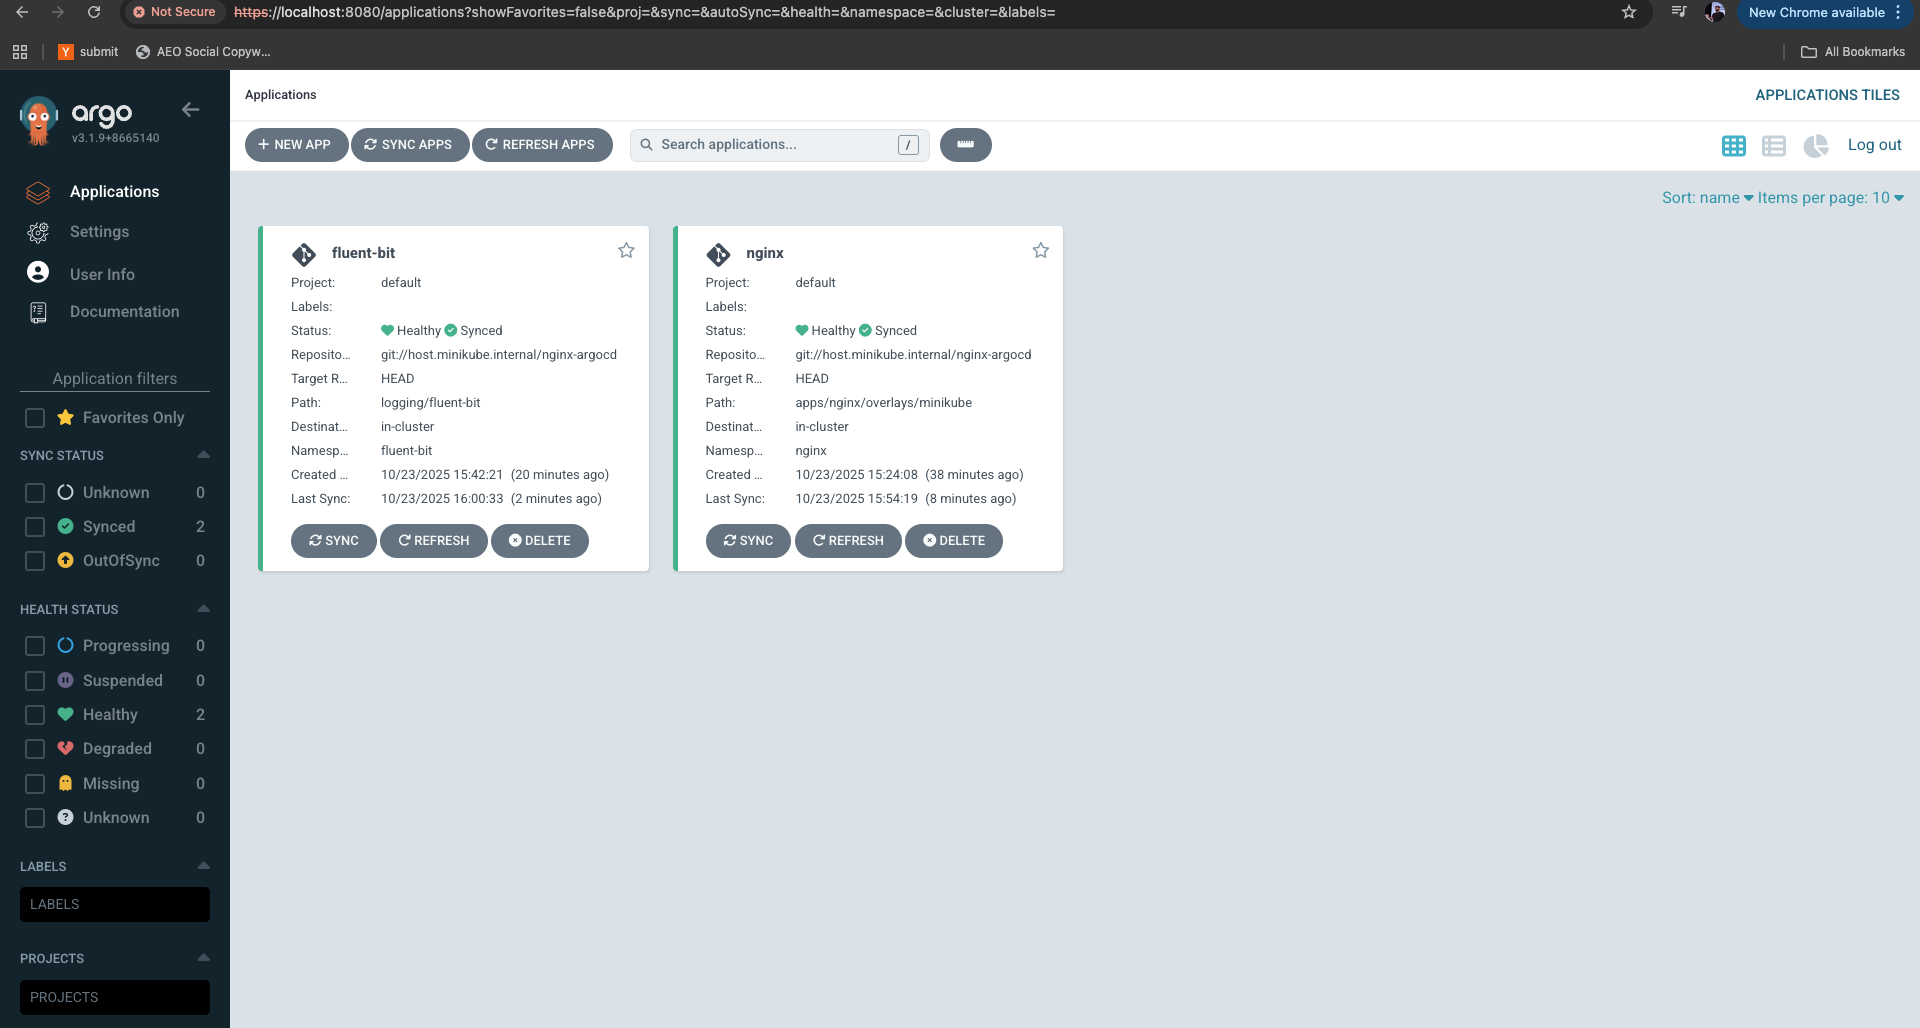
Fluent Bit
We're using Fluent Bit to collect Argo CD logs and forward them to Parseable.
# fluent-bit-argocd.conf
[SERVICE]
    Flush        5
    Daemon       Off

[INPUT]
    Name         tail
    Path         /var/log/containers/argocd-*.log
    Parser       cri
    Tag          kube.argocd

[FILTER]
    Name         kubernetes
    Match        kube.*
    Kube_URL     https://kubernetes.default.svc
    Merge_Log    On

# Use HTTP output if you expose a JSON ingest endpoint in Parseable.
# If you prefer OTLP, use the opentelemetry output with /v1/logs.
[OUTPUT]
    Name         http
    Match        kube.*
    Host         parseable.example.com
    Port         443
    URI          /ingest/logs
    Format       json
    tls          On
    Header       X-P-Stream argo-logs
    Header       Authorization Bearer <TOKEN>
Build dashboards that matter
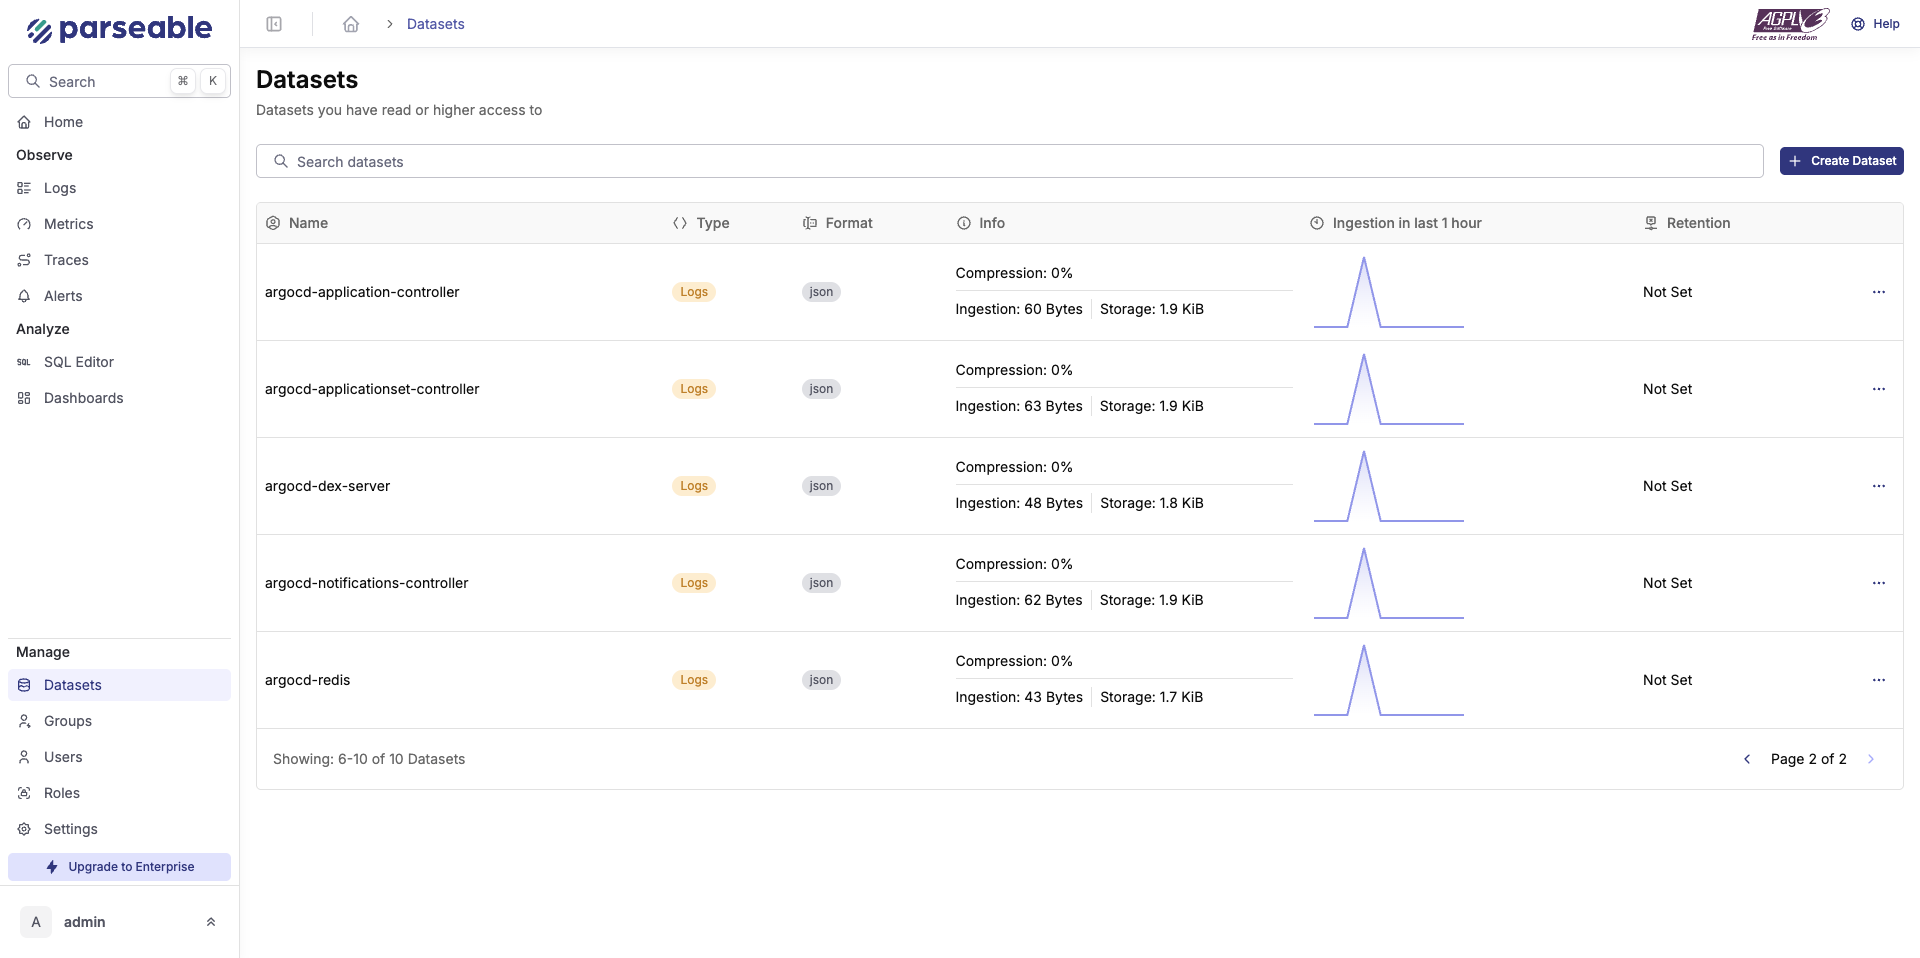
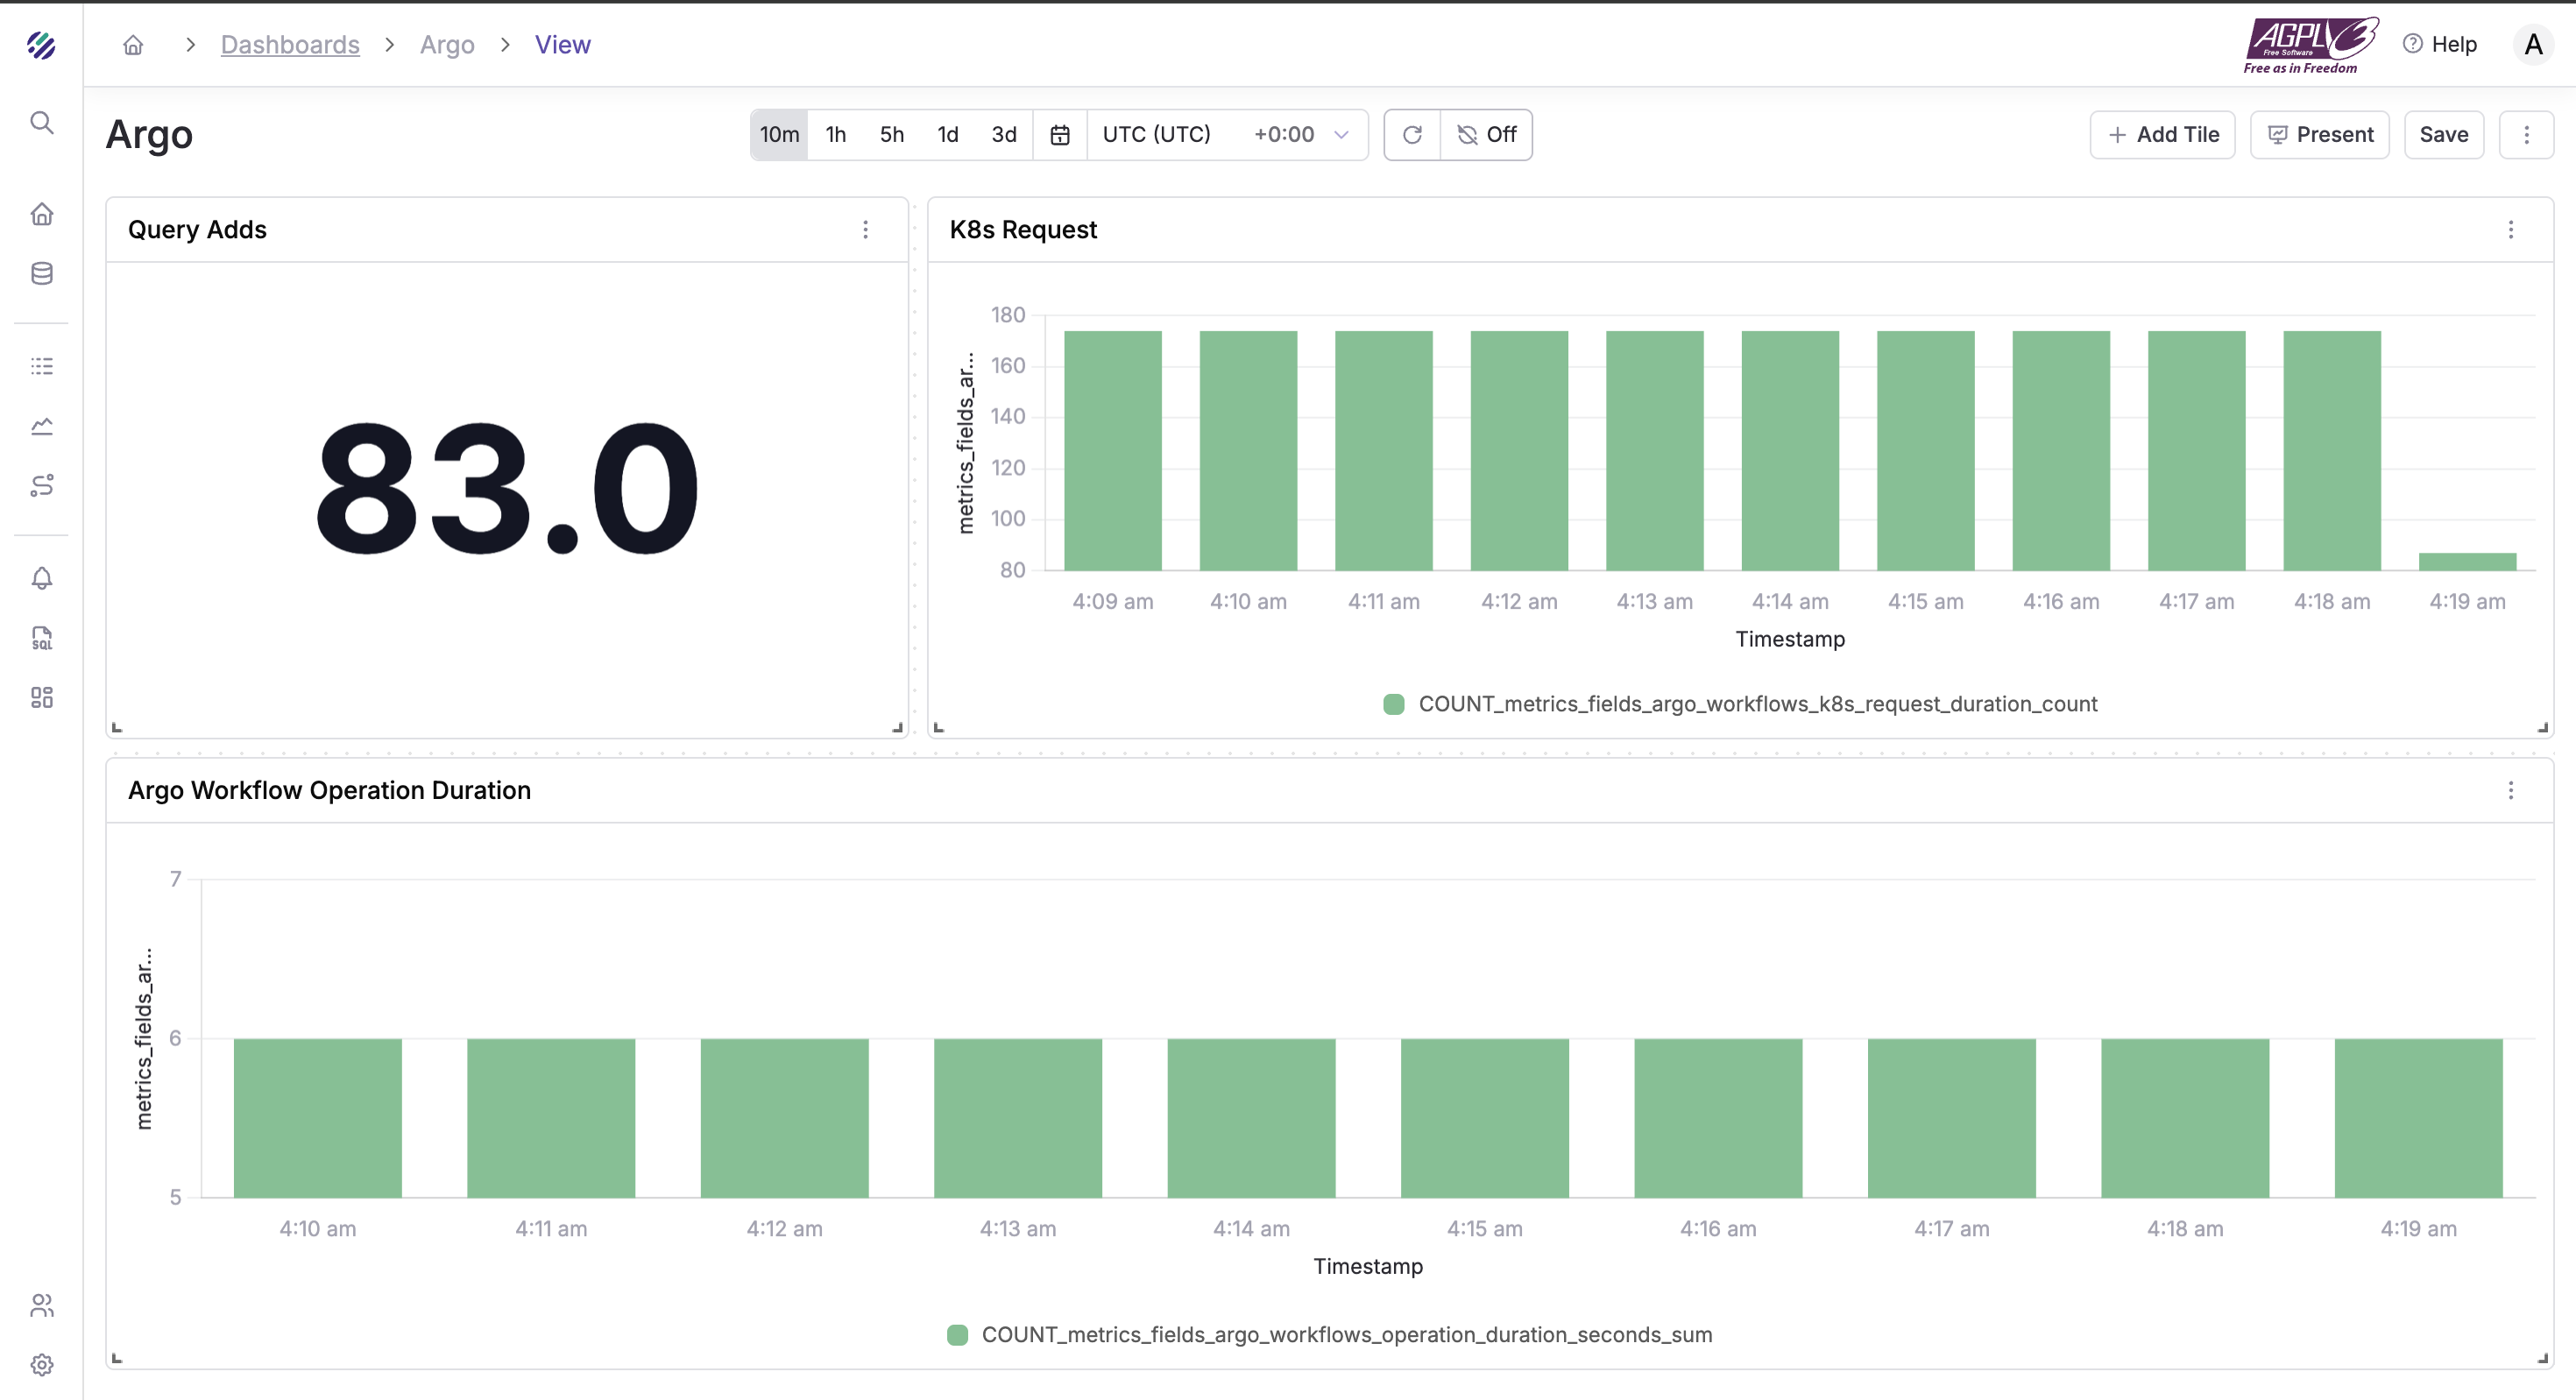
Now that we have all the data flowing into Parseable, let’s build a dashboard that surfaces the DORA metrics and key Argo CD health signals. Here are the high level topics to cover:
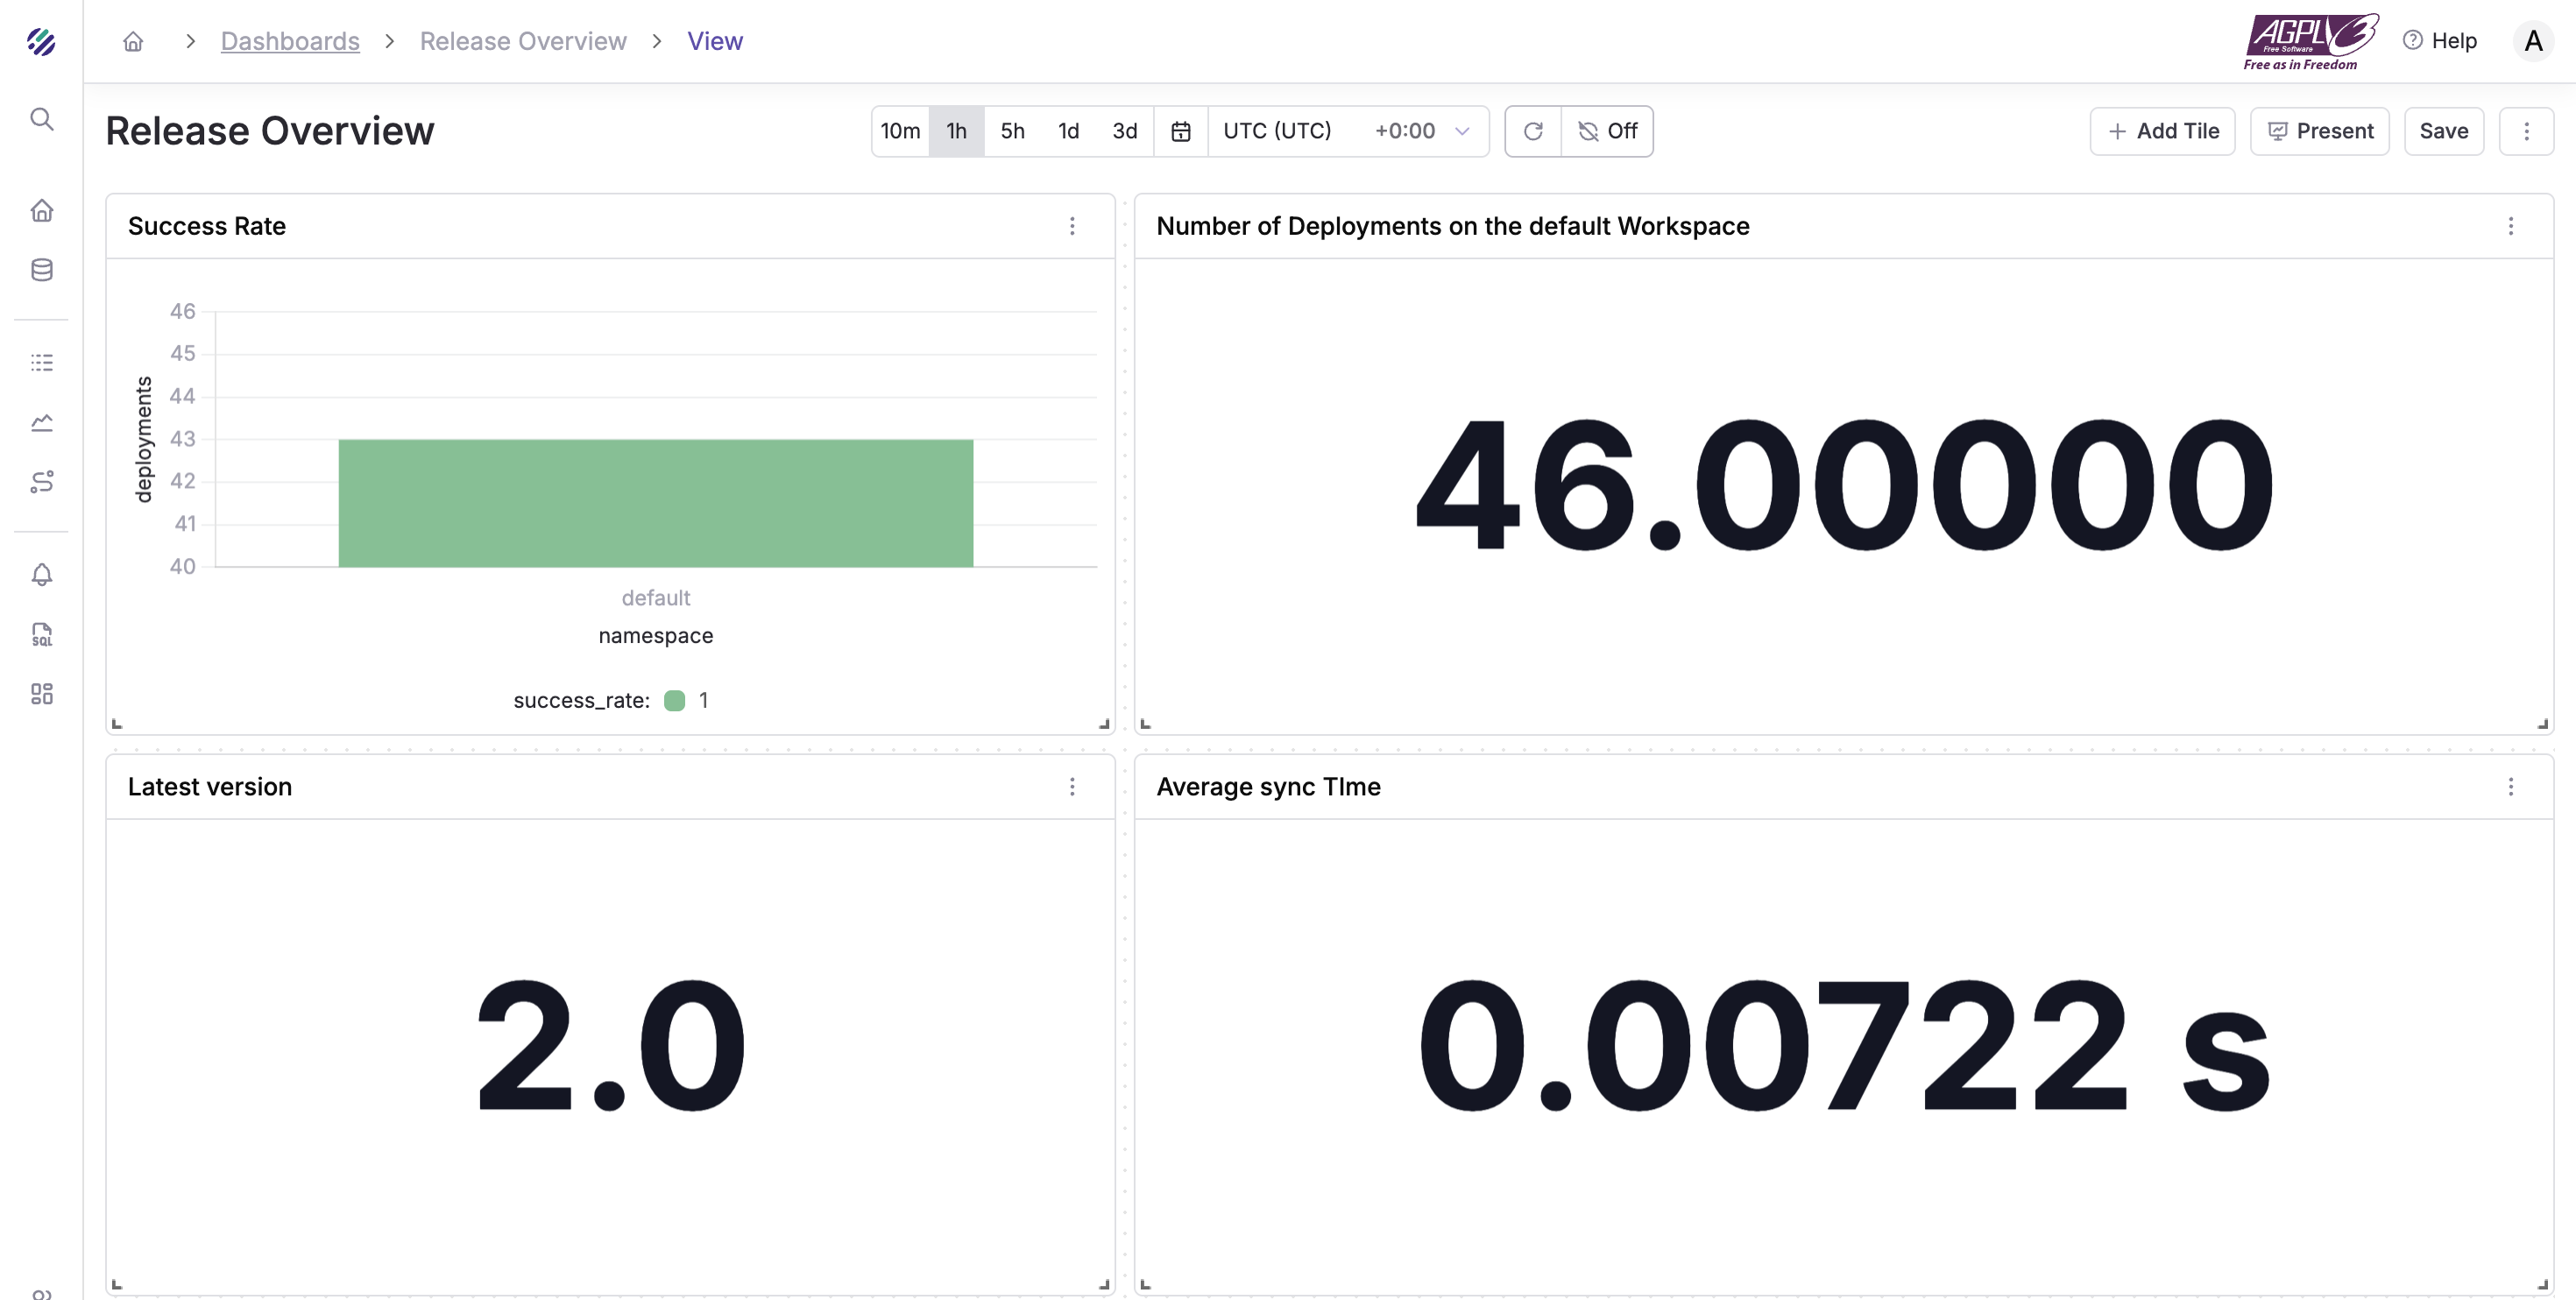
Releases Overview
- Deployments/day
- Success rate
- p95 sync duration
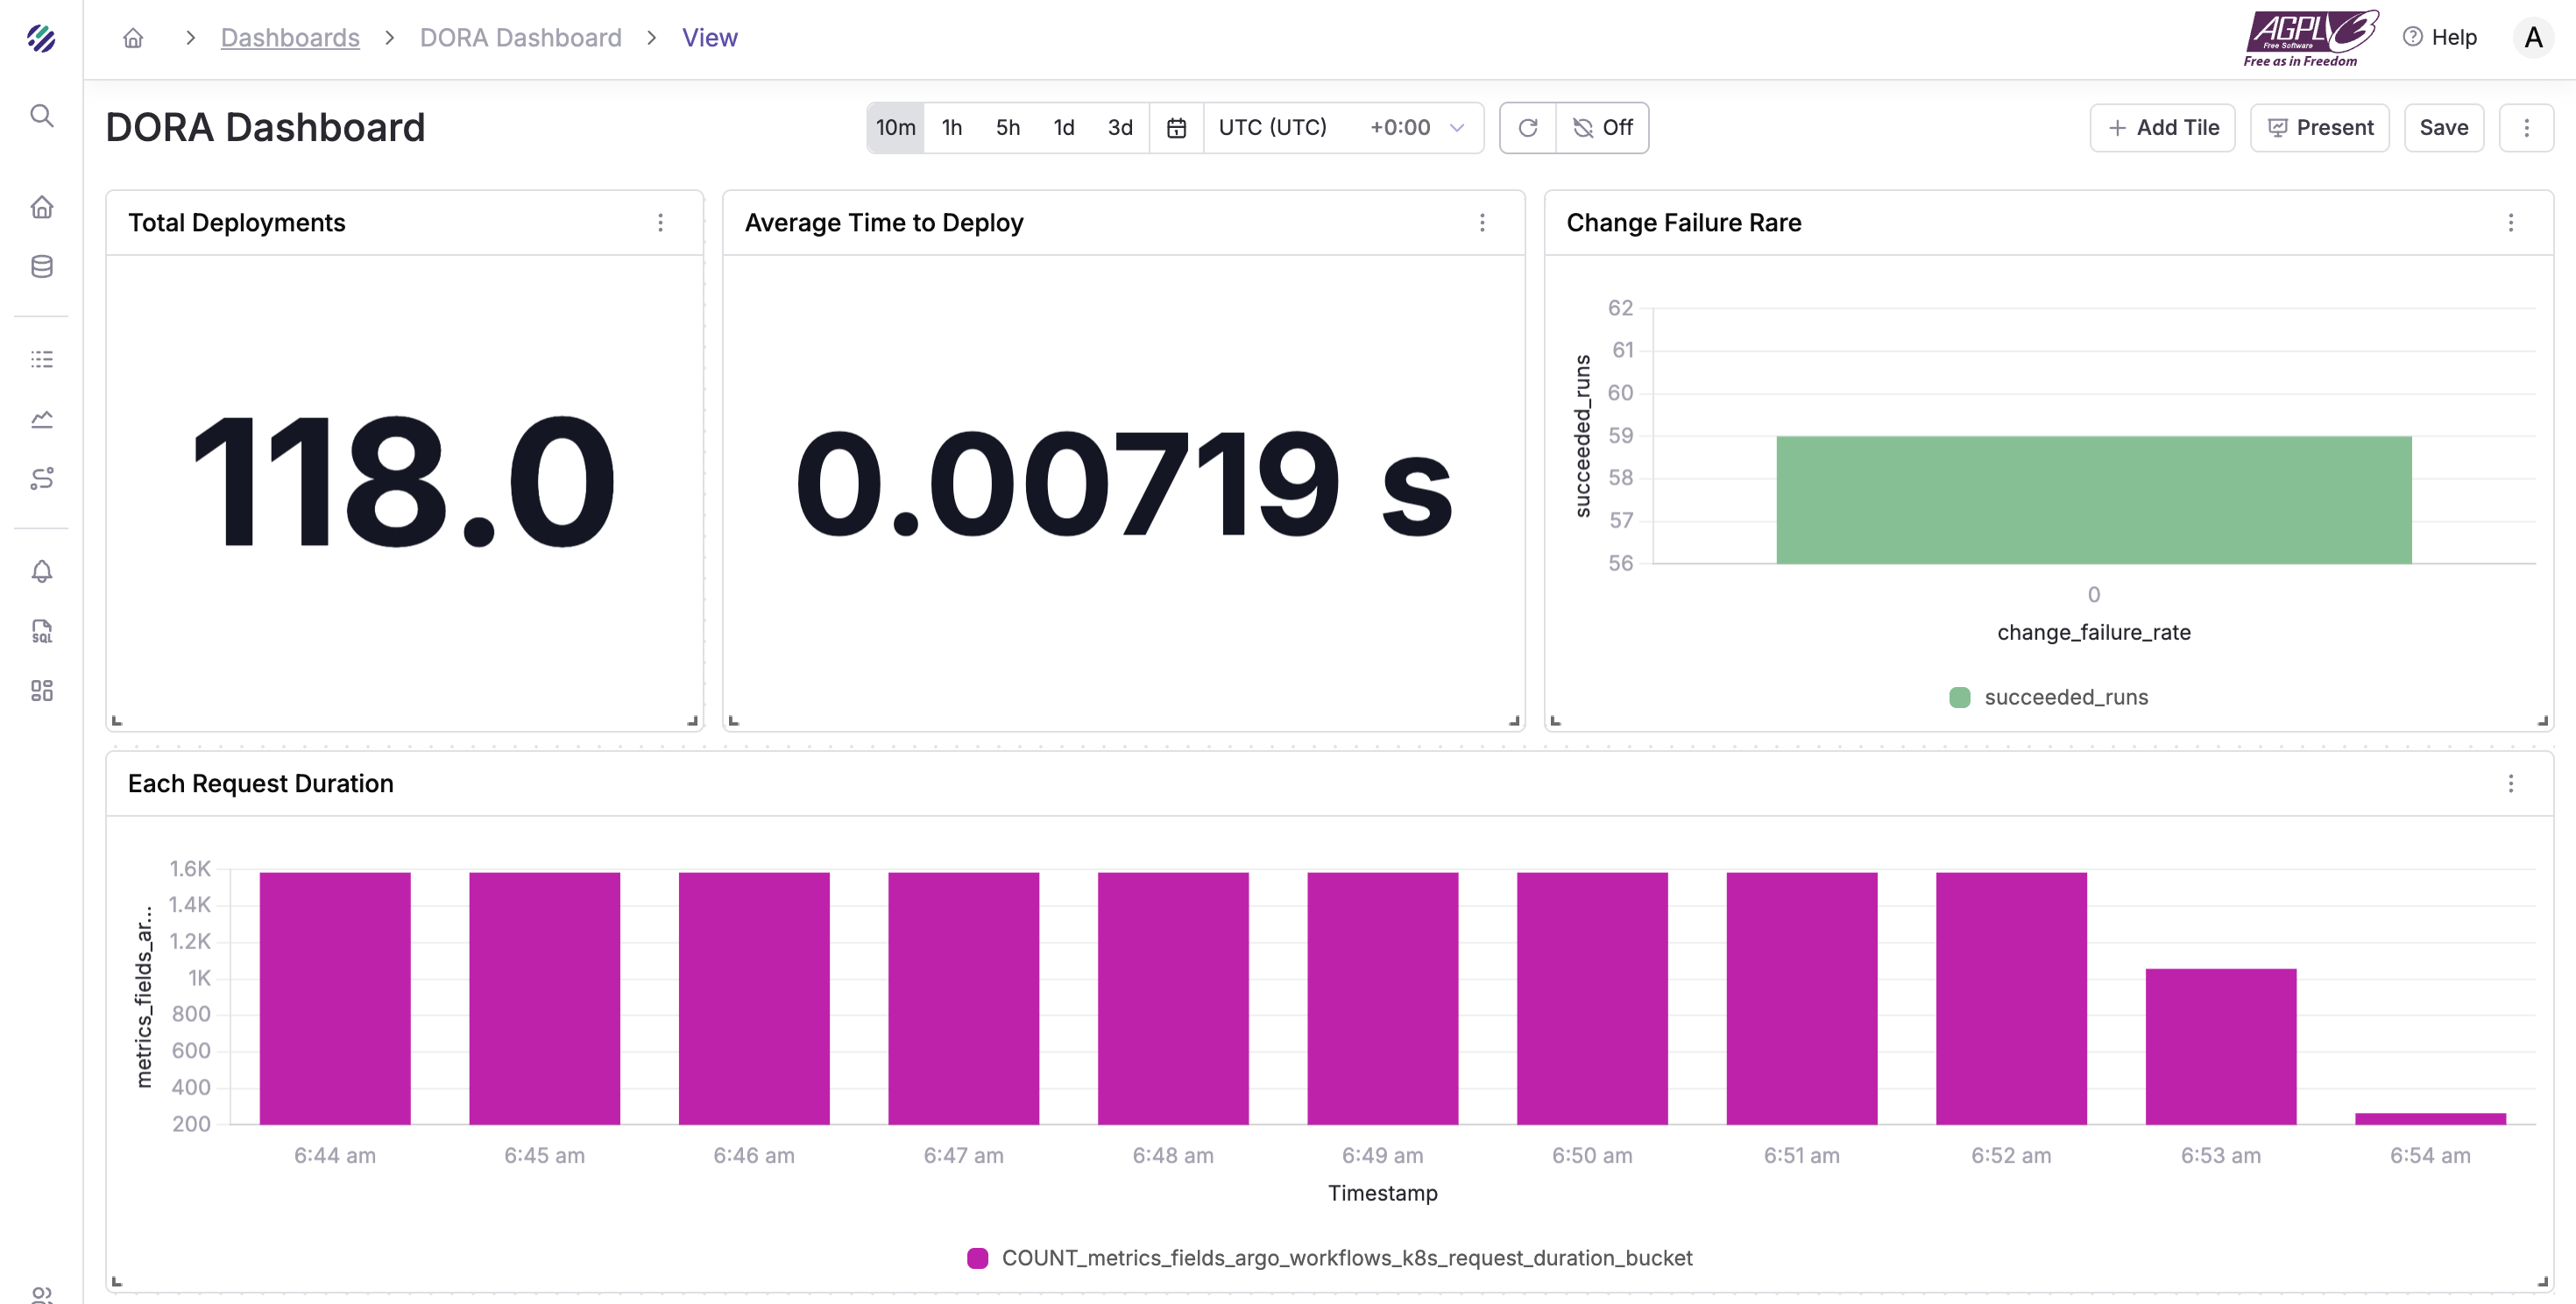
DORA Summary
- Weekly Frequency
- CFR
- Time to Restore (median)
- Simple trend spark lines
Progressive Delivery (if using Argo Rollouts)
- Canary success rate
- Analysis failures
- Aborts by rollout
Comprehensive Argo/OTel metrics queries
Below are essential SQL queries for analyzing your Argo CD and OpenTelemetry metrics in Parseable. These queries assume your metrics are stored in the "otel-metrics" stream.
Workflow conditions / phases
SELECT
  COALESCE(metrics_tags_phase, 'unknown') AS phase,
  SUM(metrics_fields_argo_workflows_workflow_condition) AS wf_count
FROM "otel-metrics"
WHERE p_timestamp > now() - INTERVAL '30 minutes'
GROUP BY COALESCE(metrics_tags_phase, 'unknown')
ORDER BY wf_count DESC;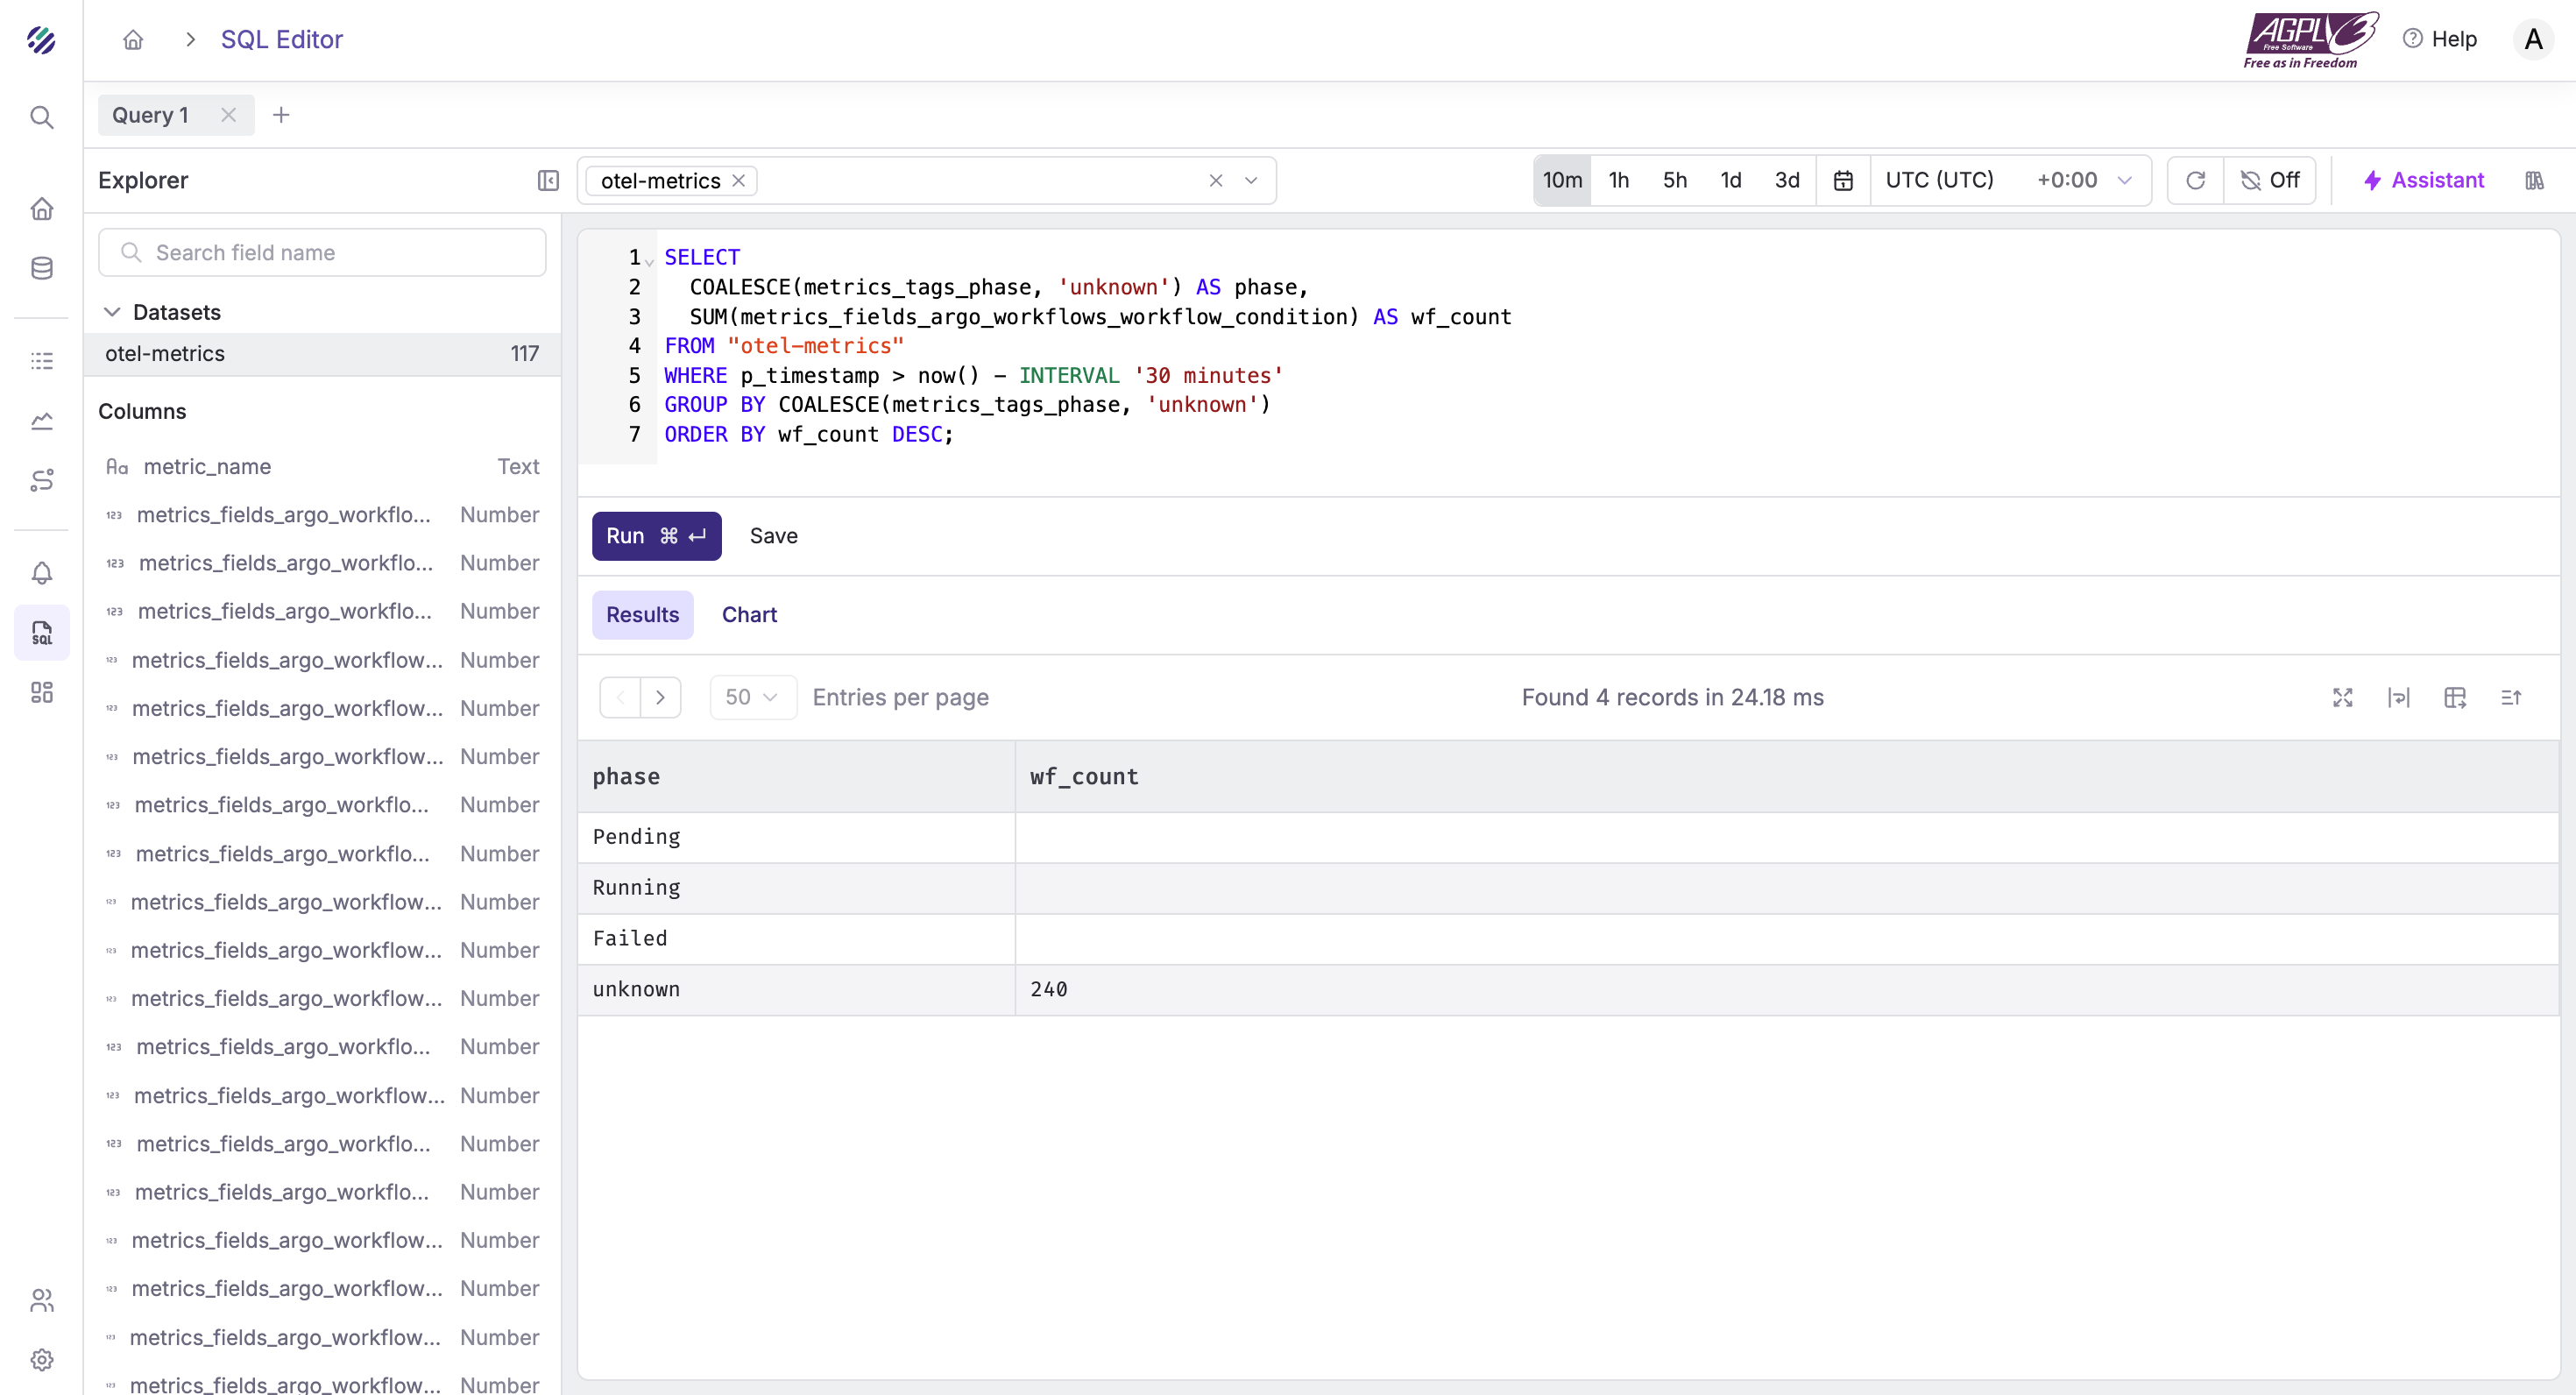
K8s API latency (buckets)
SELECT
  COALESCE(metrics_tags_verb, 'ALL') AS verb,
  COALESCE(metrics_tags_url,  'ALL') AS url,
  metrics_tags_le                    AS le,
  SUM(metrics_fields_argo_workflows_k8s_request_duration_bucket) AS bucket_count
FROM "otel-metrics"
WHERE p_timestamp > now() - INTERVAL '15 minutes'
GROUP BY verb, url, metrics_tags_le
ORDER BY verb, url, le;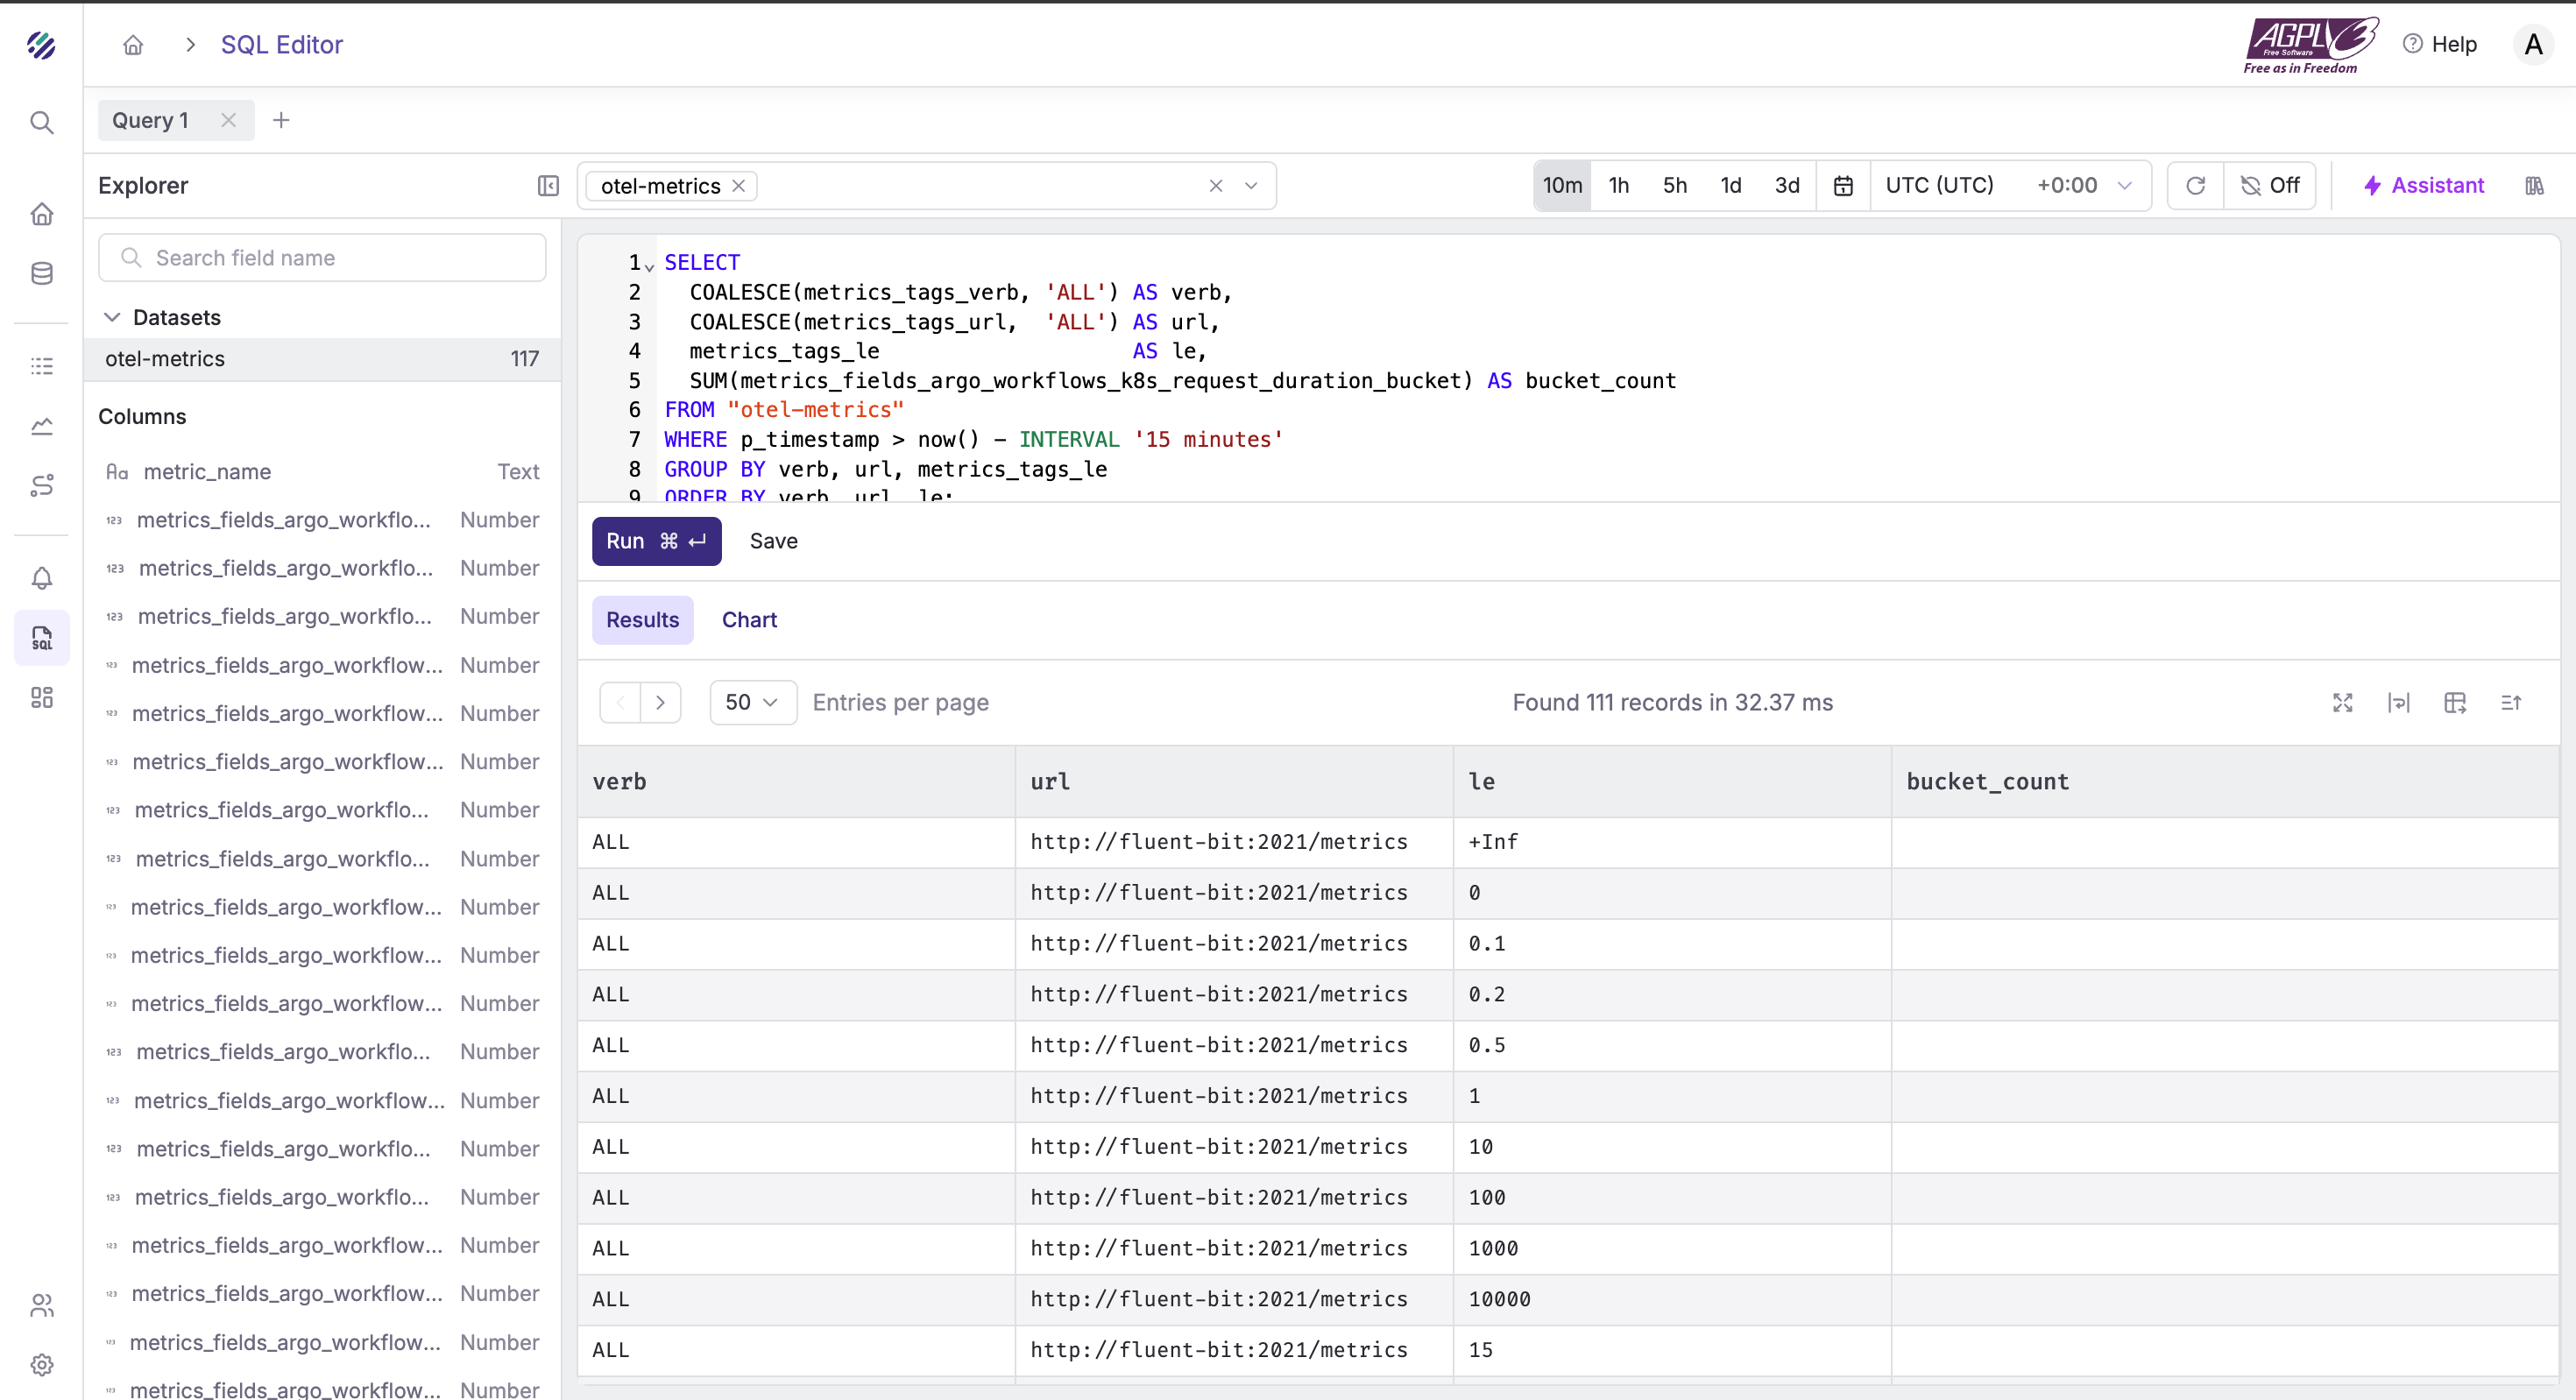
Queue health — depth and unfinished work
SELECT
  COALESCE(metrics_tags_queue_name, 'default') AS queue_name,
  MAX(metrics_fields_argo_workflows_queue_depth_gauge)      AS max_depth,
  MAX(metrics_fields_argo_workflows_queue_unfinished_work)  AS max_unfinished,
  MAX(metrics_fields_argo_workflows_queue_longest_running)  AS max_longest_running
FROM "otel-metrics"
WHERE p_timestamp > now() - INTERVAL '15 minutes'
GROUP BY COALESCE(metrics_tags_queue_name, 'default')
ORDER BY max_depth DESC;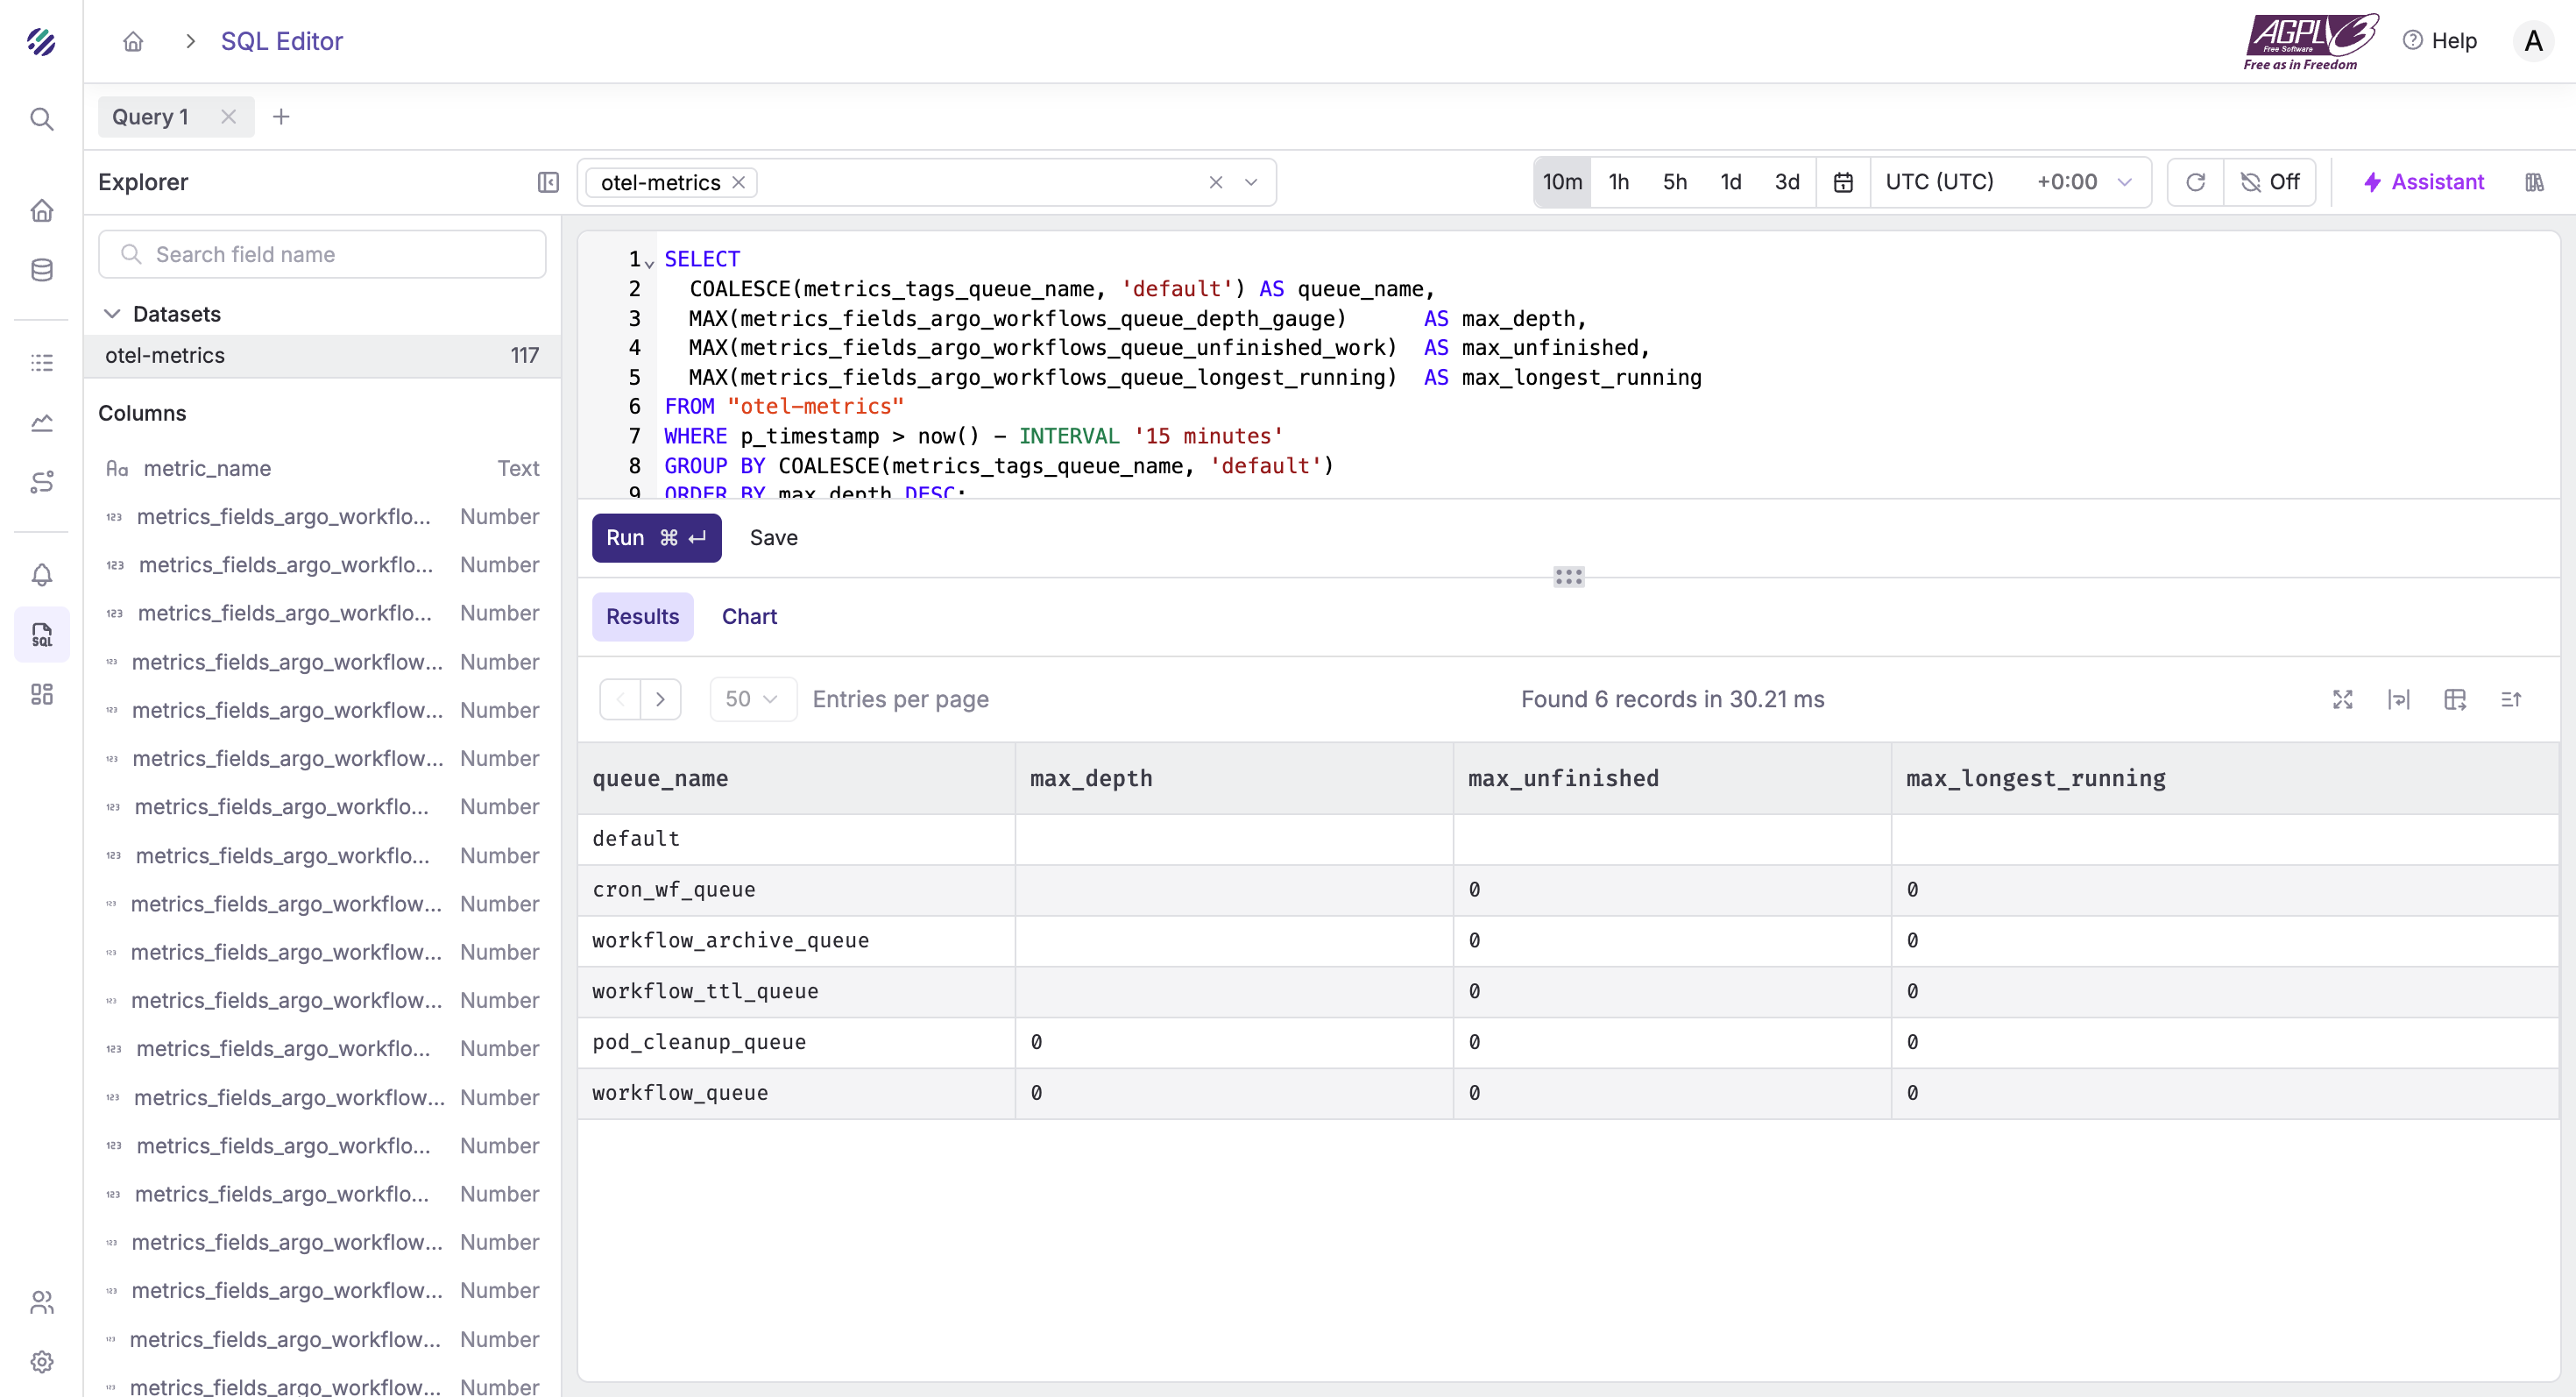
Workers — are we saturated?
SELECT
  MAX(metrics_fields_argo_workflows_workers_busy_count)  AS workers_busy,
  MAX(metrics_fields_argo_workflows_queue_depth_gauge)   AS queue_depth,
  MAX(metrics_fields_argo_workflows_queue_adds_count)    AS queue_adds
FROM "otel-metrics"
WHERE p_timestamp > now() - INTERVAL '15 minutes';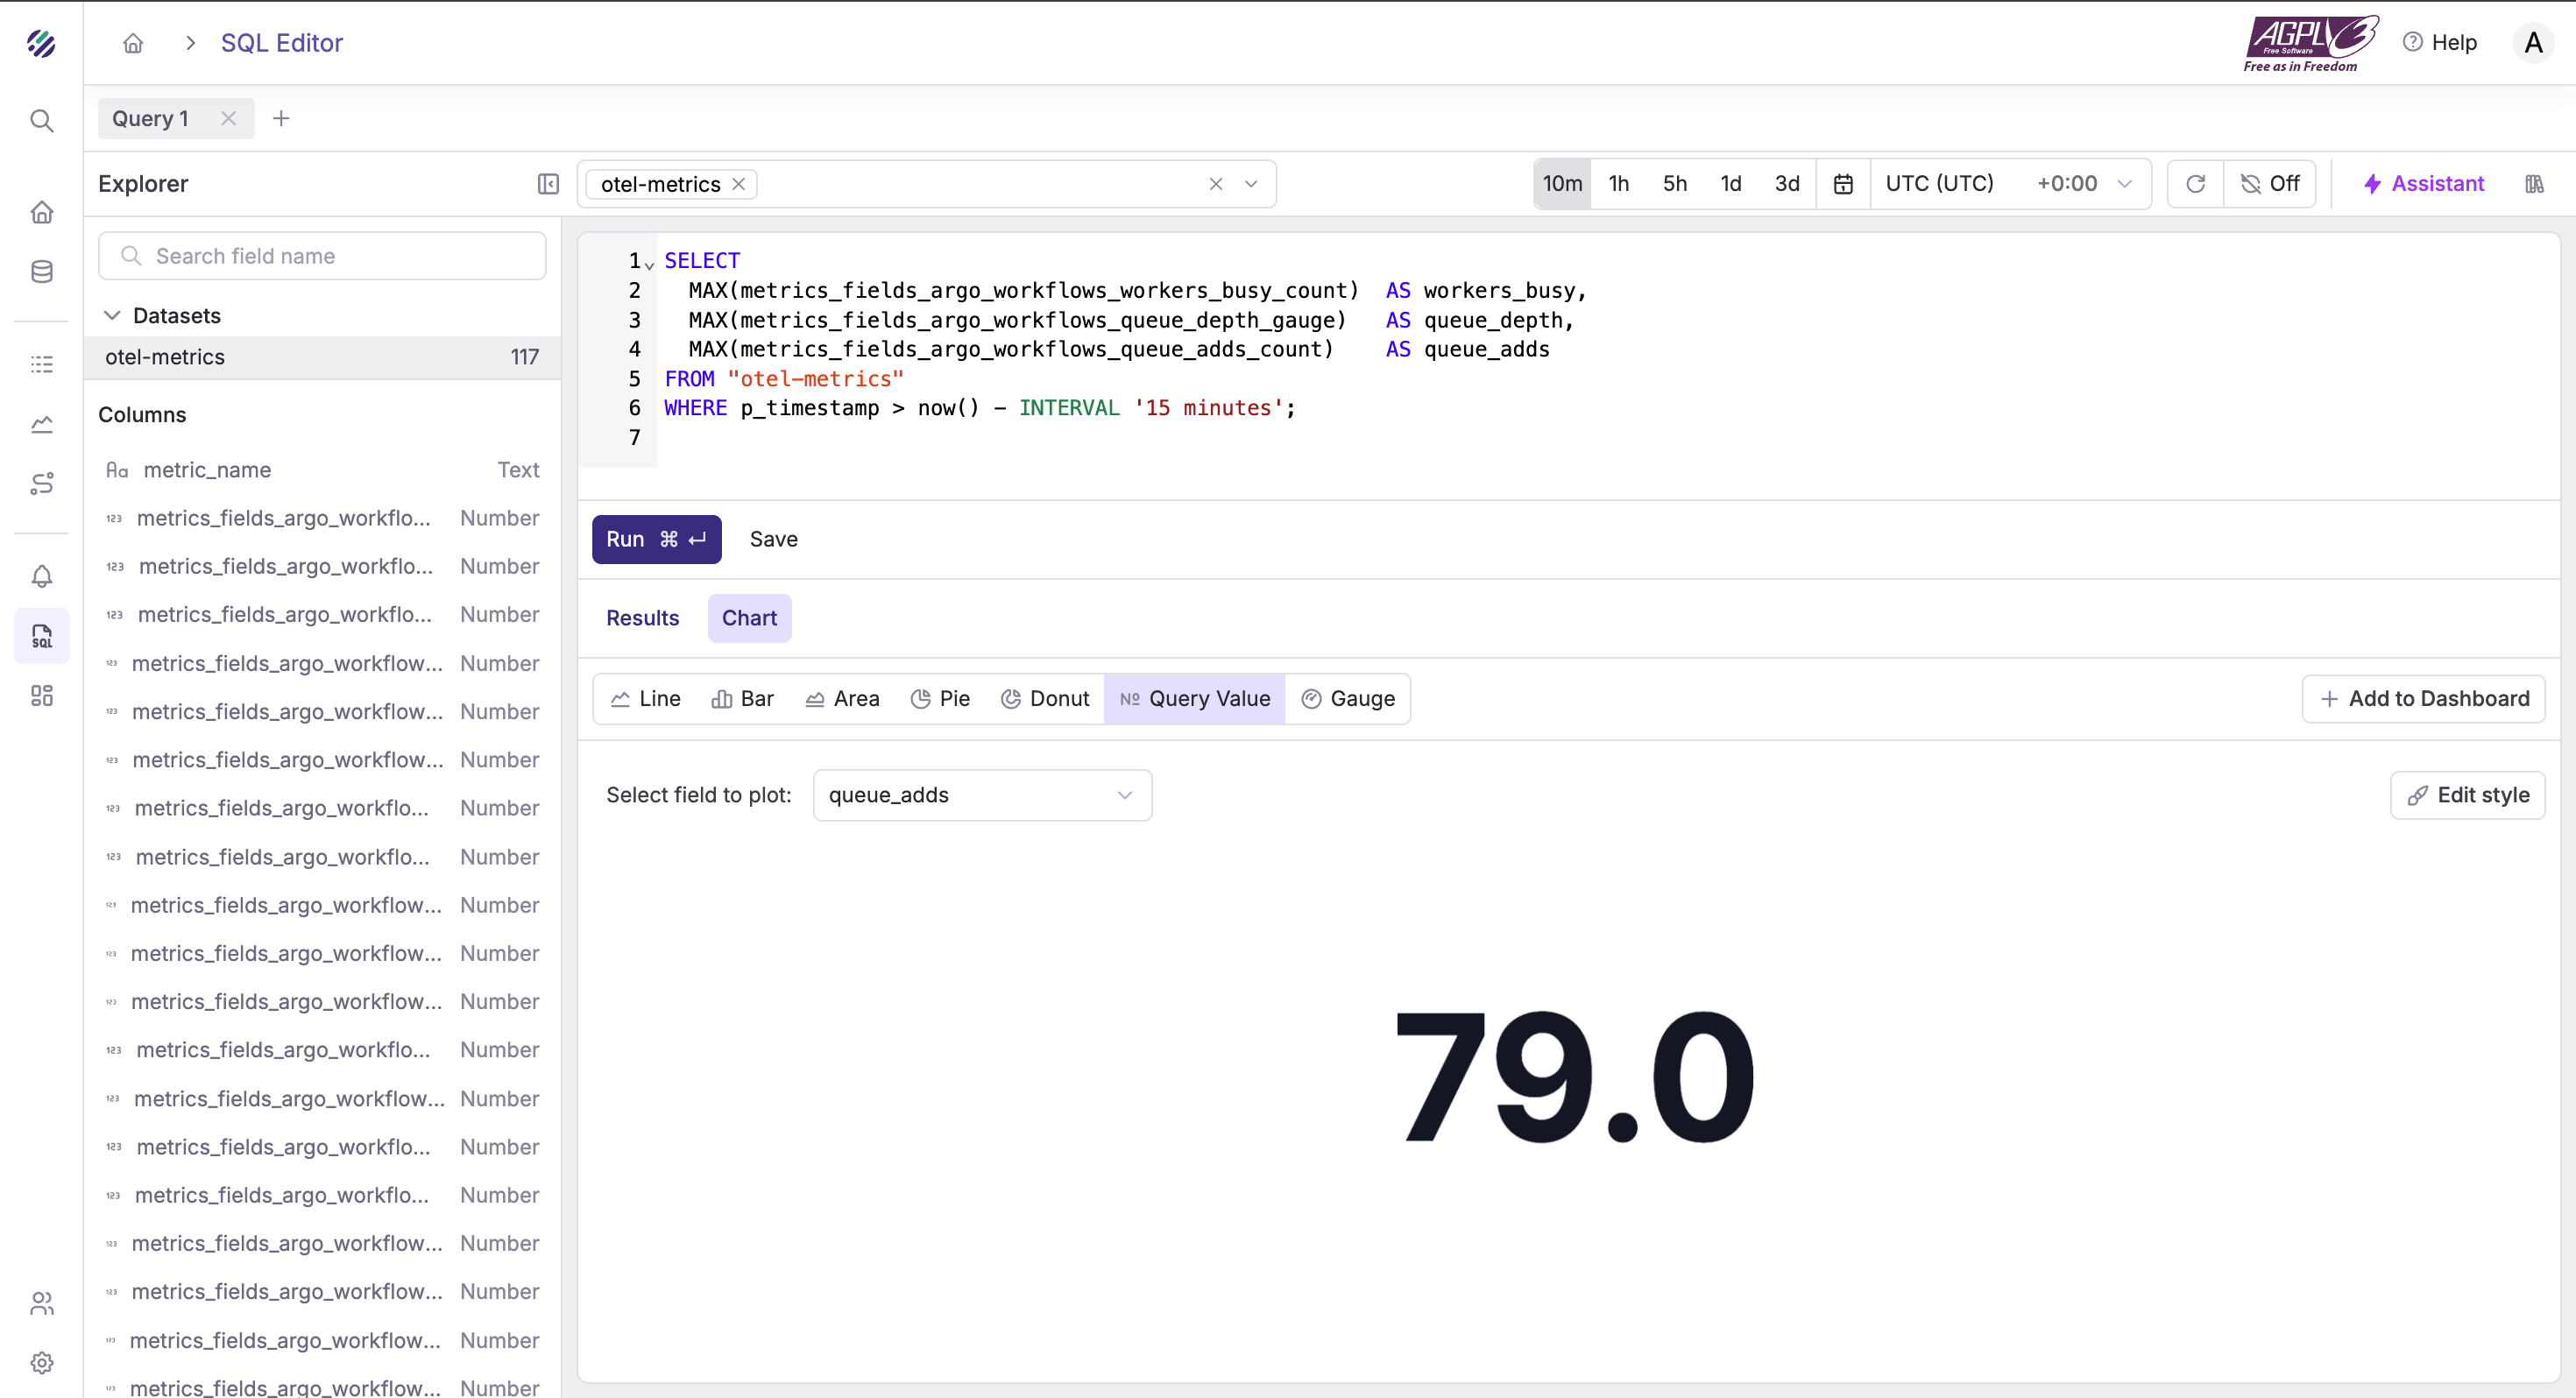
Dropped attributes — to check pipeline hygiene
SELECT
  MAX(resource_dropped_attributes_count) AS max_resource_drops
FROM "otel-metrics"
WHERE p_timestamp > now() - INTERVAL '30 minutes';
Pods status (pending / missing)
SELECT
  MAX(metrics_fields_argo_workflows_pod_pending_count) AS pending_pods,
  MAX(metrics_fields_argo_workflows_pod_missing)       AS missing_pods,
  MAX(metrics_fields_argo_workflows_pods_total_count)  AS total_pods
FROM "otel-metrics"
WHERE p_timestamp > now() - INTERVAL '10 minutes';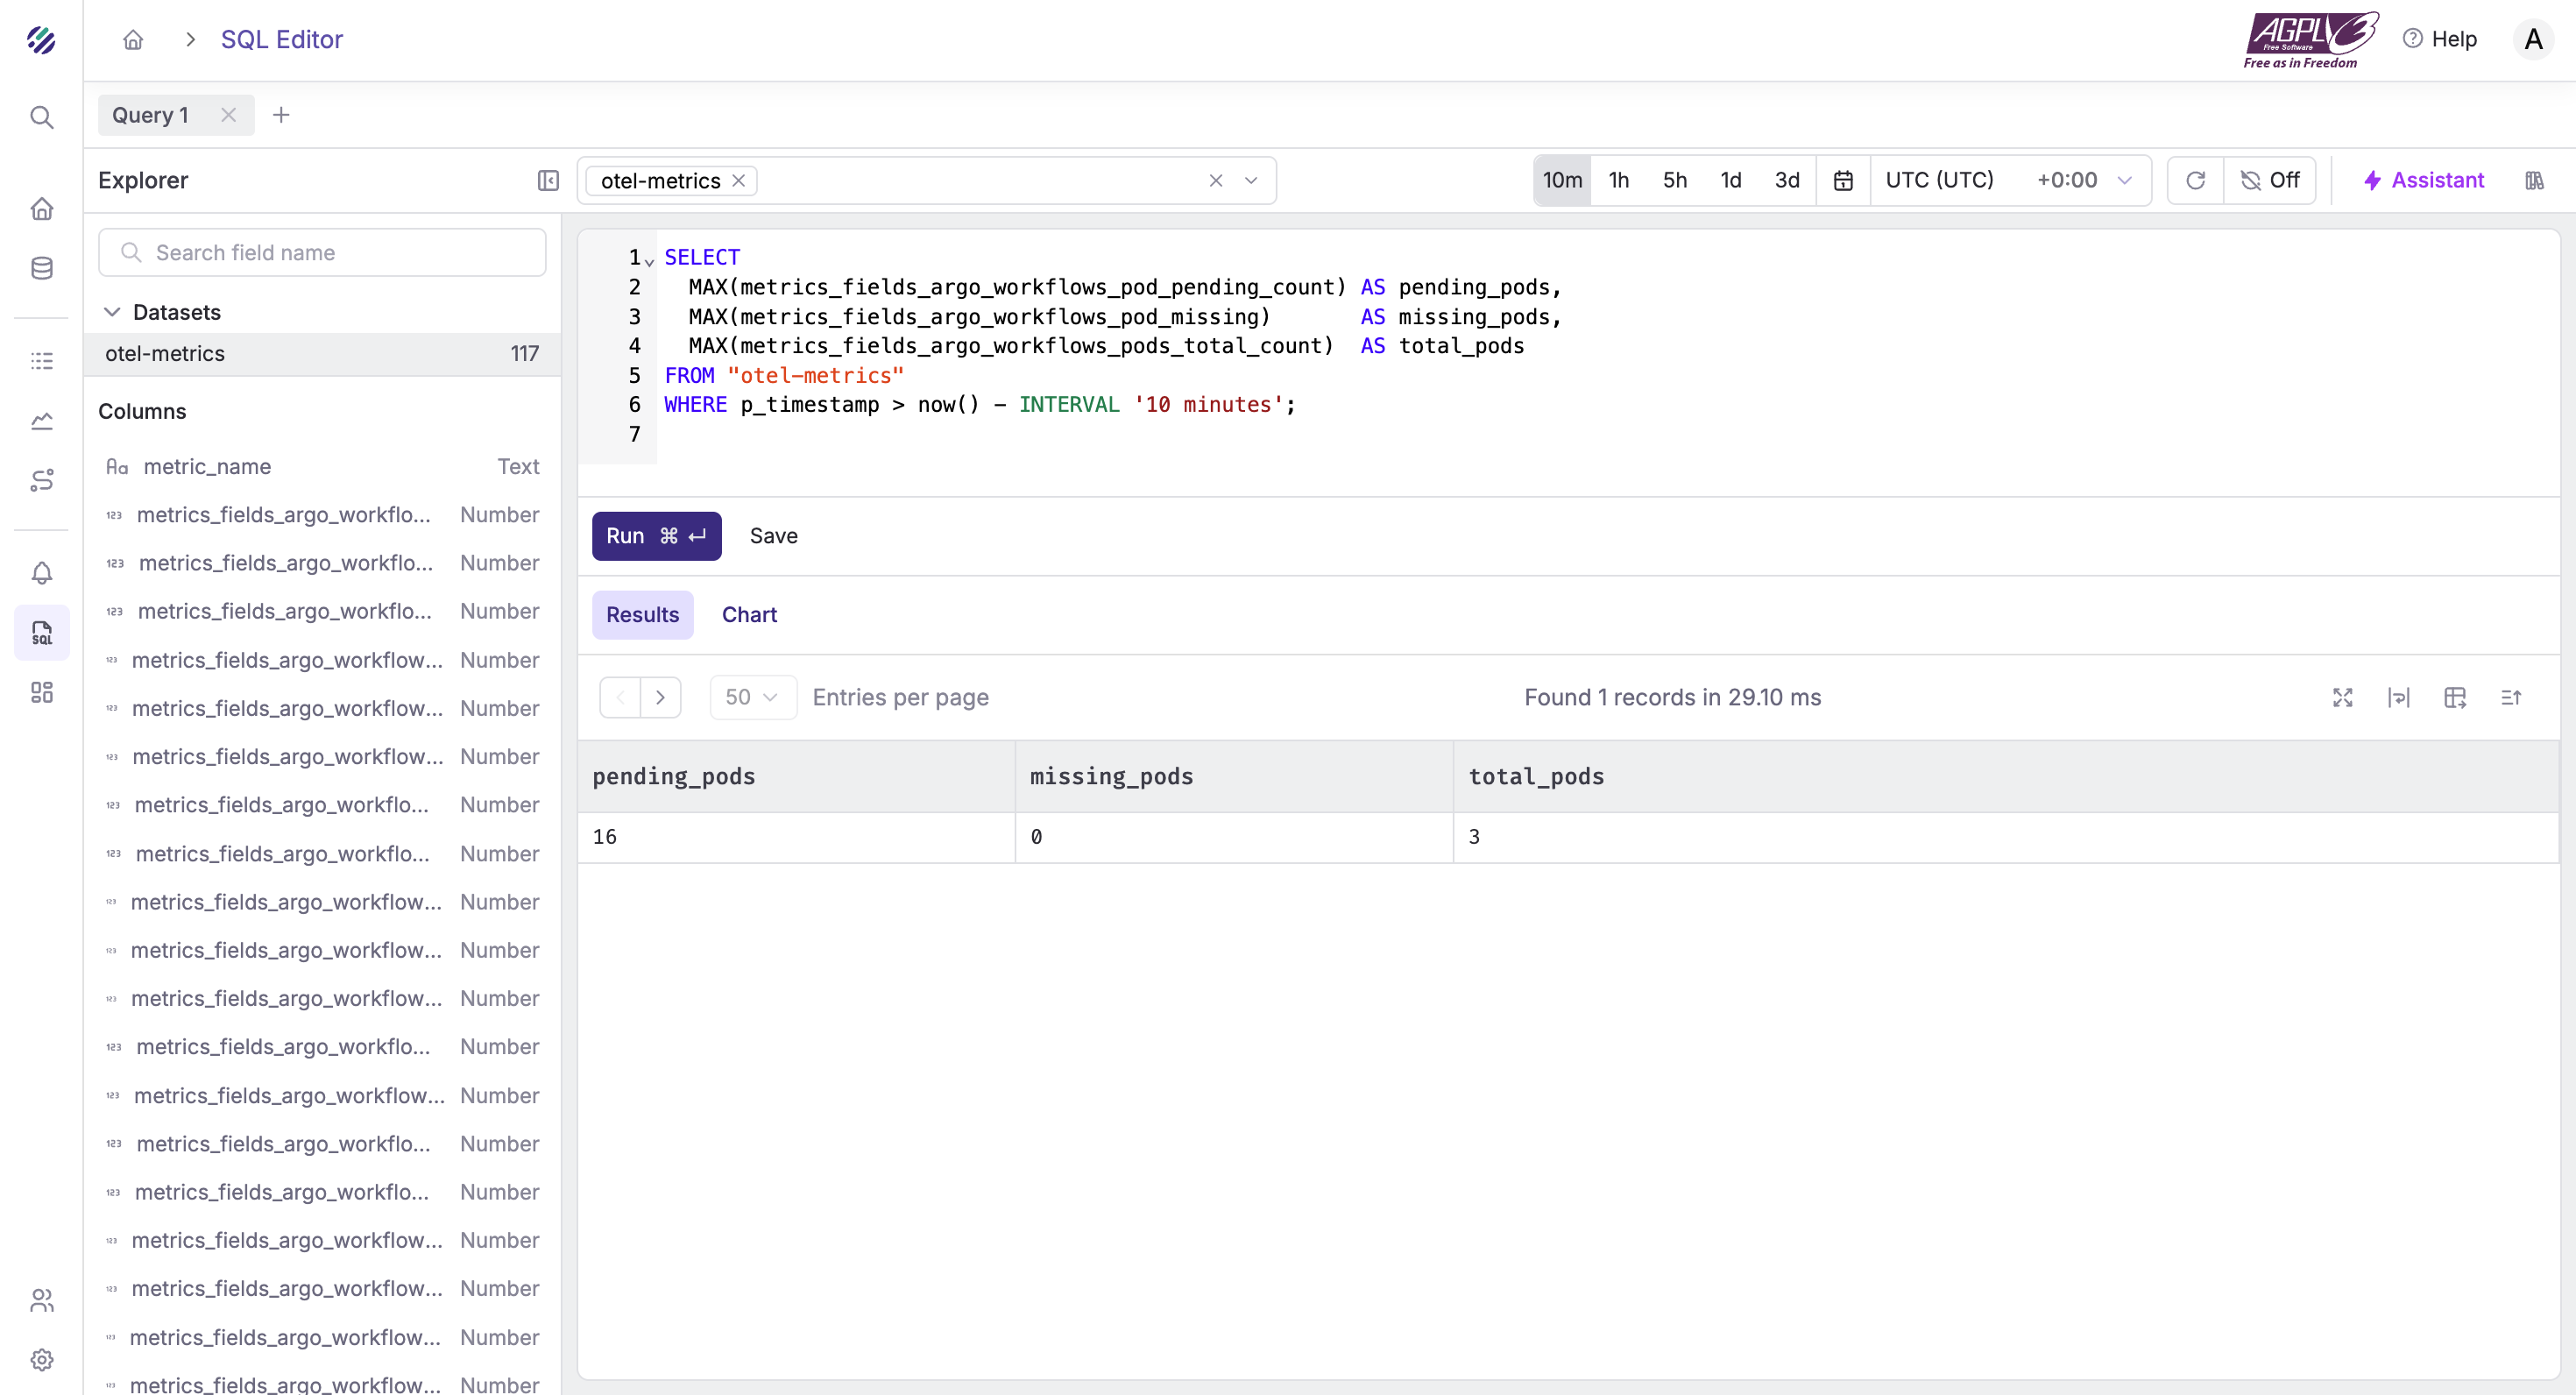
Argo controller runtime / Go health
SELECT
  MAX(metrics_fields_argo_workflows_process_runtime_go_goroutines)   AS goroutines,
  MAX(metrics_fields_argo_workflows_process_runtime_go_mem_heap_alloc) AS heap_alloc,
  MAX(metrics_fields_process_resident_memory_bytes)                  AS rss
FROM "otel-metrics"
WHERE p_timestamp > now() - INTERVAL '10 minutes';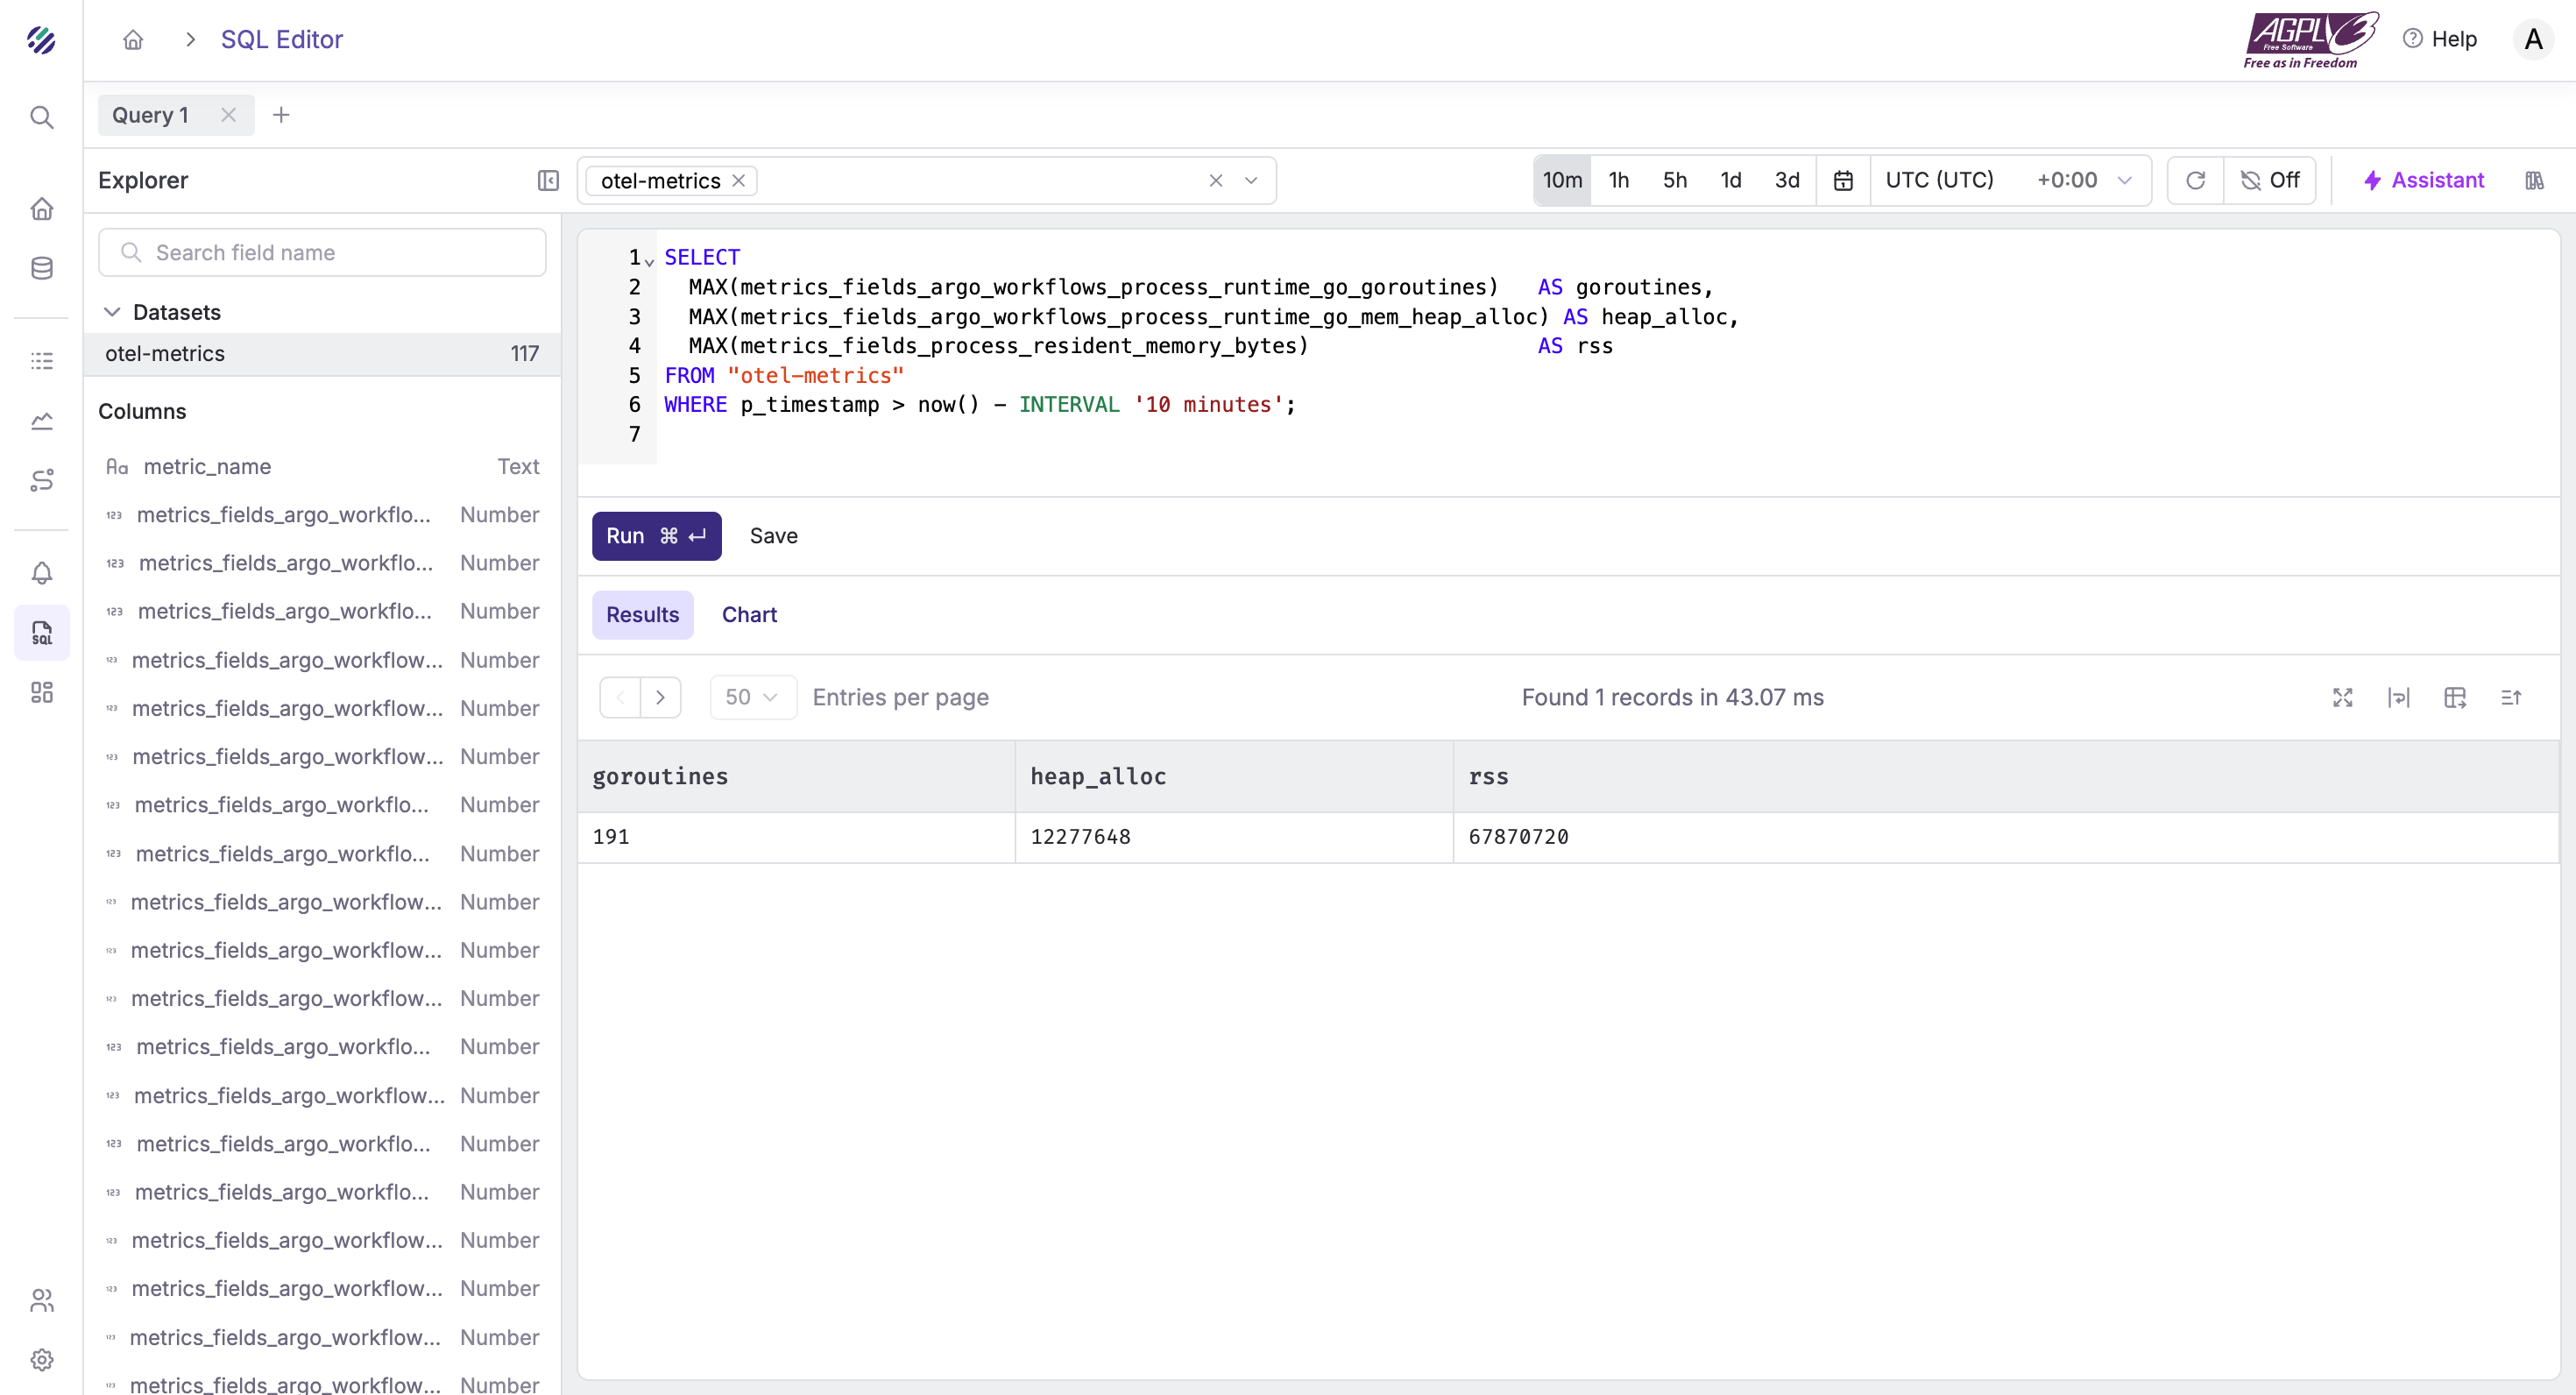
Conclusion
Argo CD already exposes the signals you need. Parseable pulls them into one place, so you can see deployment frequency, spot failures fast, and measure how quickly you recover. Start with metrics and events. Add a handful of focused charts. Wire two or three alerts that actually help.

