

Introduction
In our previous blog post we set-up the OpenTelemetry Demo application and sent all telemetry data to Parseable for unified observability. In this blog post we will demonstrate how to set up Fluent Bit with the OpenTelemetry Demo application and send all telemetry data to Parseable for unified observability.
Fluent Bit is a lightweight, high-performance log processor and forwarder that's perfect for cloud-native environments. As part of the Cloud Native Computing Foundation (CNCF), Fluent Bit excels at collecting, processing, and routing logs, metrics, and traces from various sources to multiple destinations.
Why Fluent Bit + Parseable?
This combination delivers exceptional value for modern observability:
Universal Data Collection
Fluent Bit can collect data from virtually any source; container logs, system metrics, application traces, and custom telemetry. It supports OpenTelemetry protocols (gRPC and HTTP) out of the box.
Stream Processing
With built-in filtering, parsing, and enrichment capabilities, Fluent Bit can process and transform your telemetry data in real-time before sending it to Parseable.
Zero‑Stack Architecture with Parseable
Parseable treats your object store as the source of truth, eliminating the need for complex infrastructure. Combined with Fluent Bit's efficiency, you get a complete observability solution with minimal operational overhead.
SQL‑First Analytics
Once your Fluent Bit data reaches Parseable, you can query everything using familiar SQL syntax - no need to learn proprietary query languages.
By the end of this tutorial, you'll have a complete observability pipeline using Fluent Bit for data collection and Parseable for storage and analysis.
Pre-Requisites
We'll use Docker Compose to run the OpenTelemetry Demo with Fluent Bit and Parseable. Ensure you have:
- Docker
- Docker Compose v2.0.0+
- System Requirements:
- Linux/macOS/Windows
- 4 GB of RAM for the application (Fluent Bit requires less memory than OTel Collector)
- 2 GB of free disk space
Read More on detailed requirements.
Get and run the demo
Step-1: Clone the Demo repository:
git clone https://github.com/parseablehq/opentelemetry-demo/tree/mainStep-2: Change to the demo folder:
cd opentelemetry-demo/Step-3: Update environment configuration
Update the .env file to point services to Fluent Bit:
echo "OTEL_COLLECTOR_HOST=fluent-bit" >> .envStep-4: Start the demo with Fluent Bit
Instead of using the default OpenTelemetry Collector, we'll use the Fluent Bit configuration:
docker-compose -f docker-compose-fluent-bit.yml up --force-recreate --remove-orphans --detachFluent Bit will collect OpenTelemetry data on ports 4317 (gRPC) and 4318 (HTTP) and forward it to Parseable with proper stream separation (logs, metrics, traces).
Verify the web store and Telemetry
Once the images are built and containers are started you can access:
- Demo Application: http://localhost:8080/
- Parseable Observability Platform: http://localhost:8000/
Understanding the Fluent Bit Configuration
The Fluent Bit setup includes several key components:
Input Configuration
- HTTP: Receives telemetry on port 4318
- Container Logs: Collects logs from all demo application containers
Processing Pipeline
- Parsing: Automatically detects and parses JSON logs
- Enrichment: Adds metadata like container names, labels, and timestamps
- Filtering: Routes different telemetry types to appropriate streams
Output Configuration
- Logs Stream: Routes to
otellogsstream in Parseable - Metrics Stream: Routes to
otelmetricsstream in Parseable - Traces Stream: Routes to
oteltracesstream in Parseable
Exploring Telemetry data in Parseable
When the demo is running, the built-in load generator simulates traffic. After a few seconds, you'll see data flowing through Fluent Bit into Parseable.
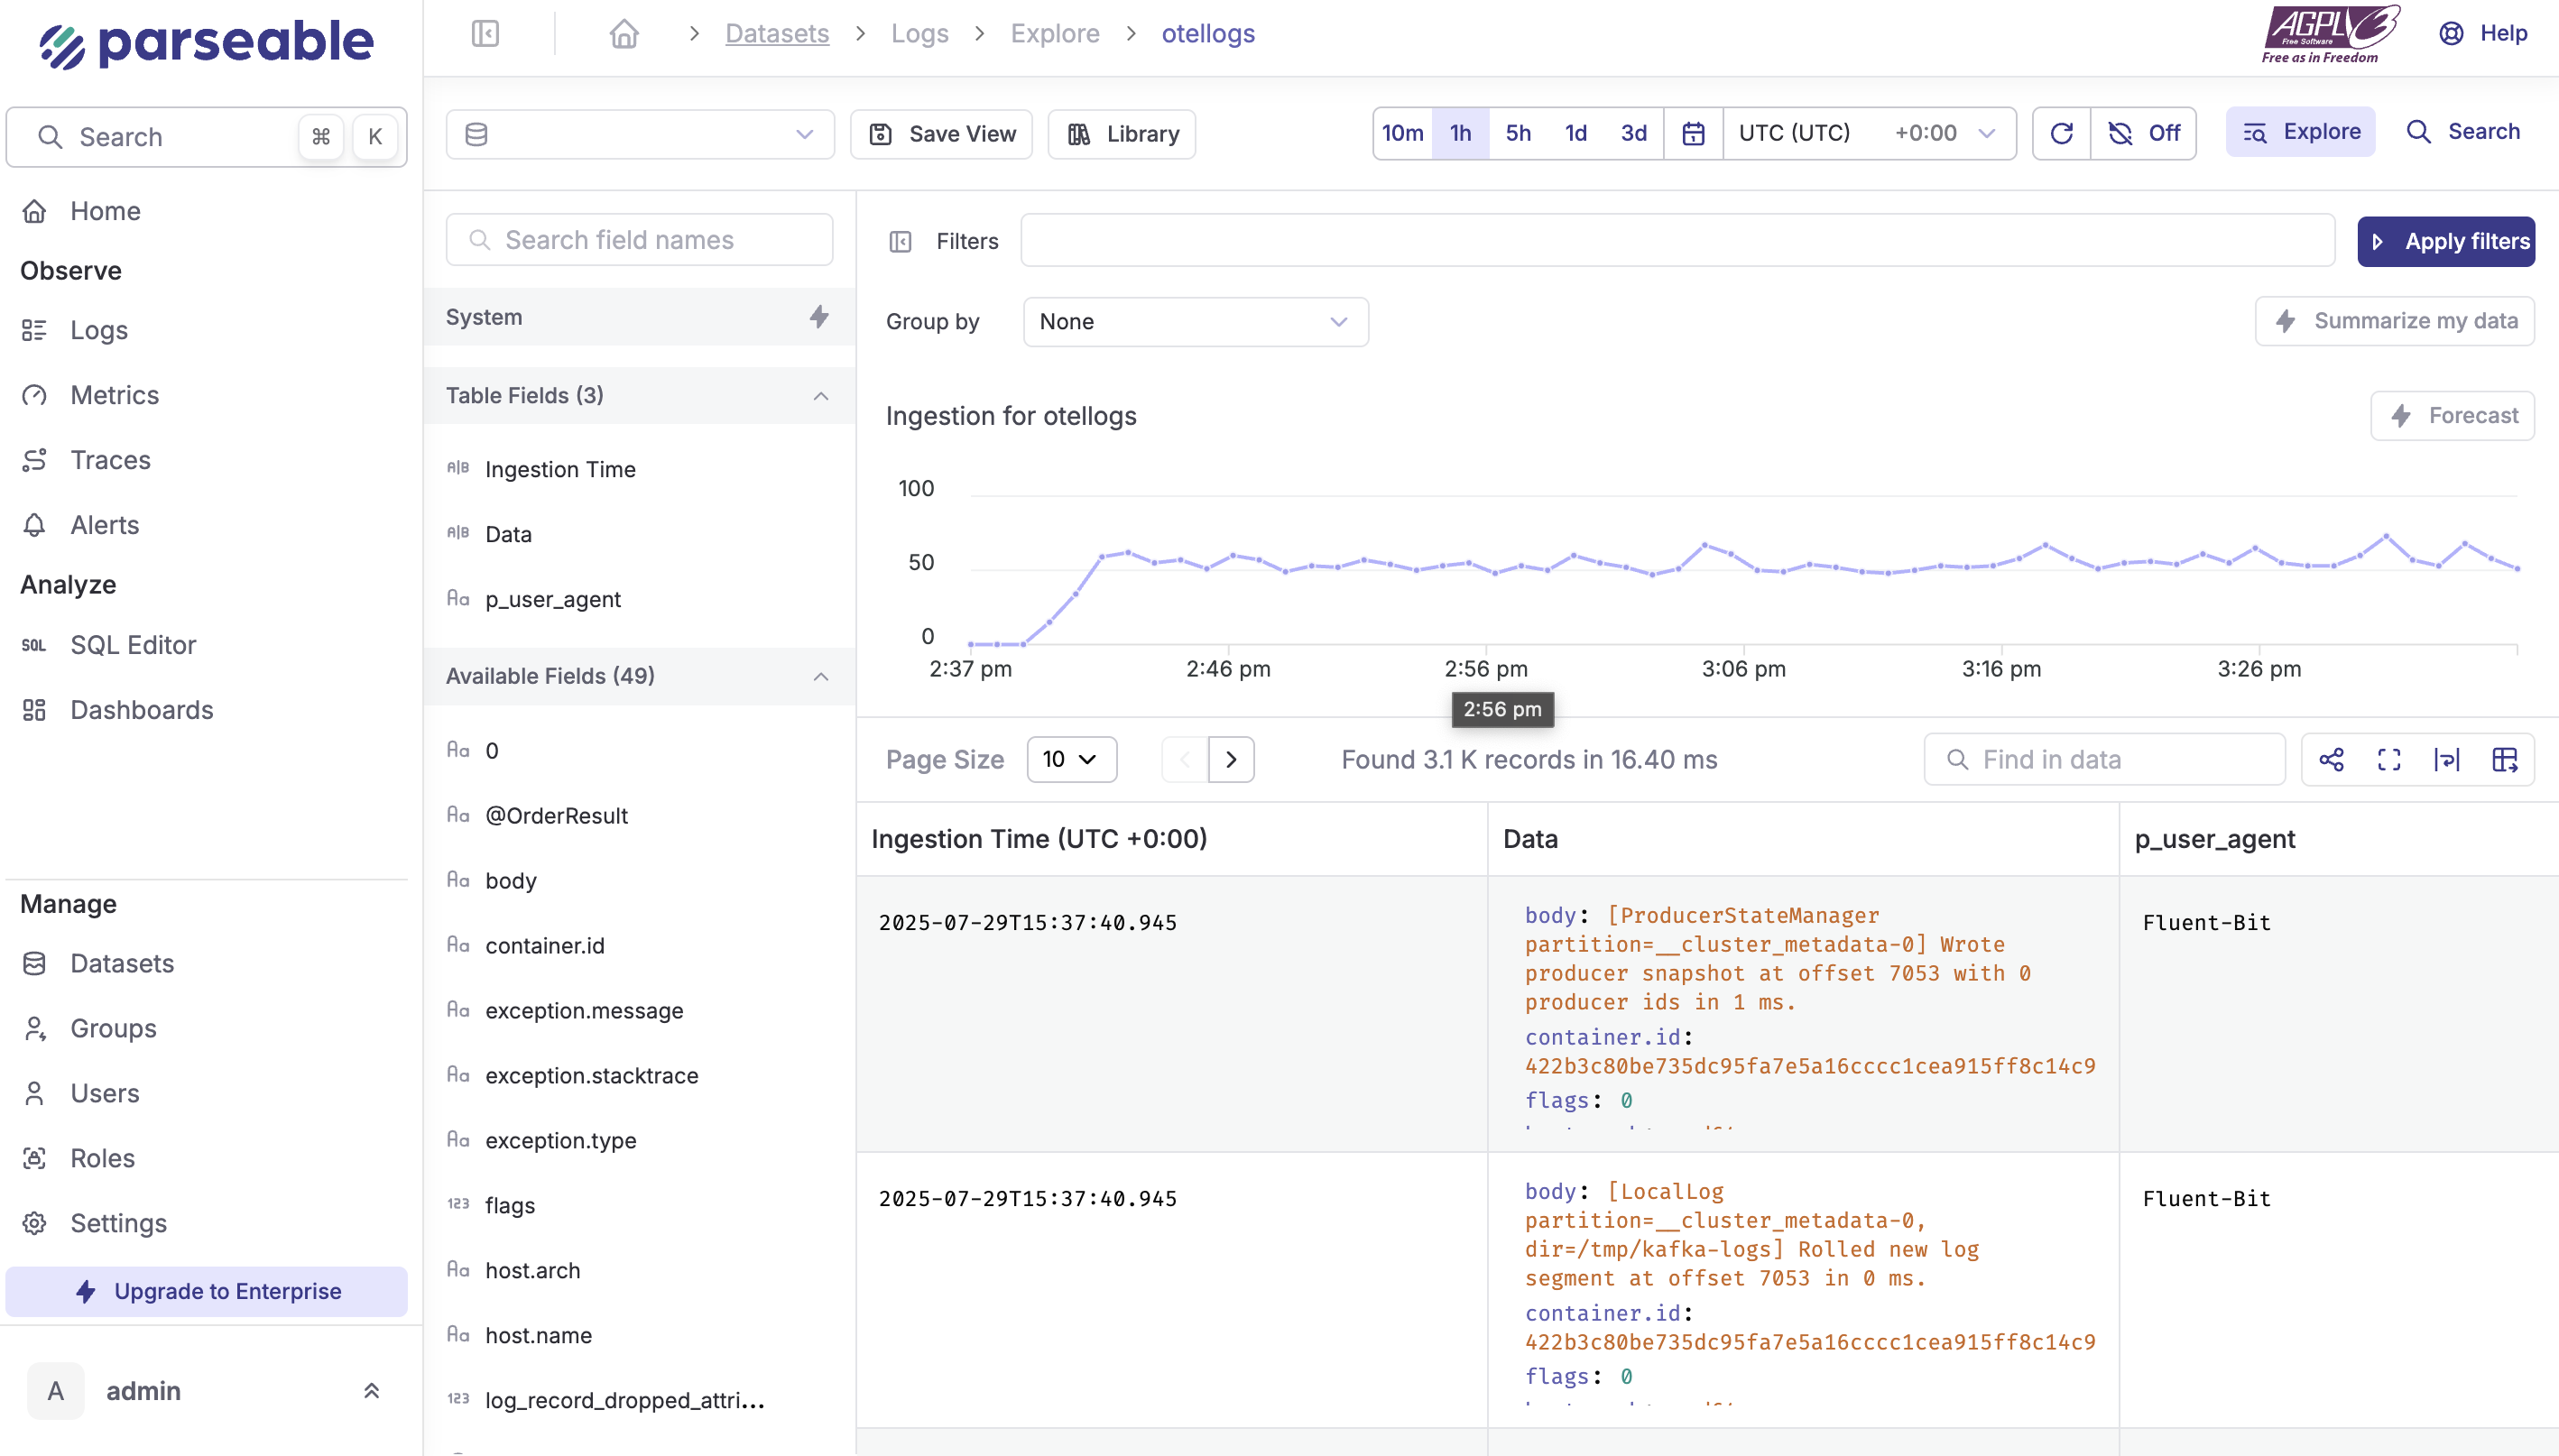
Log Explorer
Navigate to the Logs tab in the sidebar for an intuitive view of your logs, including ingestion trends and detailed log messages.
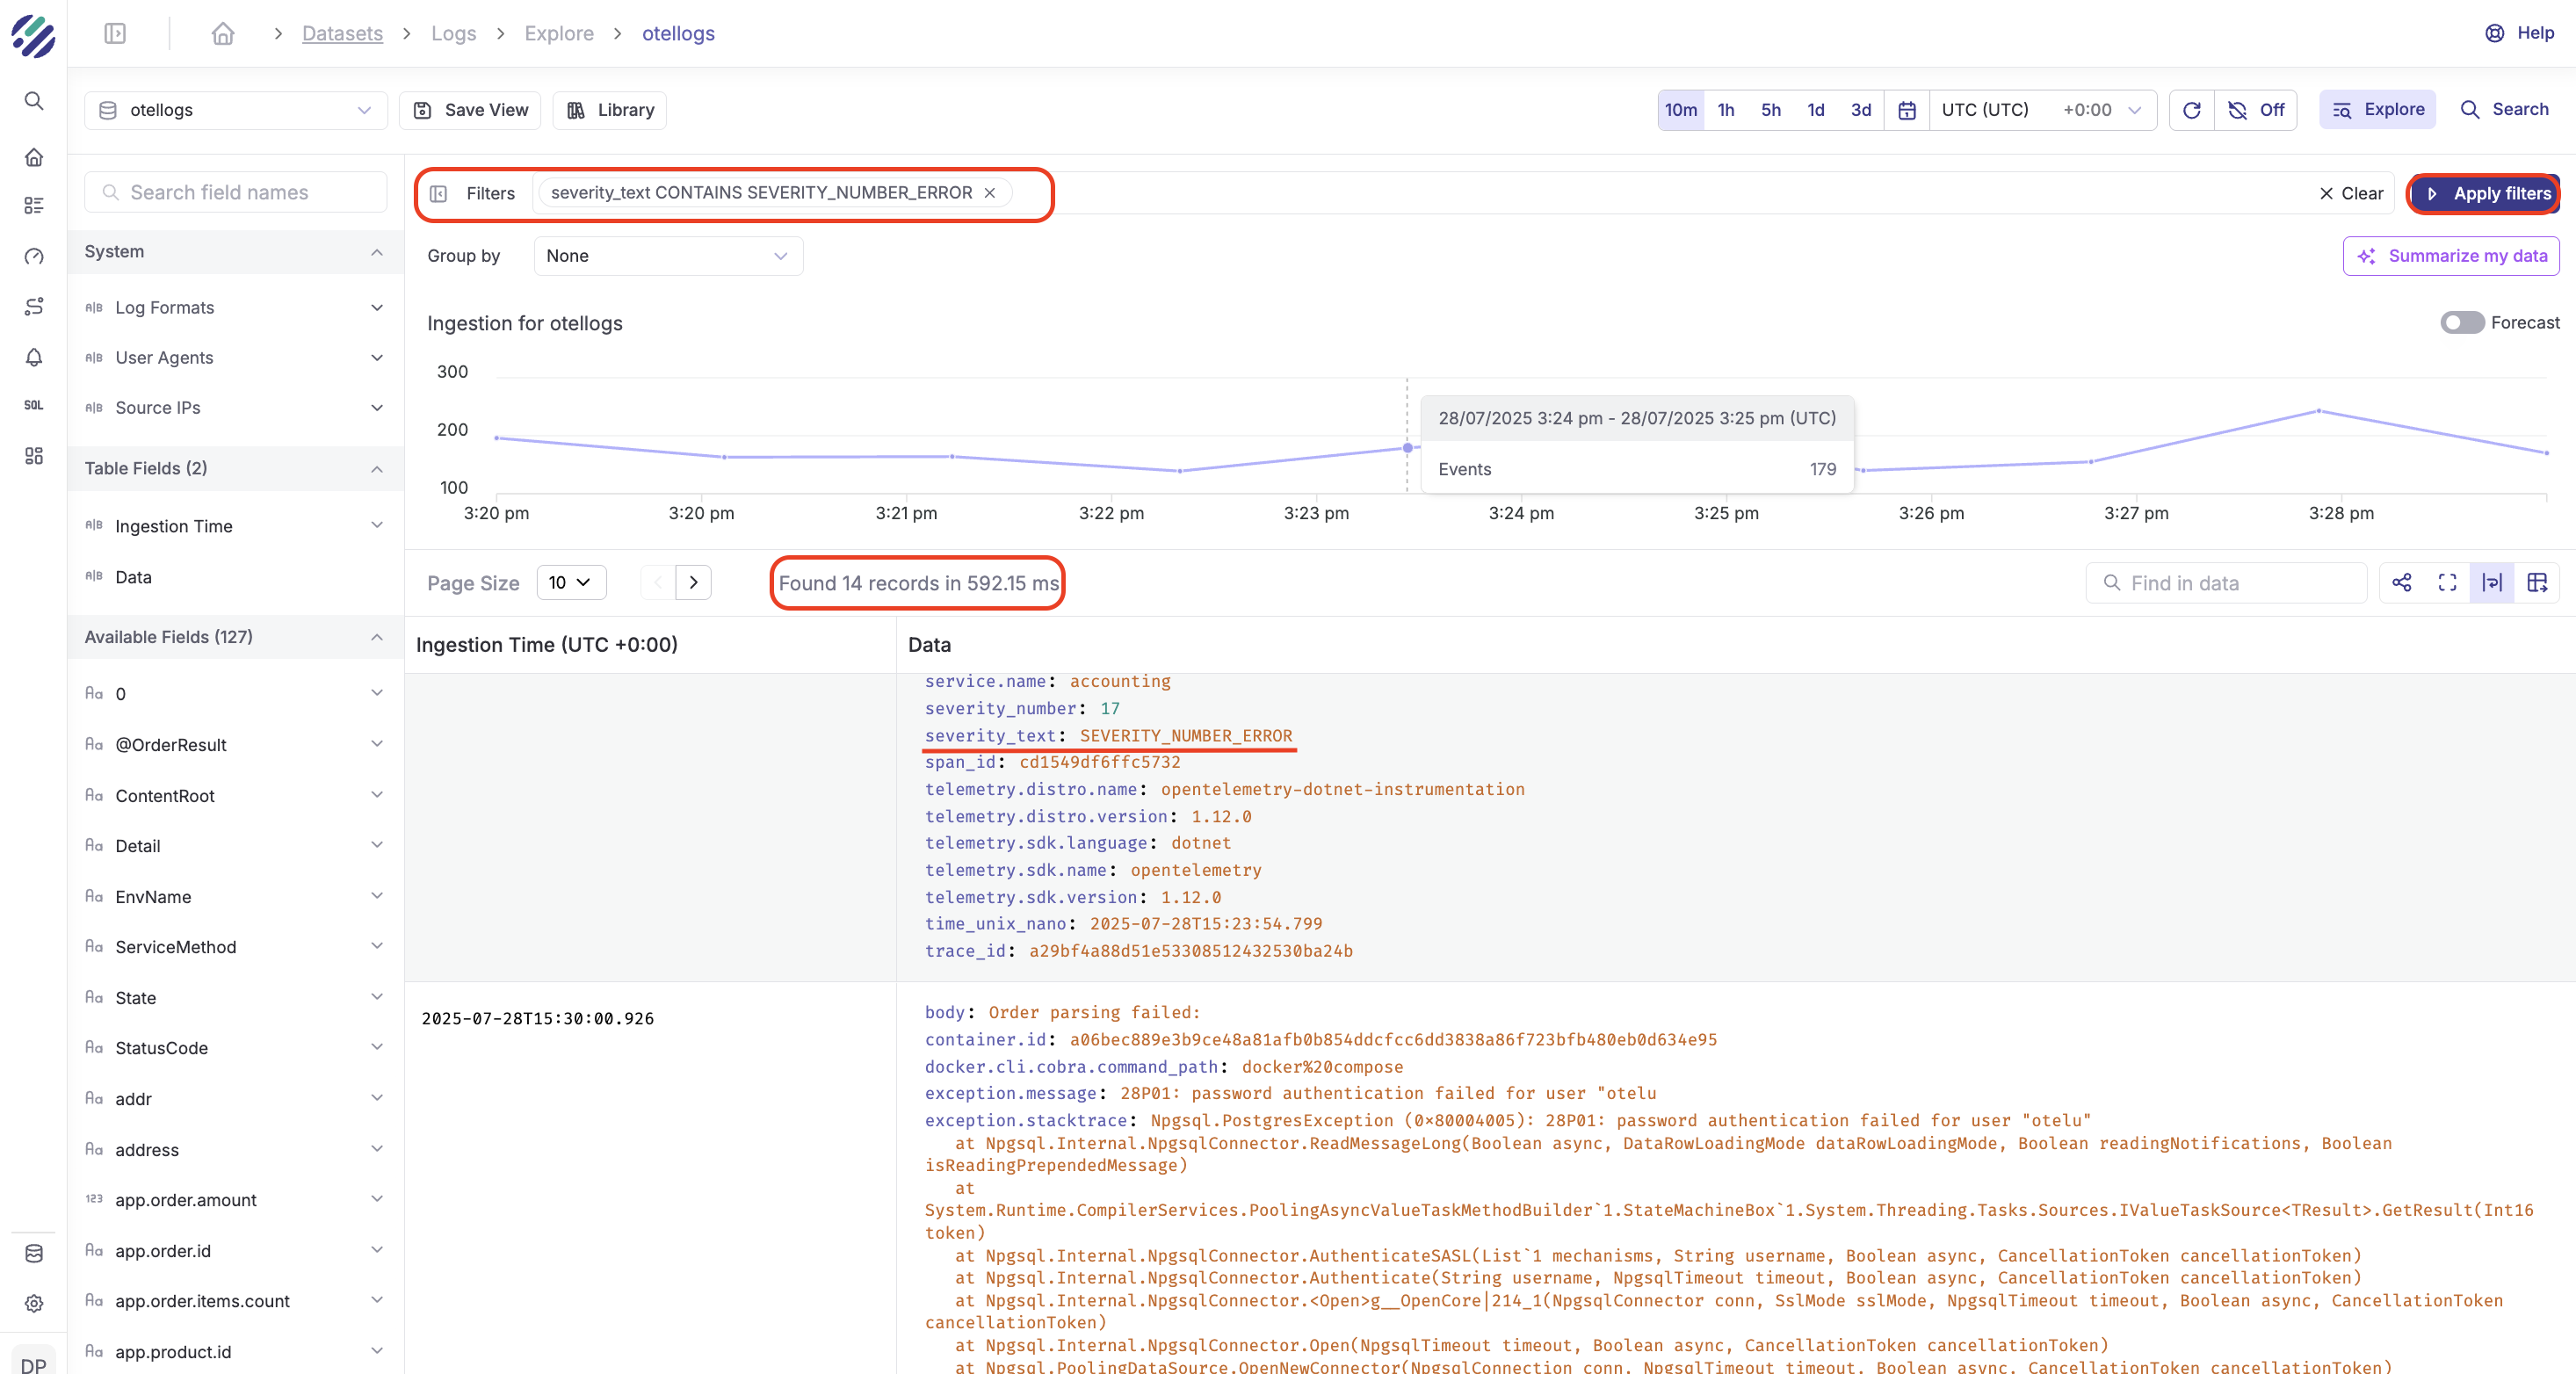
Apply Filters
Apply filters to search for specific log messages. For example, search for log messages with severity_text CONTAINS ERROR and group by service.name.
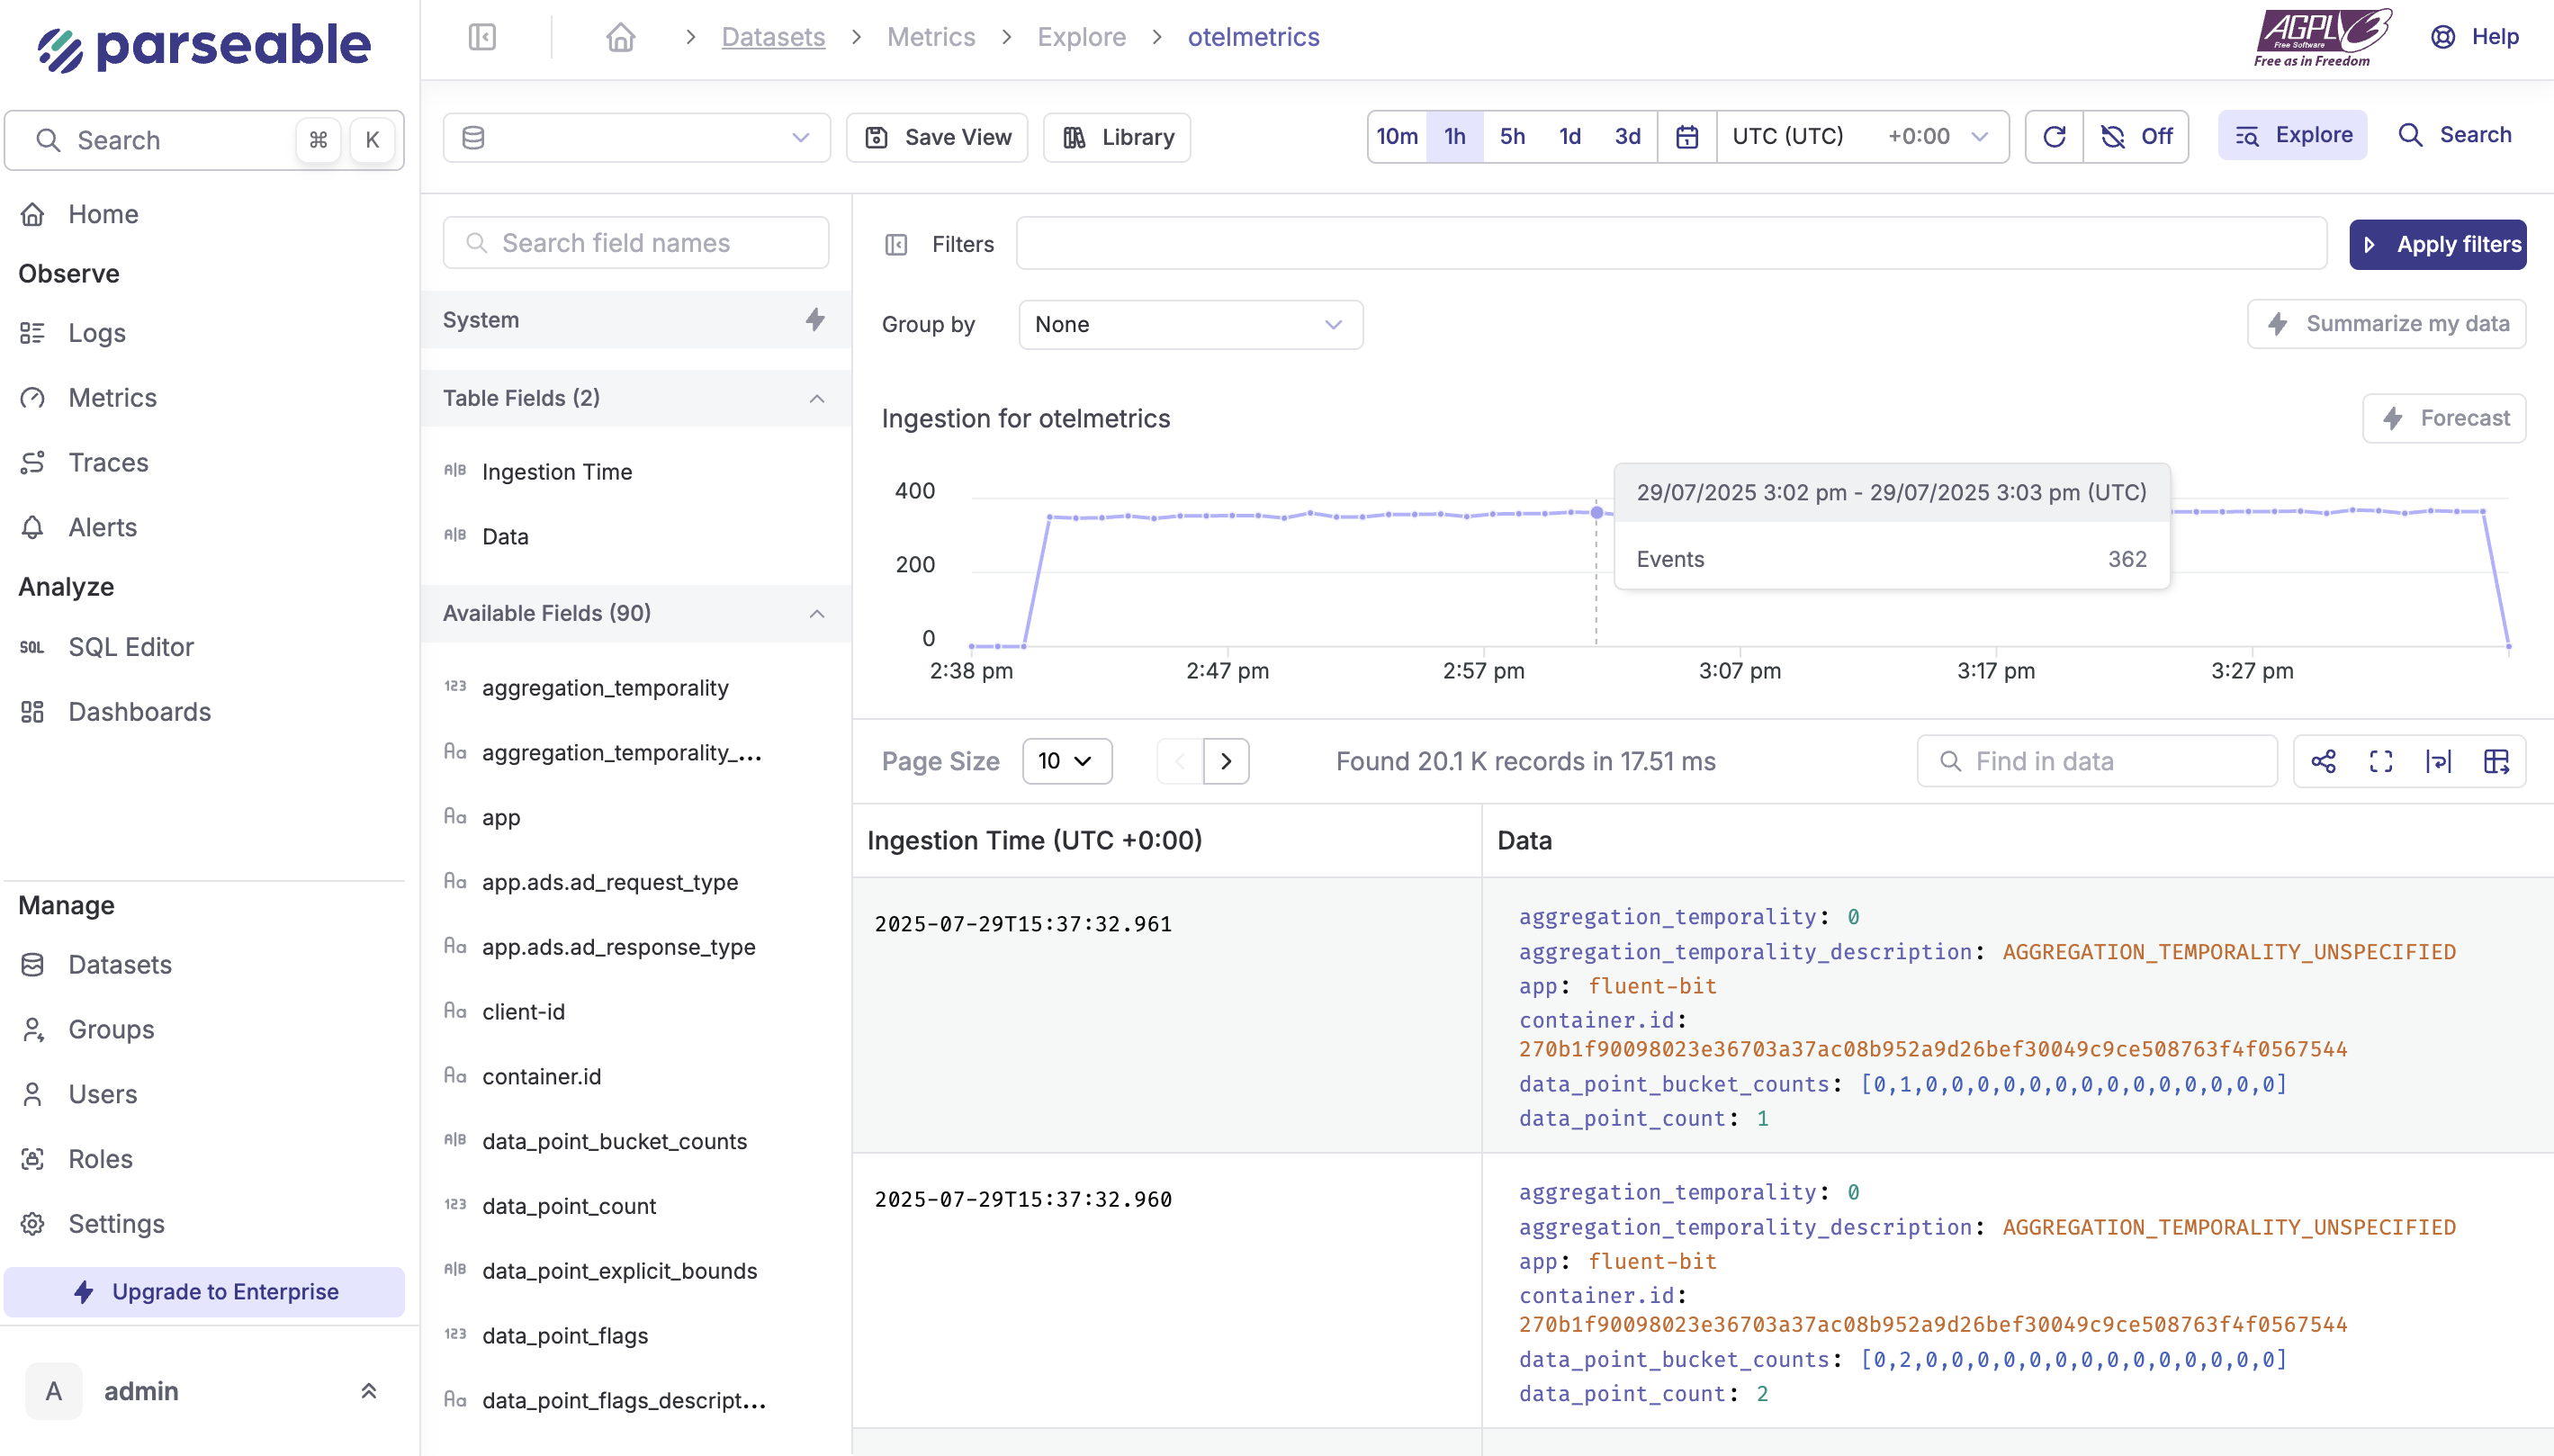
Metrics
Navigate to the Metrics tab for detailed metrics analysis. Use filters like container.name IS NOT NULL and group by container.id.
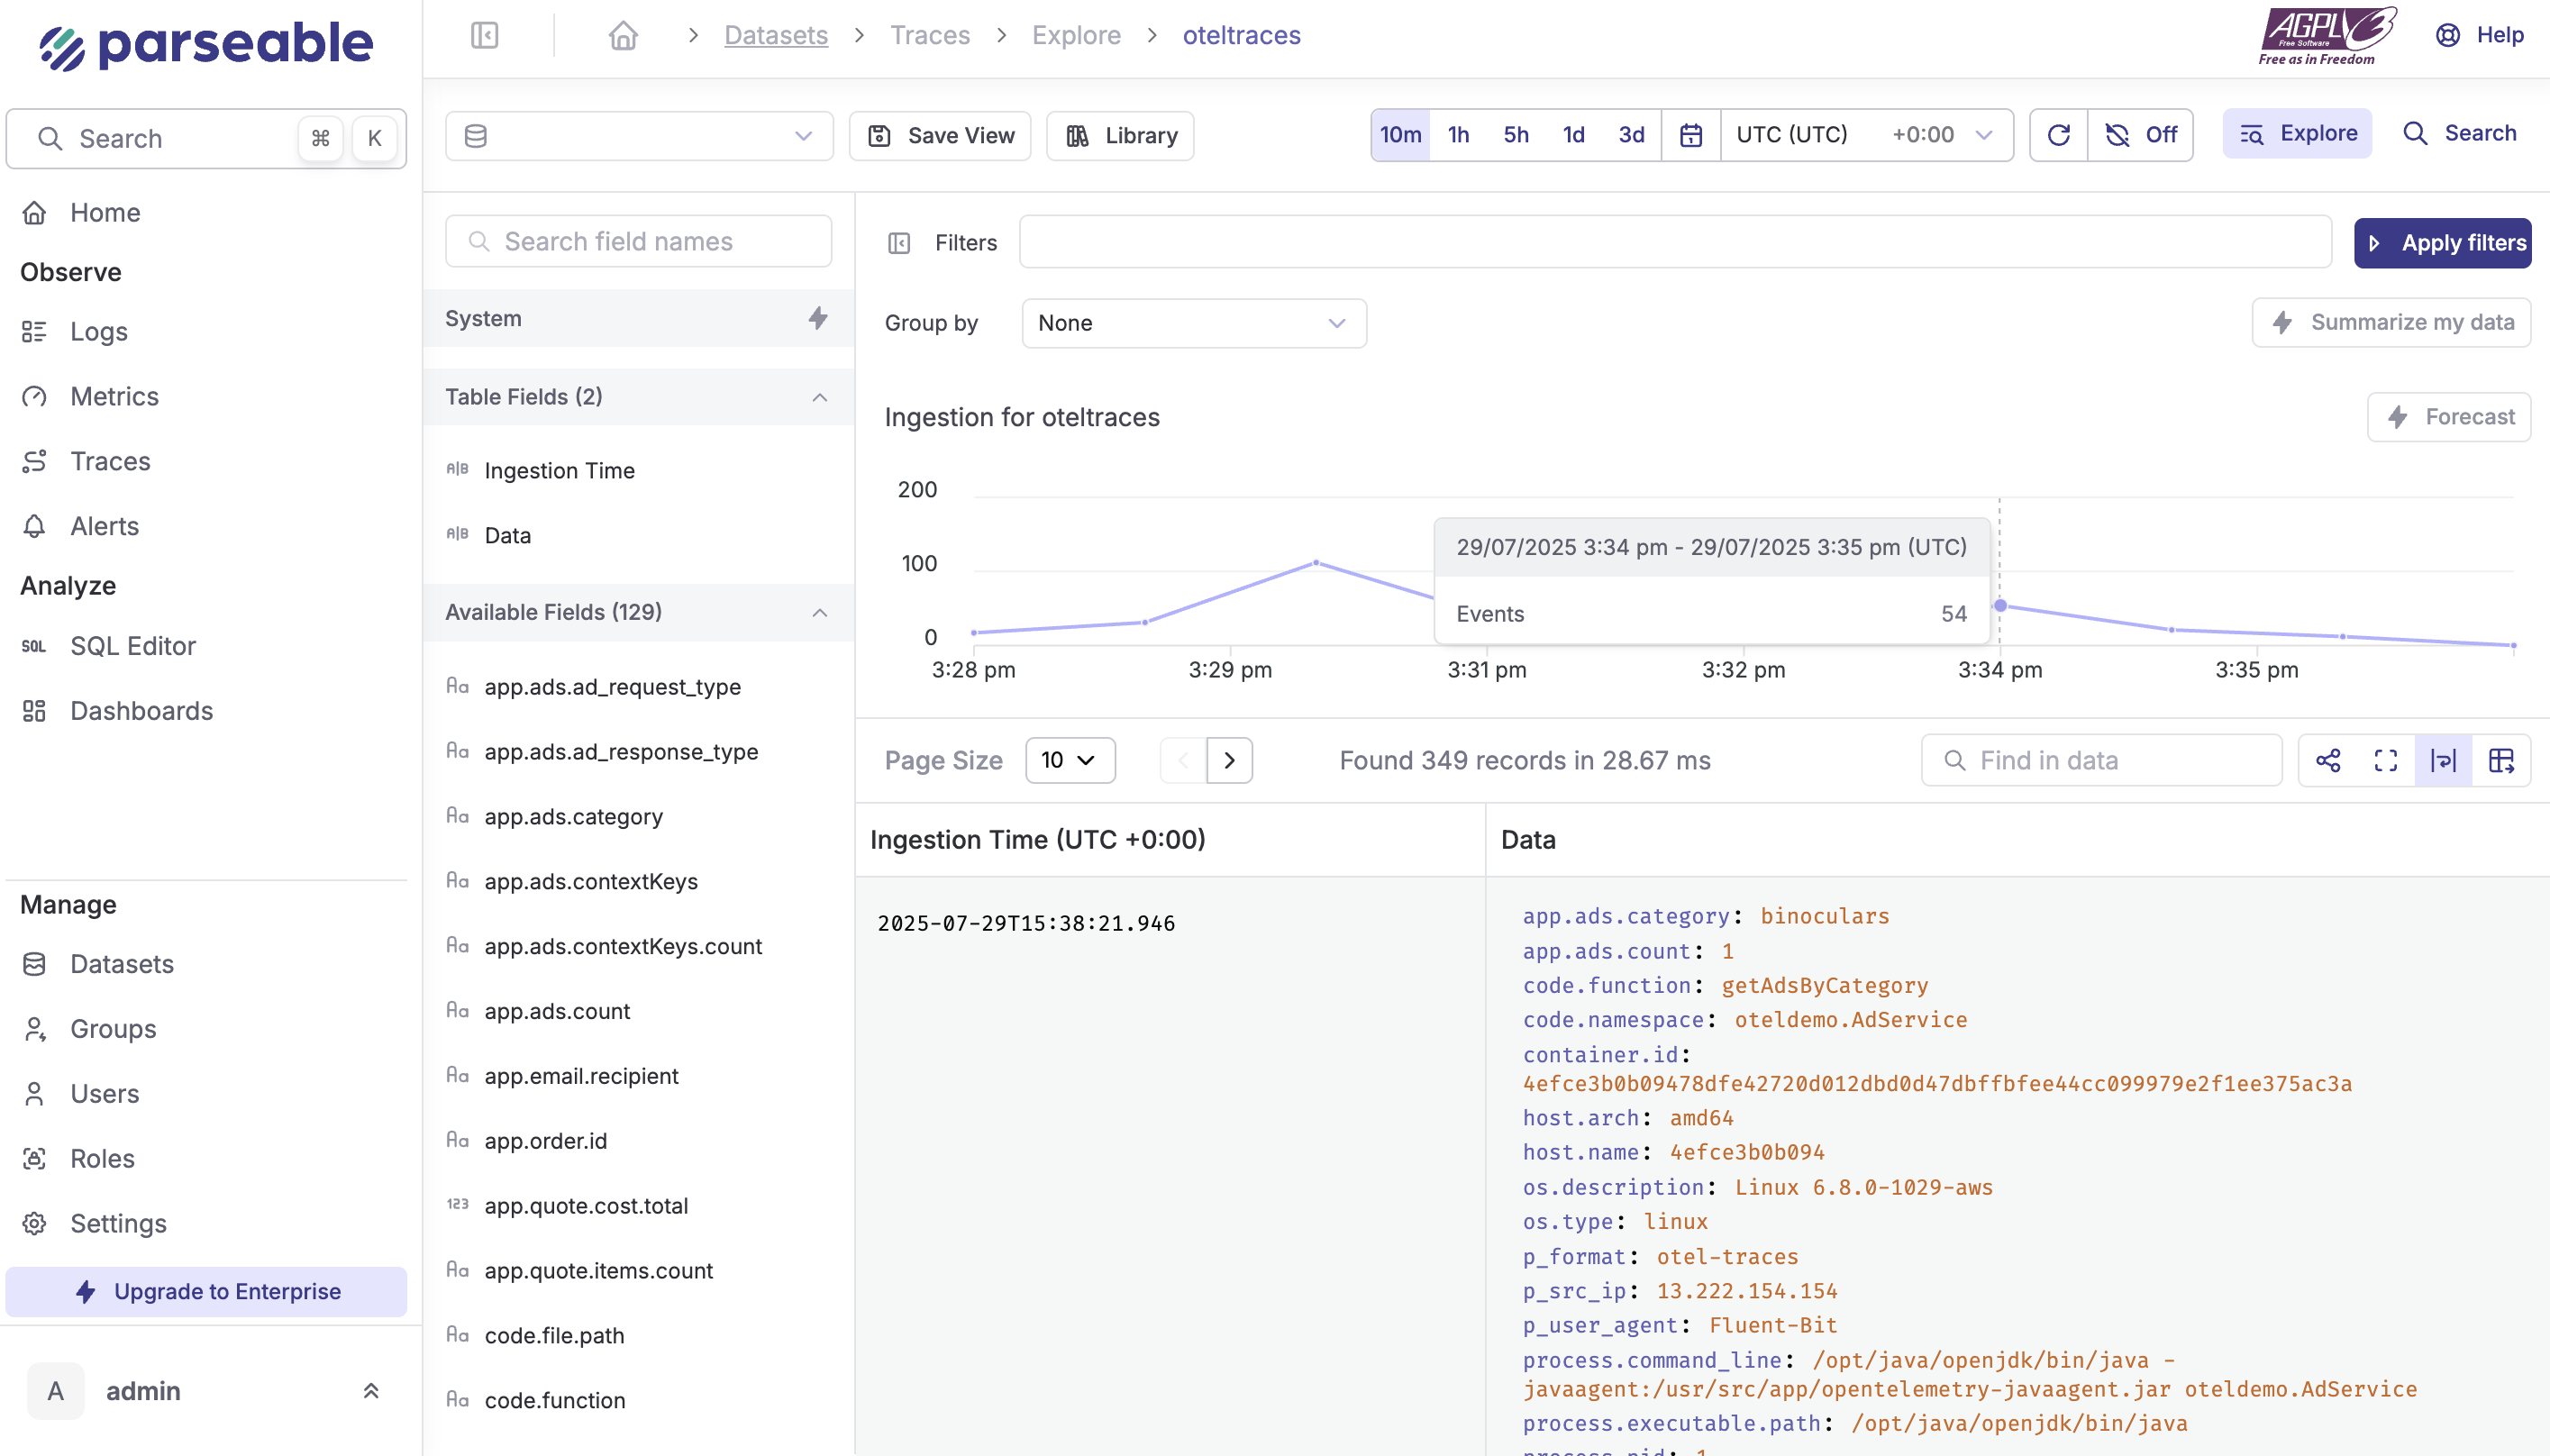
Traces
Navigate to the Traces tab for distributed tracing analysis. Apply filters to search for specific traces, such as service.name=frontend-proxy grouped by http.status_code.
SQL Editor
Leverage Parseable's SQL editor for advanced analytics:
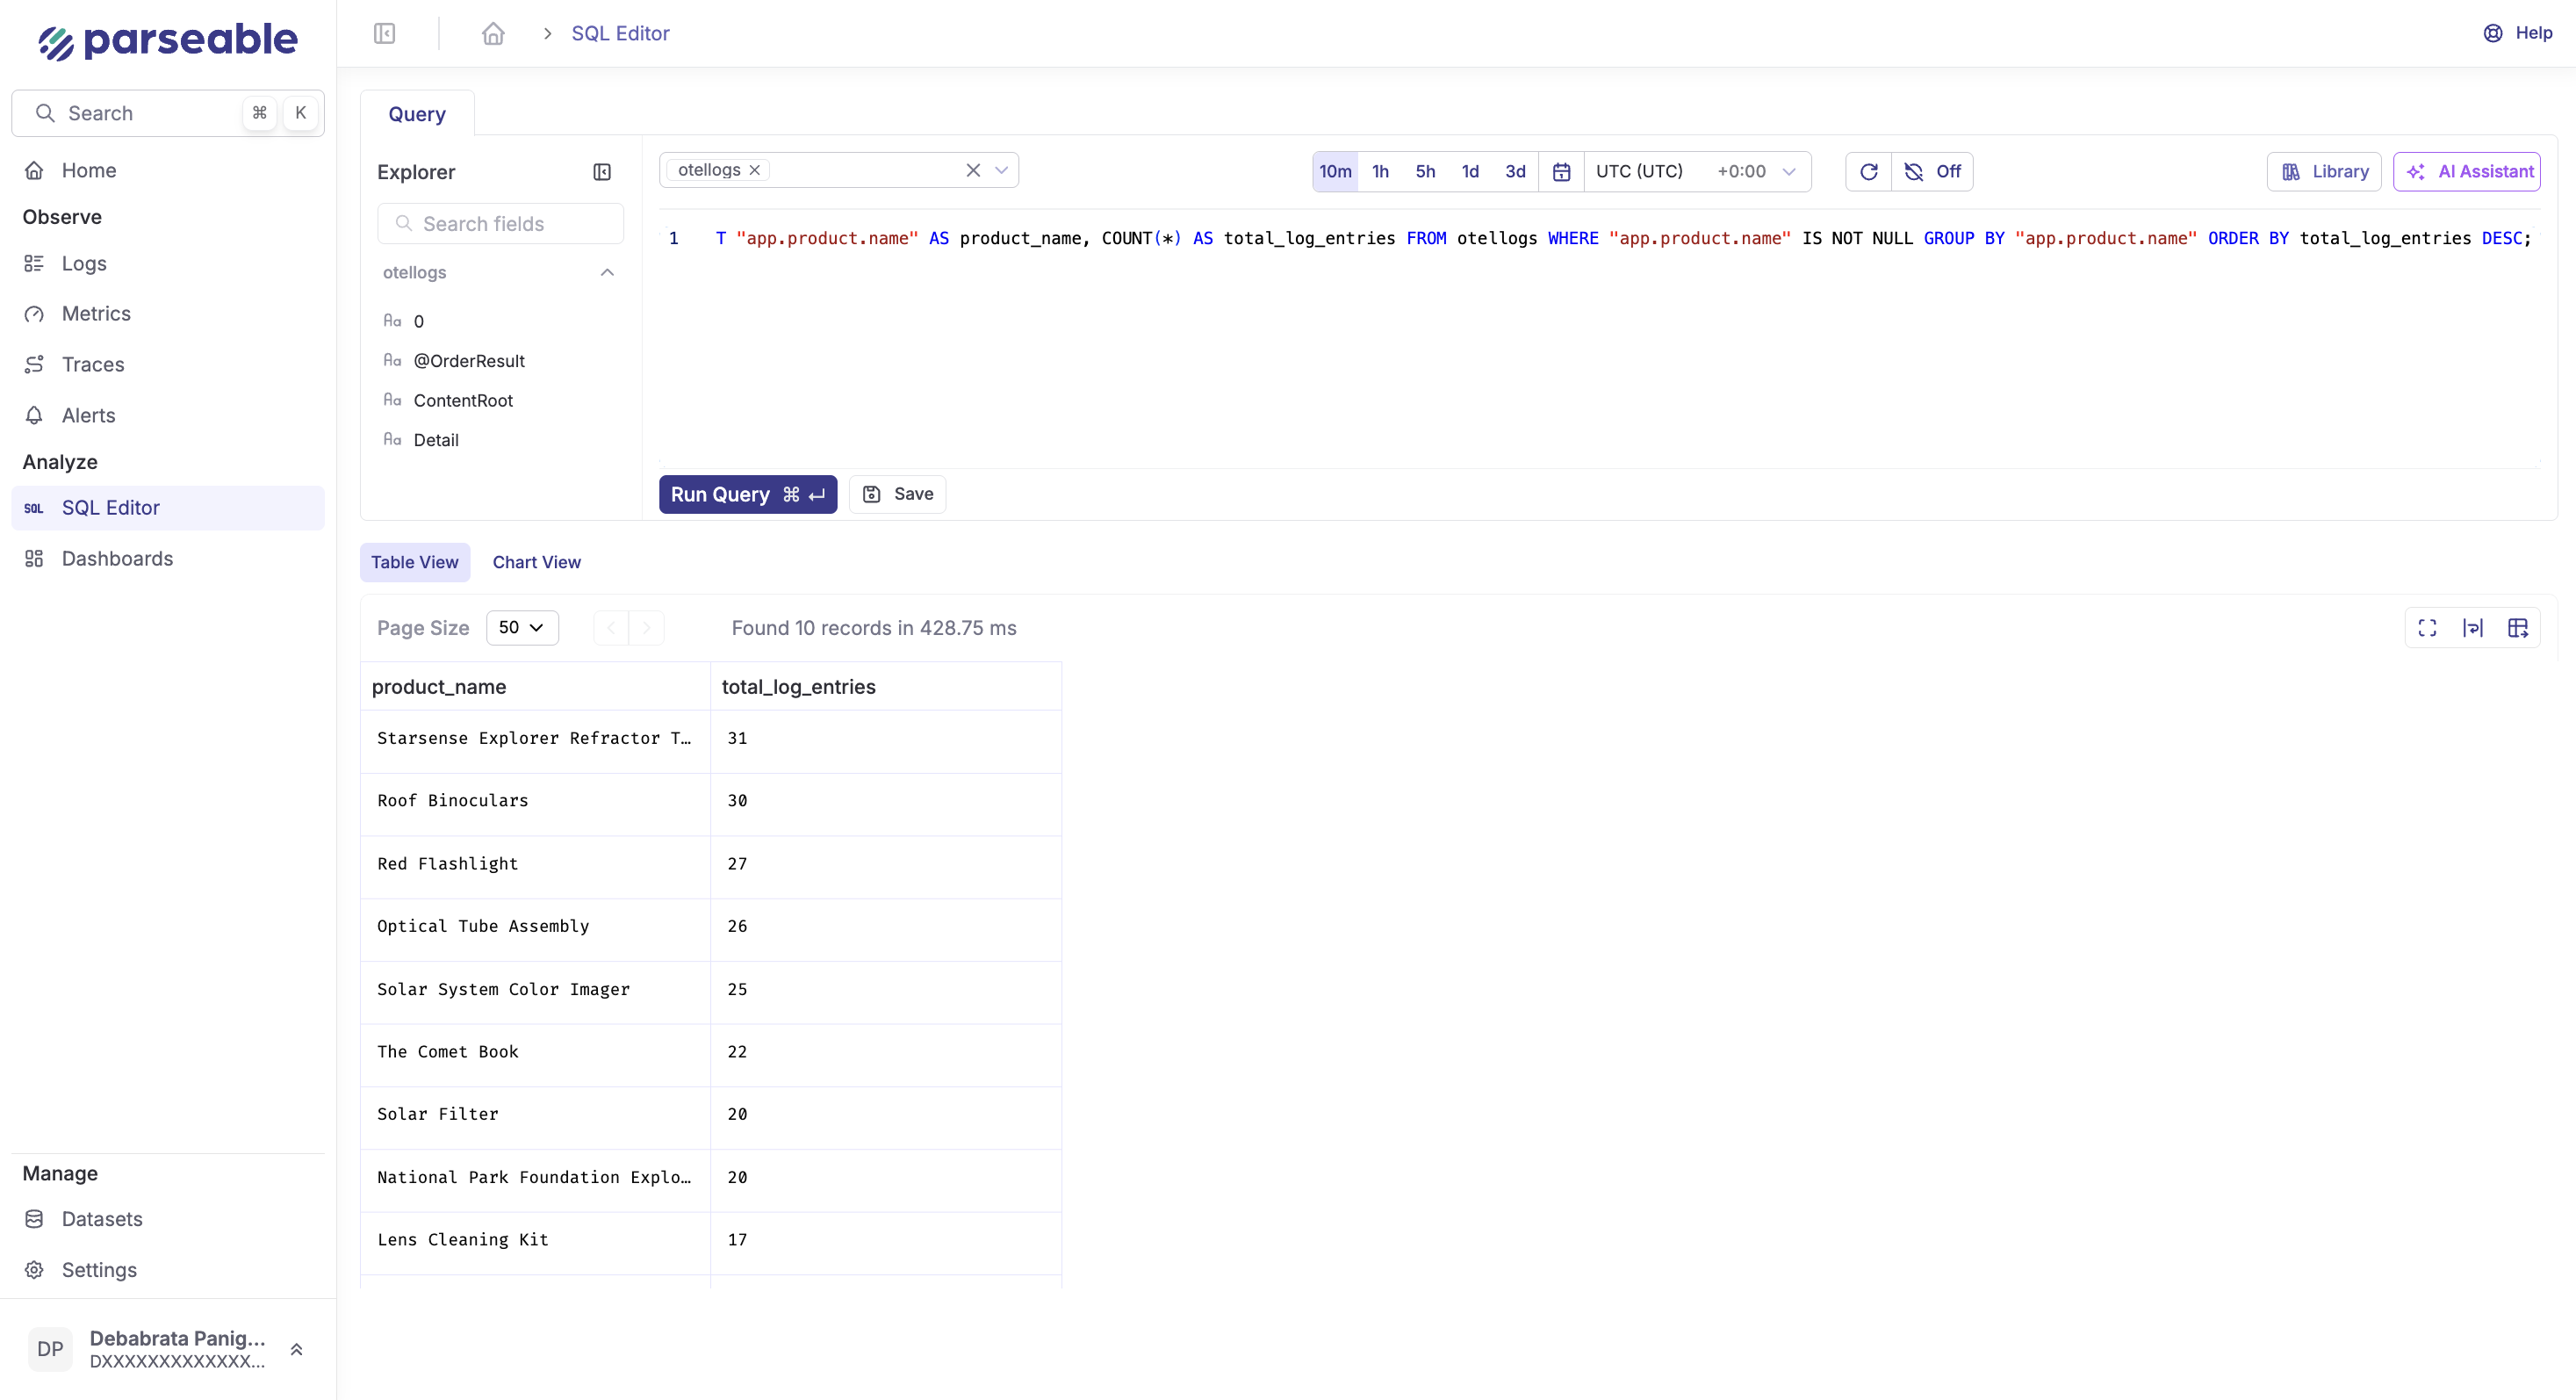
SELECT "service.name" AS service_name,
       COUNT(*) AS total_requests,
       AVG(CAST("duration" AS DOUBLE)) AS avg_duration_ms
FROM oteltraces
WHERE "span.kind" = 'server'
  AND "service.name" IS NOT NULL
GROUP BY "service.name"
ORDER BY total_requests DESC;
This SQL query analyzes server spans to show request volume and average response times by service, helping identify performance bottlenecks.
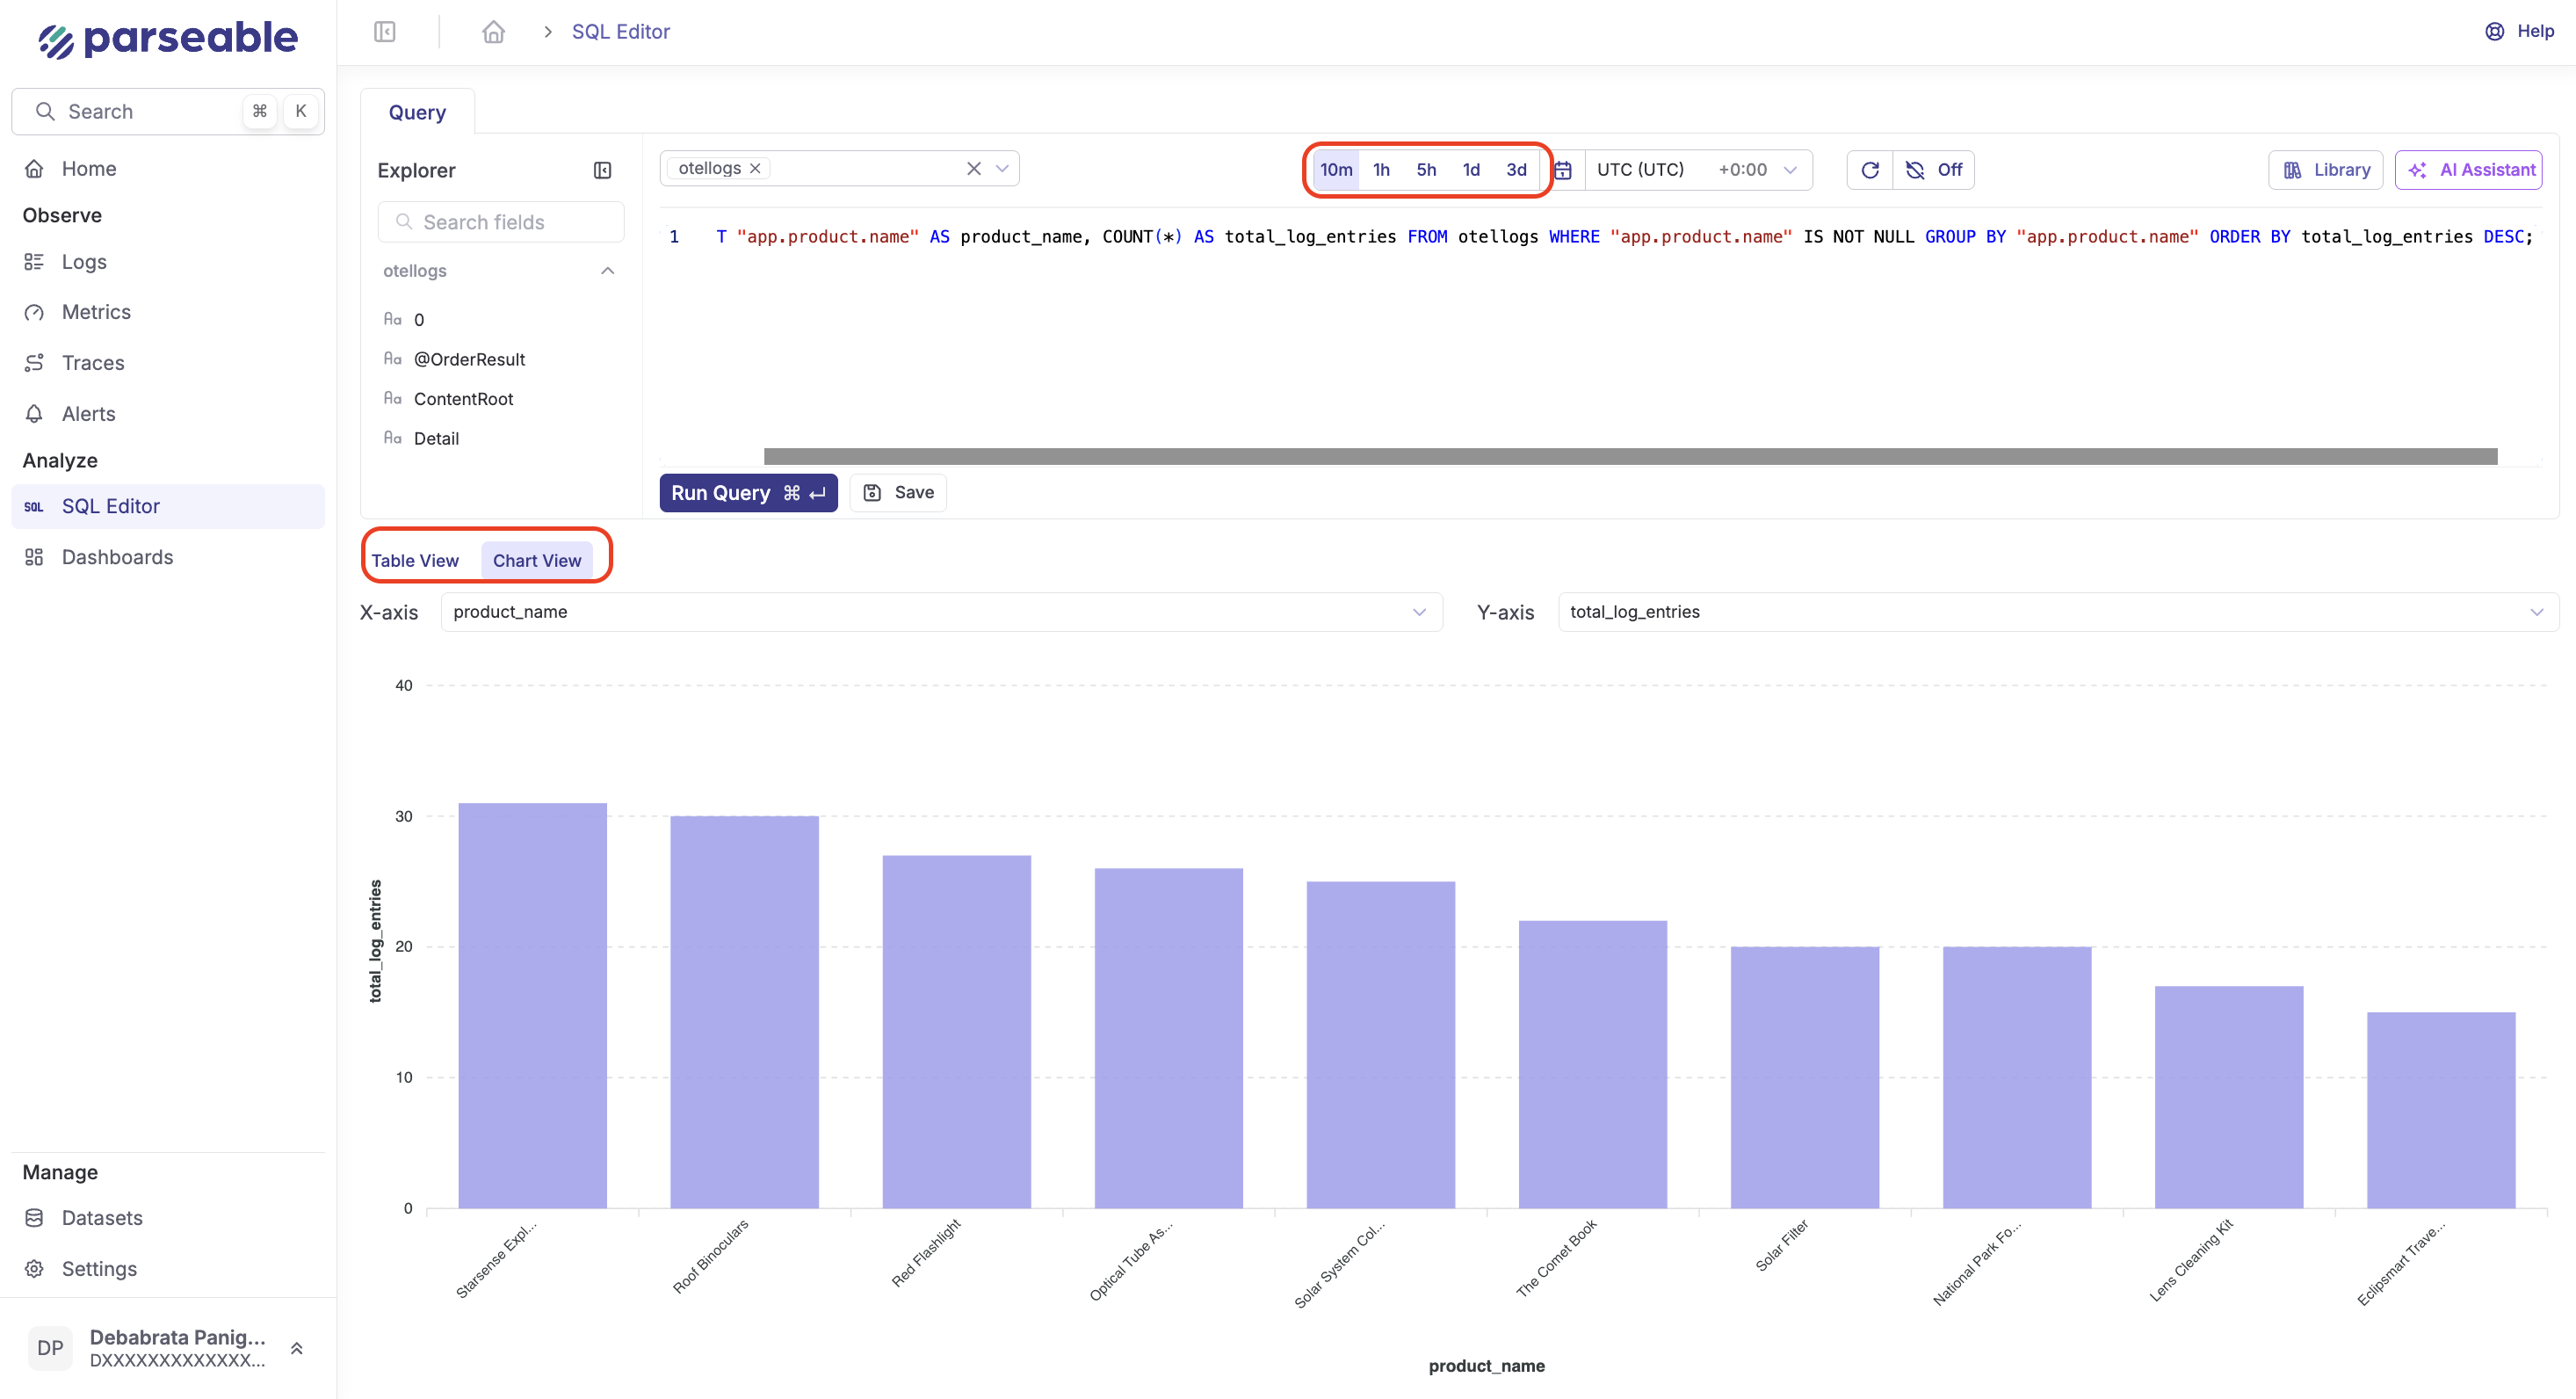
You can run queries across different time ranges and visualize results with charts:
Fluent Bit Specific Benefits
Resource Efficiency
Monitor Fluent Bit's resource usage compared to other collectors:
SELECT "container.name",
       AVG(CAST("memory.usage" AS DOUBLE)) as avg_memory_mb,
       AVG(CAST("cpu.usage" AS DOUBLE)) as avg_cpu_percent
FROM otelmetrics
WHERE "container.name" IN ('fluent-bit', 'otelcol')
GROUP BY "container.name";
Processing Performance
Analyze Fluent Bit's throughput and processing metrics:
SELECT DATE_TRUNC('minute', "@timestamp") as time_window,
       COUNT(*) as events_per_minute
FROM otellogs
WHERE "fluent-bit.source" IS NOT NULL
GROUP BY time_window
ORDER BY time_window DESC;
What's Next?
Now that you have the OpenTelemetry Demo running with Fluent Bit and Parseable, explore these advanced features:
Explore AI-Powered Features
Visit the Parseable Demo to see OpenTelemetry data in action with real-time logs, metrics, and traces. Experience Parseable's AI-powered features for observability.
Text-to-SQL Generation
Generate SQL queries from plain English descriptions. In the SQL editor, click the "Generate with AI" button and try these examples with your Fluent Bit data:
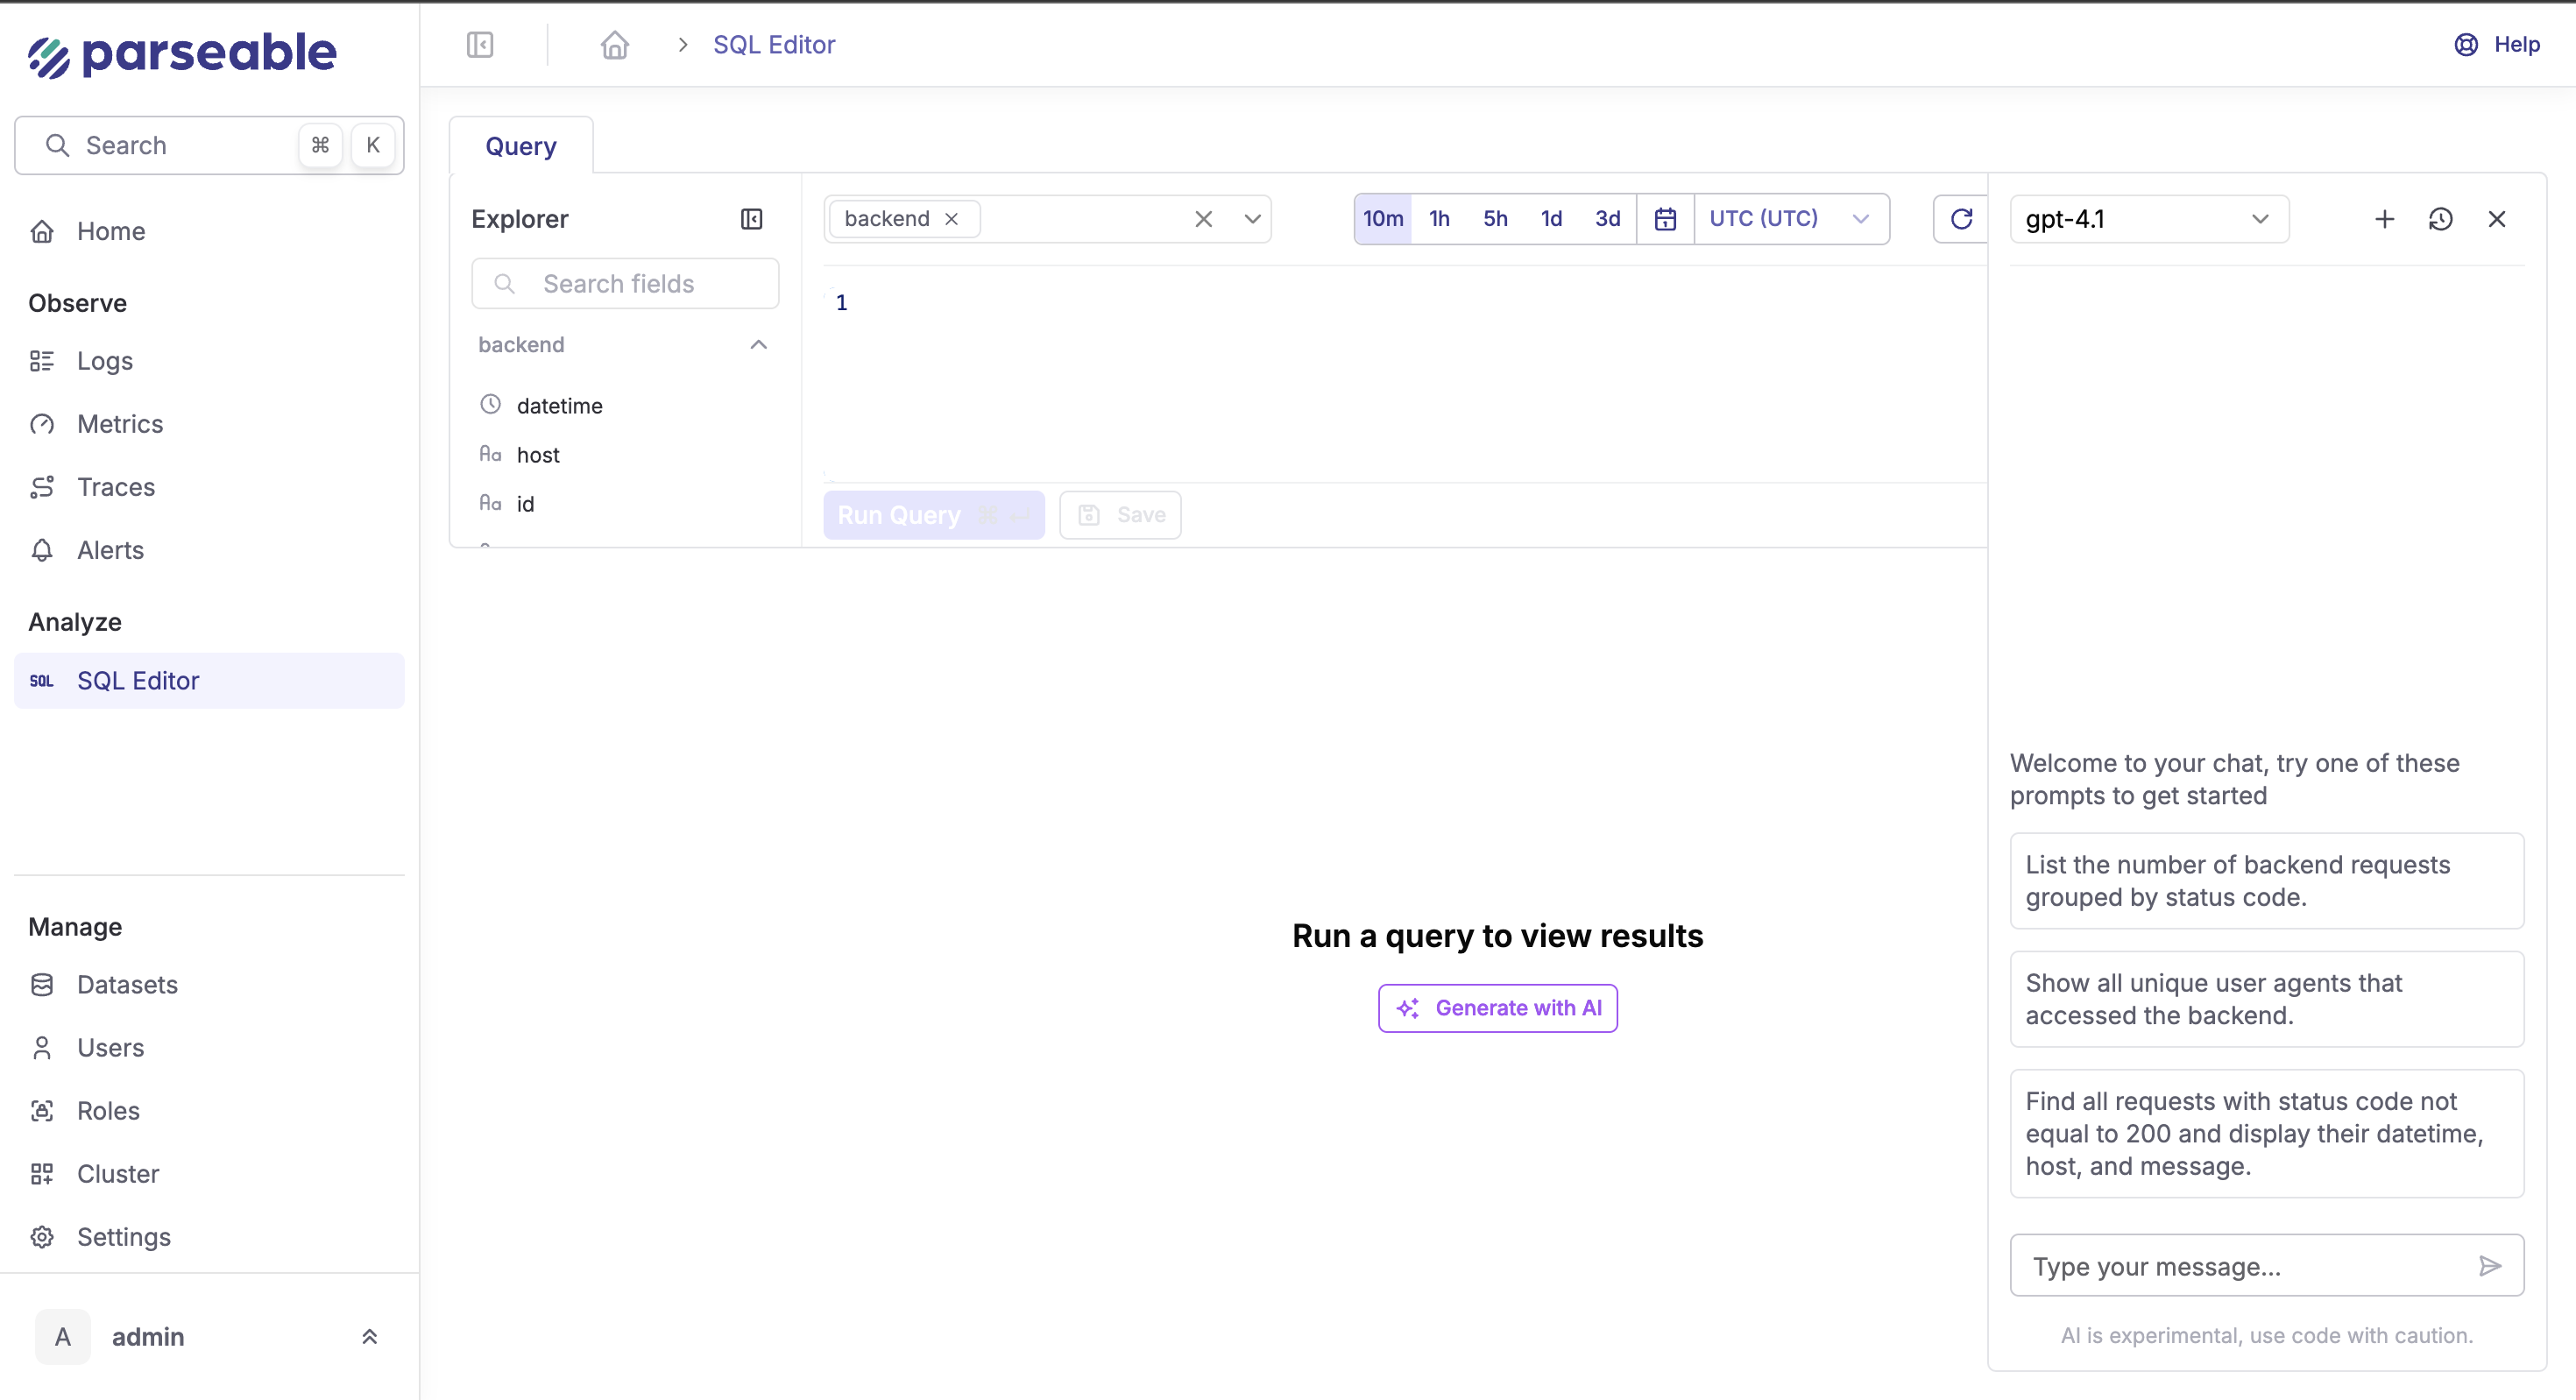
Example prompts for Fluent Bit data:
- "Show me the top 5 services by error rate in the last hour"
- "Find all traces with response times over 1 second"
- "Compare memory usage between different containers"
The AI will generate ready-to-run SQL queries that you can execute immediately or modify as needed.
AI Query Assistant
The AI assistant helps throughout your SQL workflow:
- Write new queries: Ask for complex analytics on your telemetry data
- Fix broken queries: Get syntax errors resolved automatically
- Explain queries: Understand what complex queries do
- Optimize queries: Improve performance and add filters
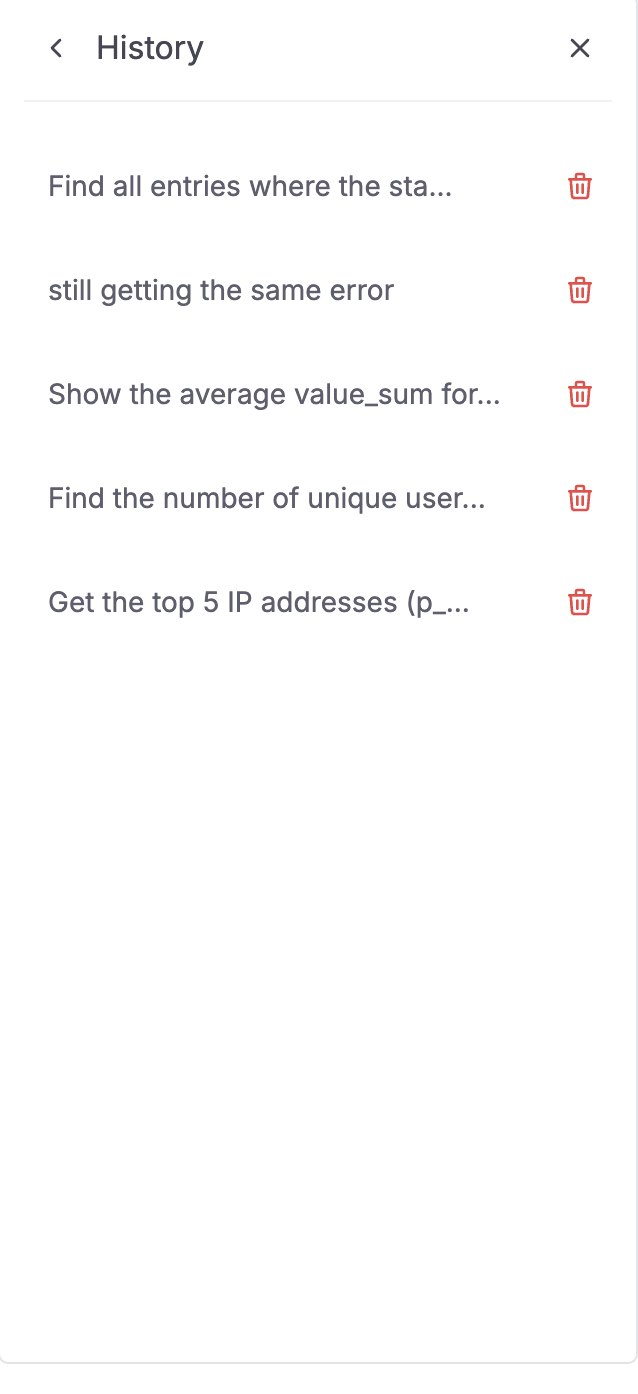
All conversations are saved in the History tab for easy reference.
Query Library
Save frequently used queries in the Library for quick access:
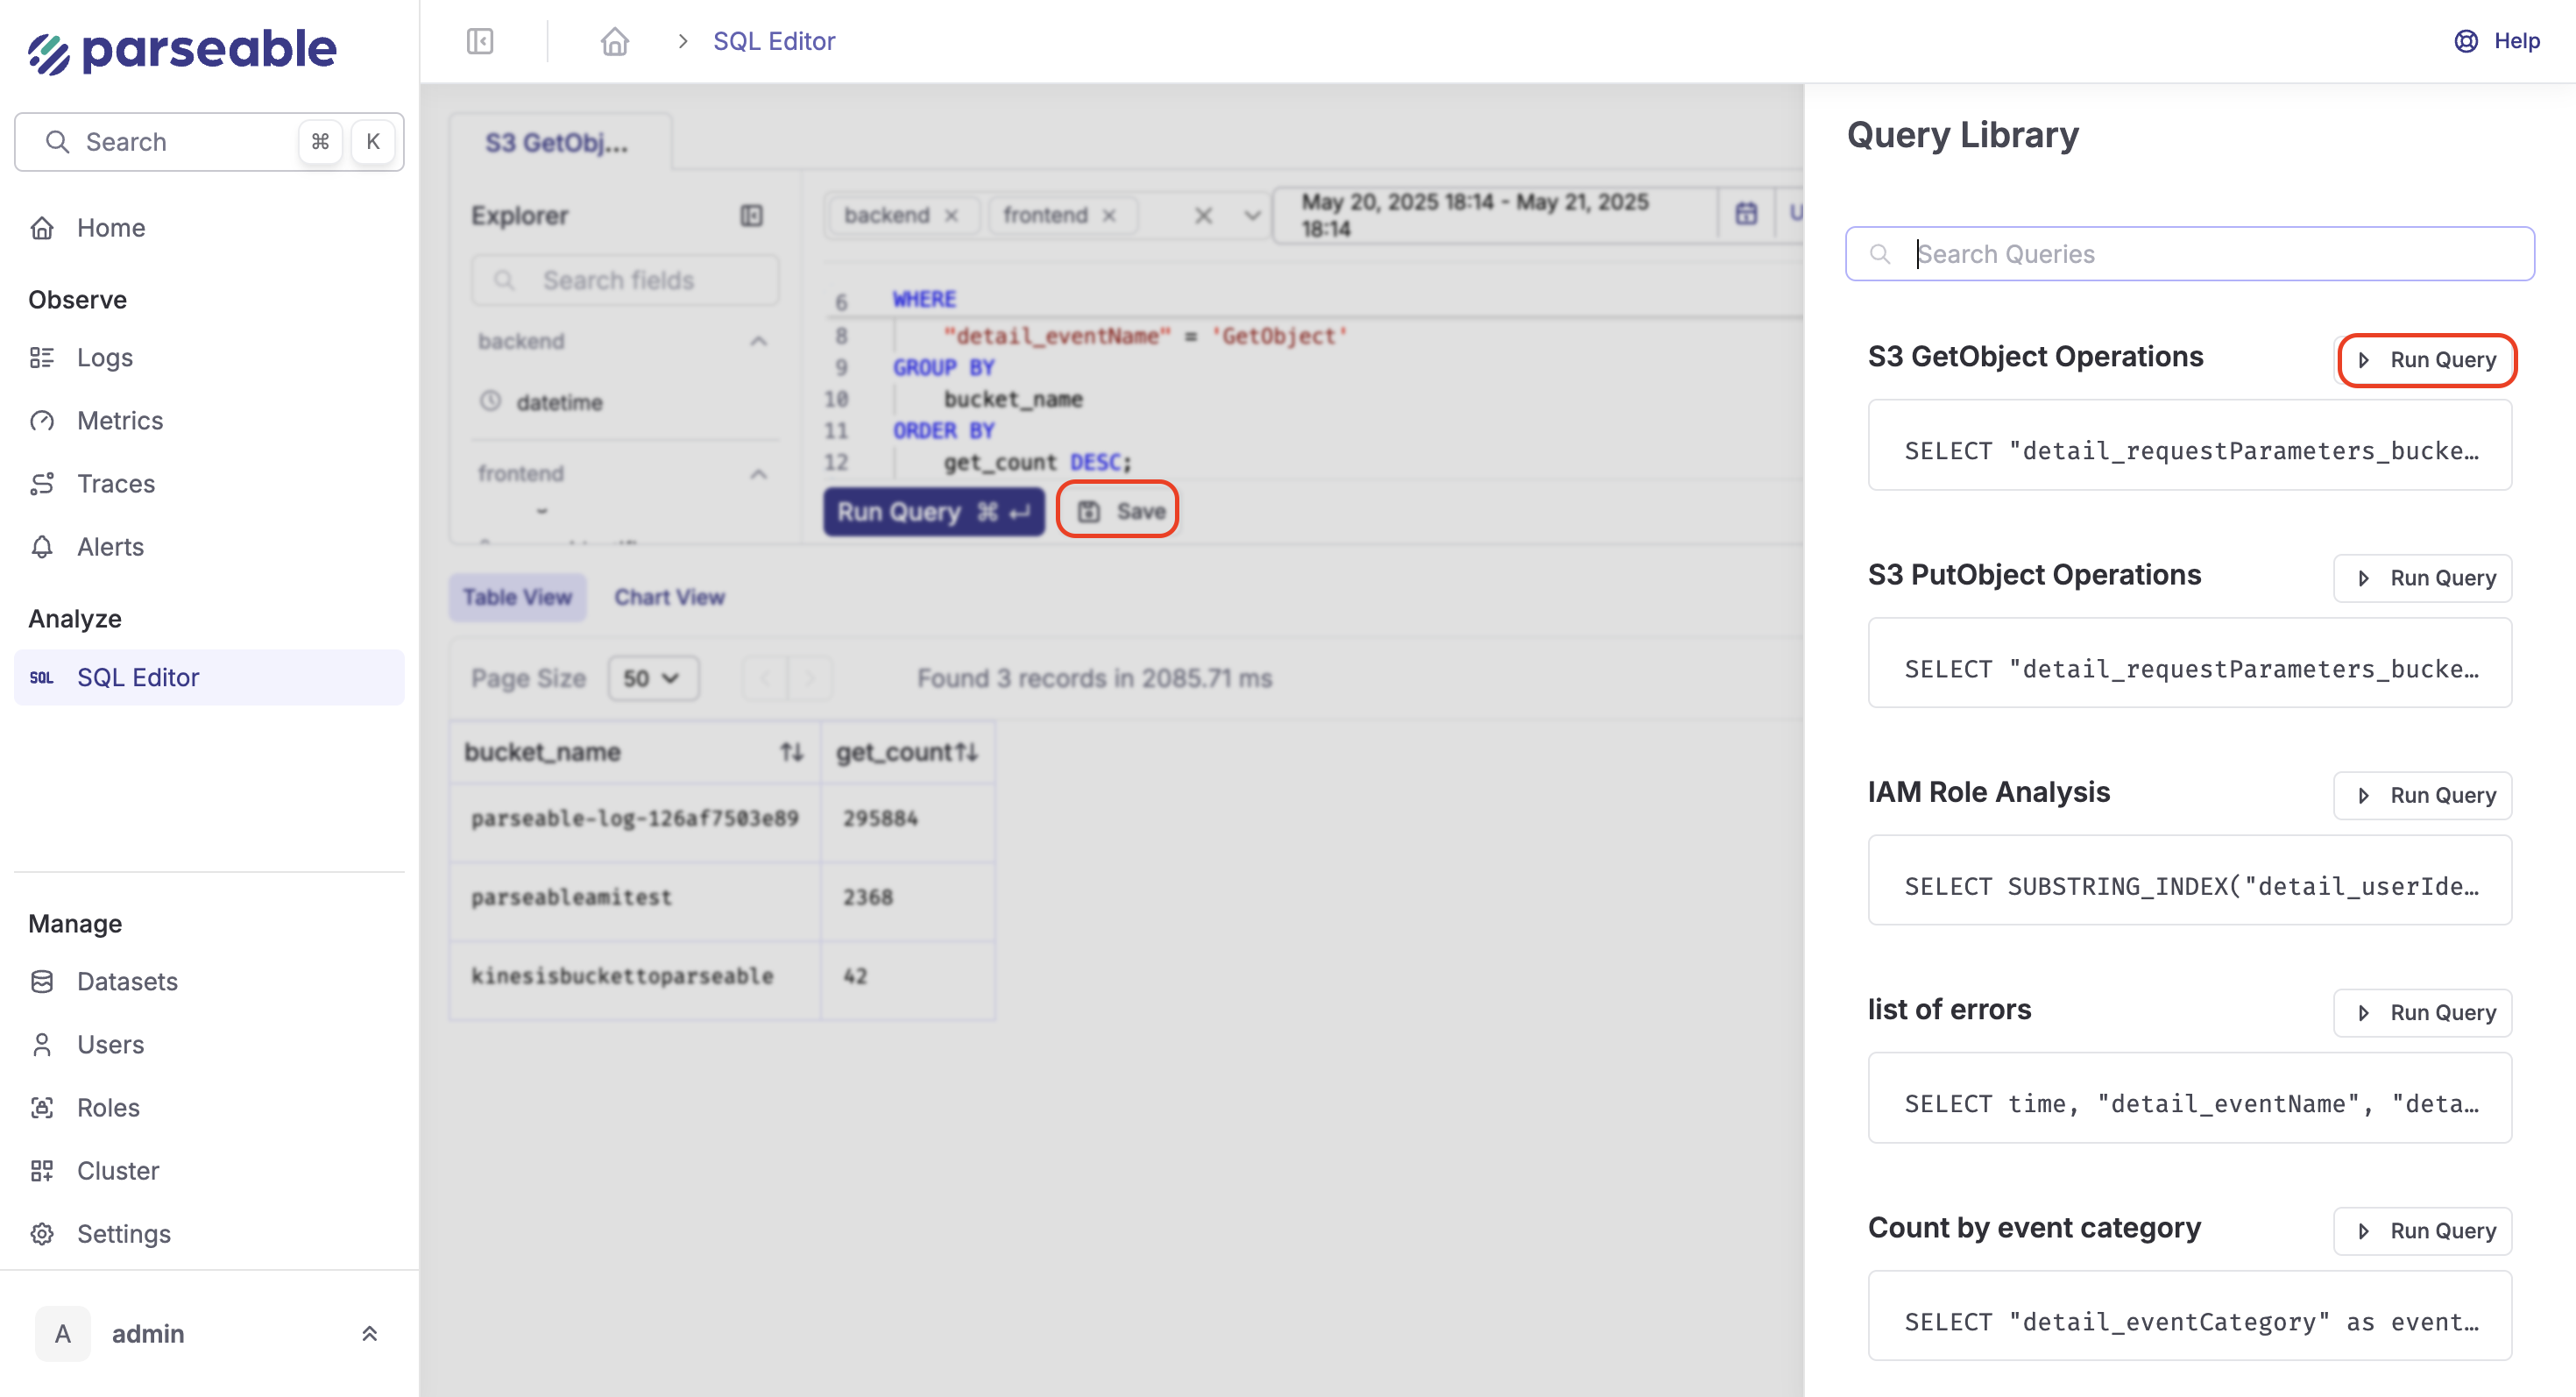
- Store common Fluent Bit analysis queries
- Search through your query collection
- Share queries with team members
Auto-Fix Failed Queries
When queries fail, click "Fix with AI" to automatically resolve issues:
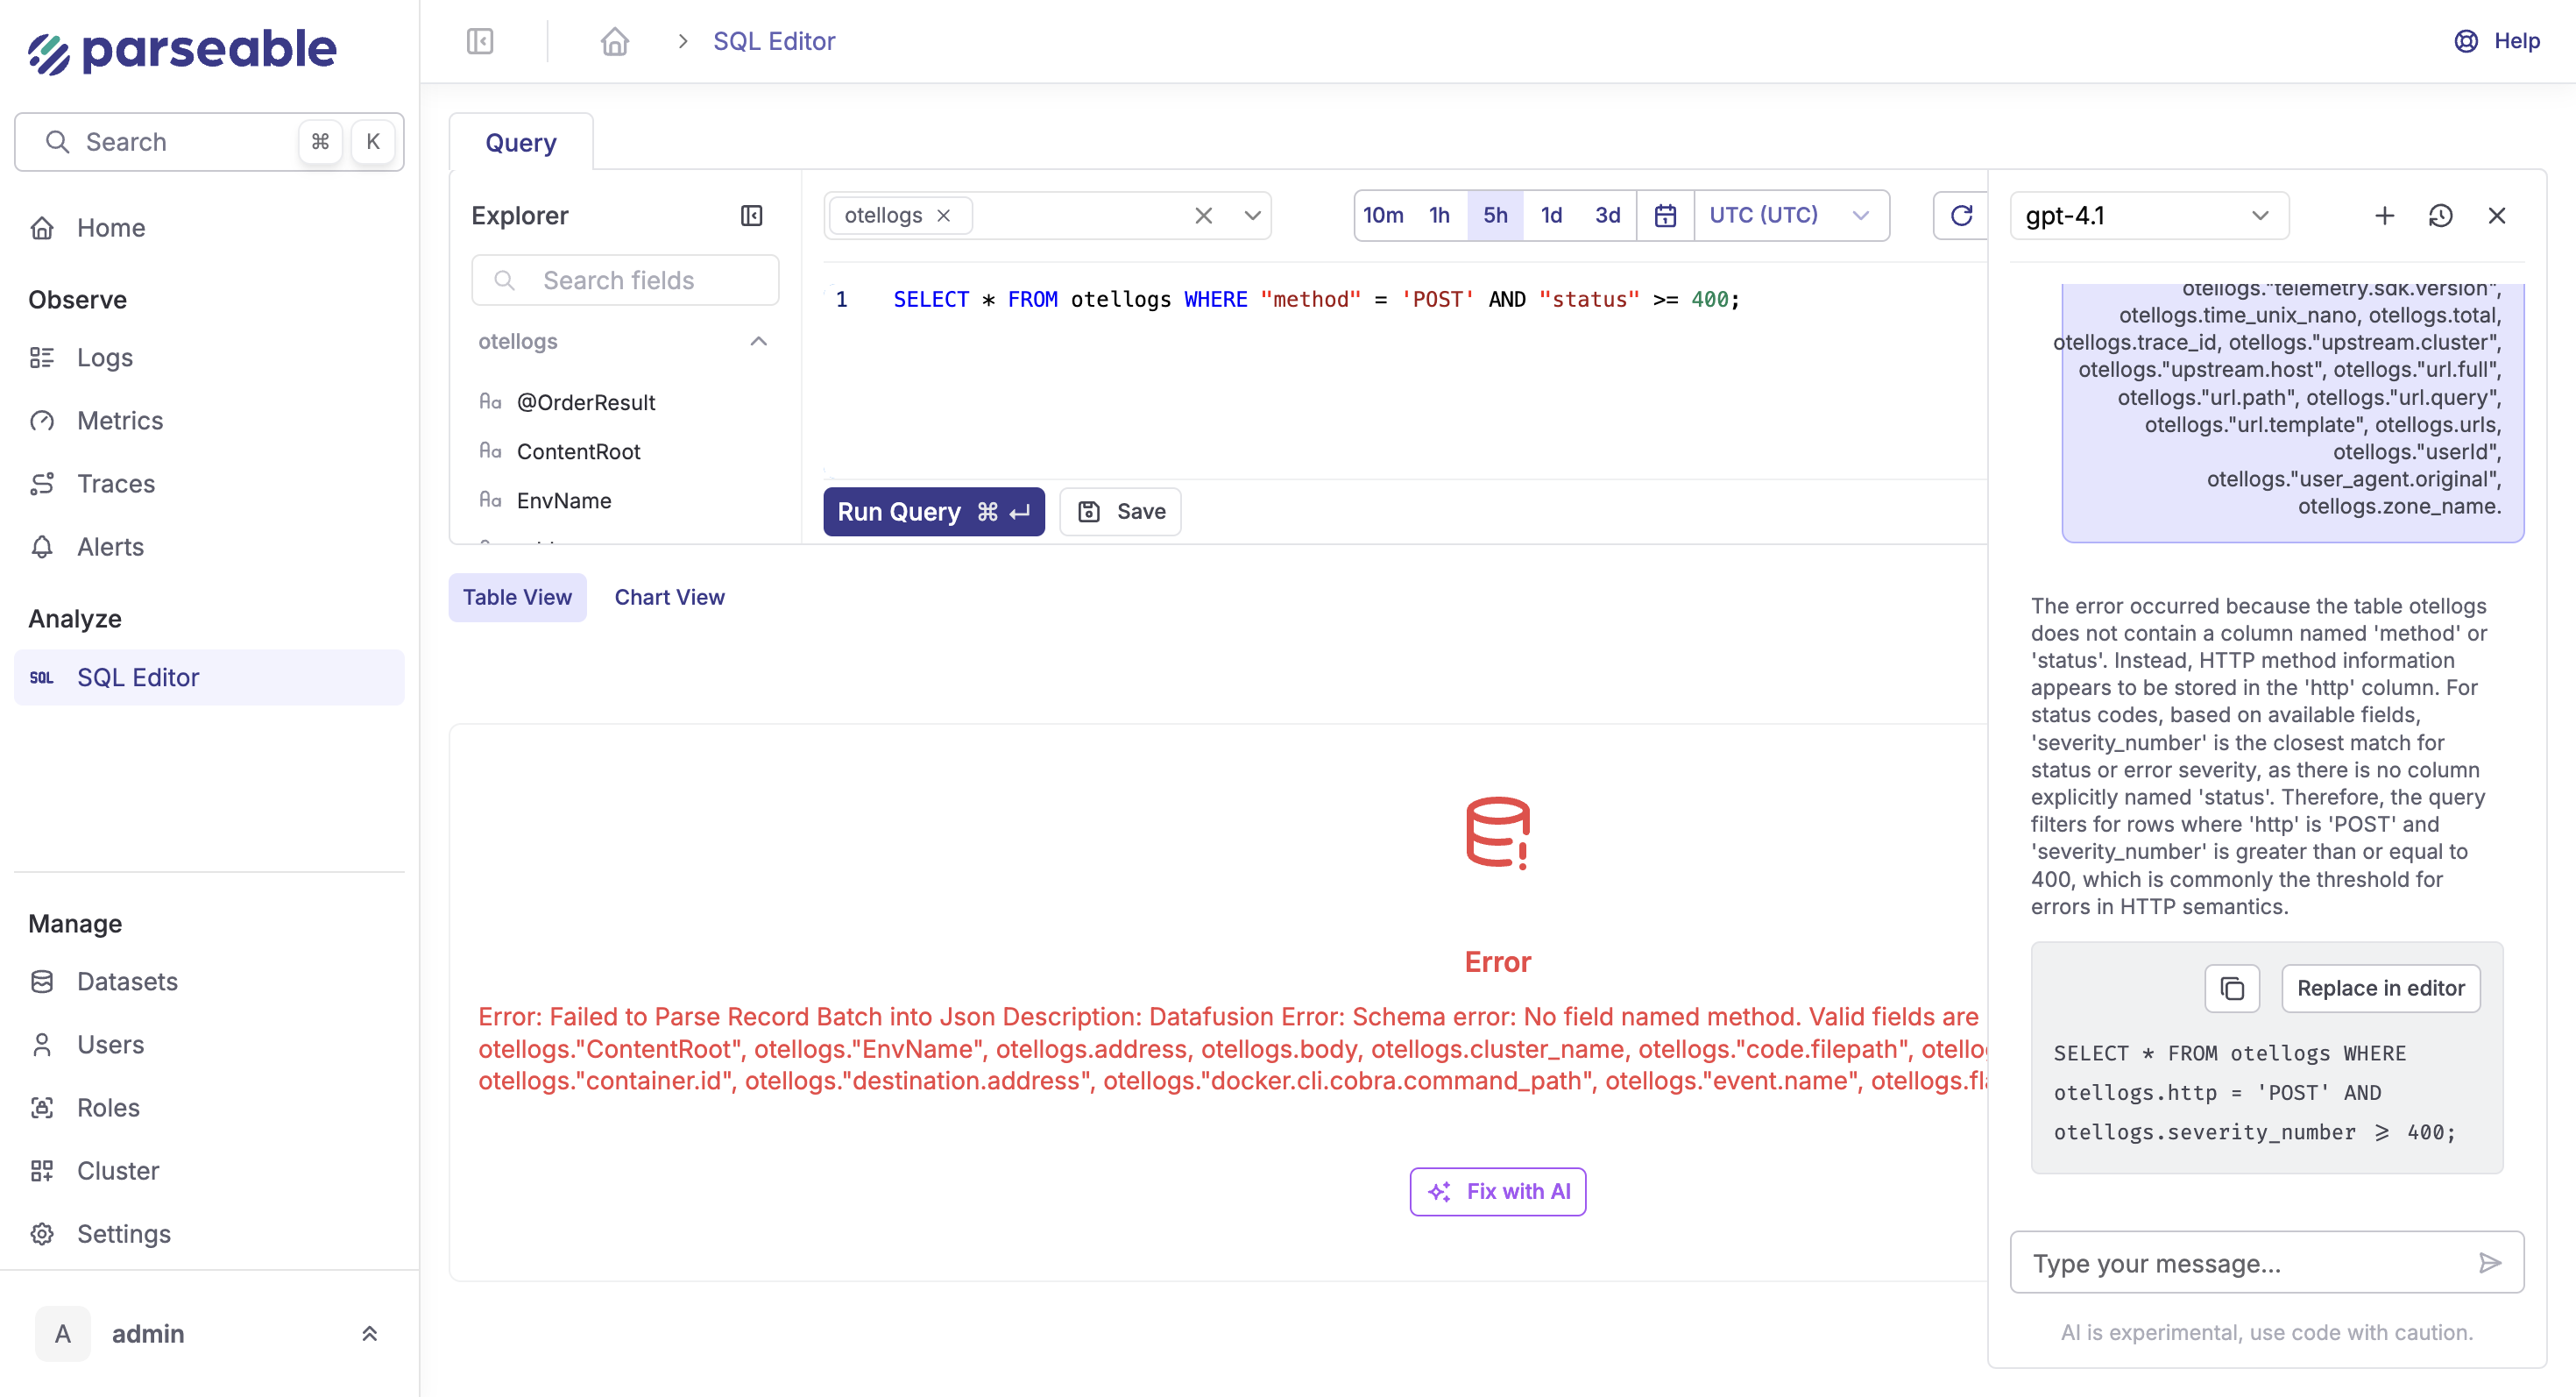
The AI analyzes your schema and corrects common issues like wrong field names, syntax errors, or aggregation problems.
AI-Powered Forecasting
Predict future data volumes and optimize resource allocation based on your Fluent Bit ingestion patterns:
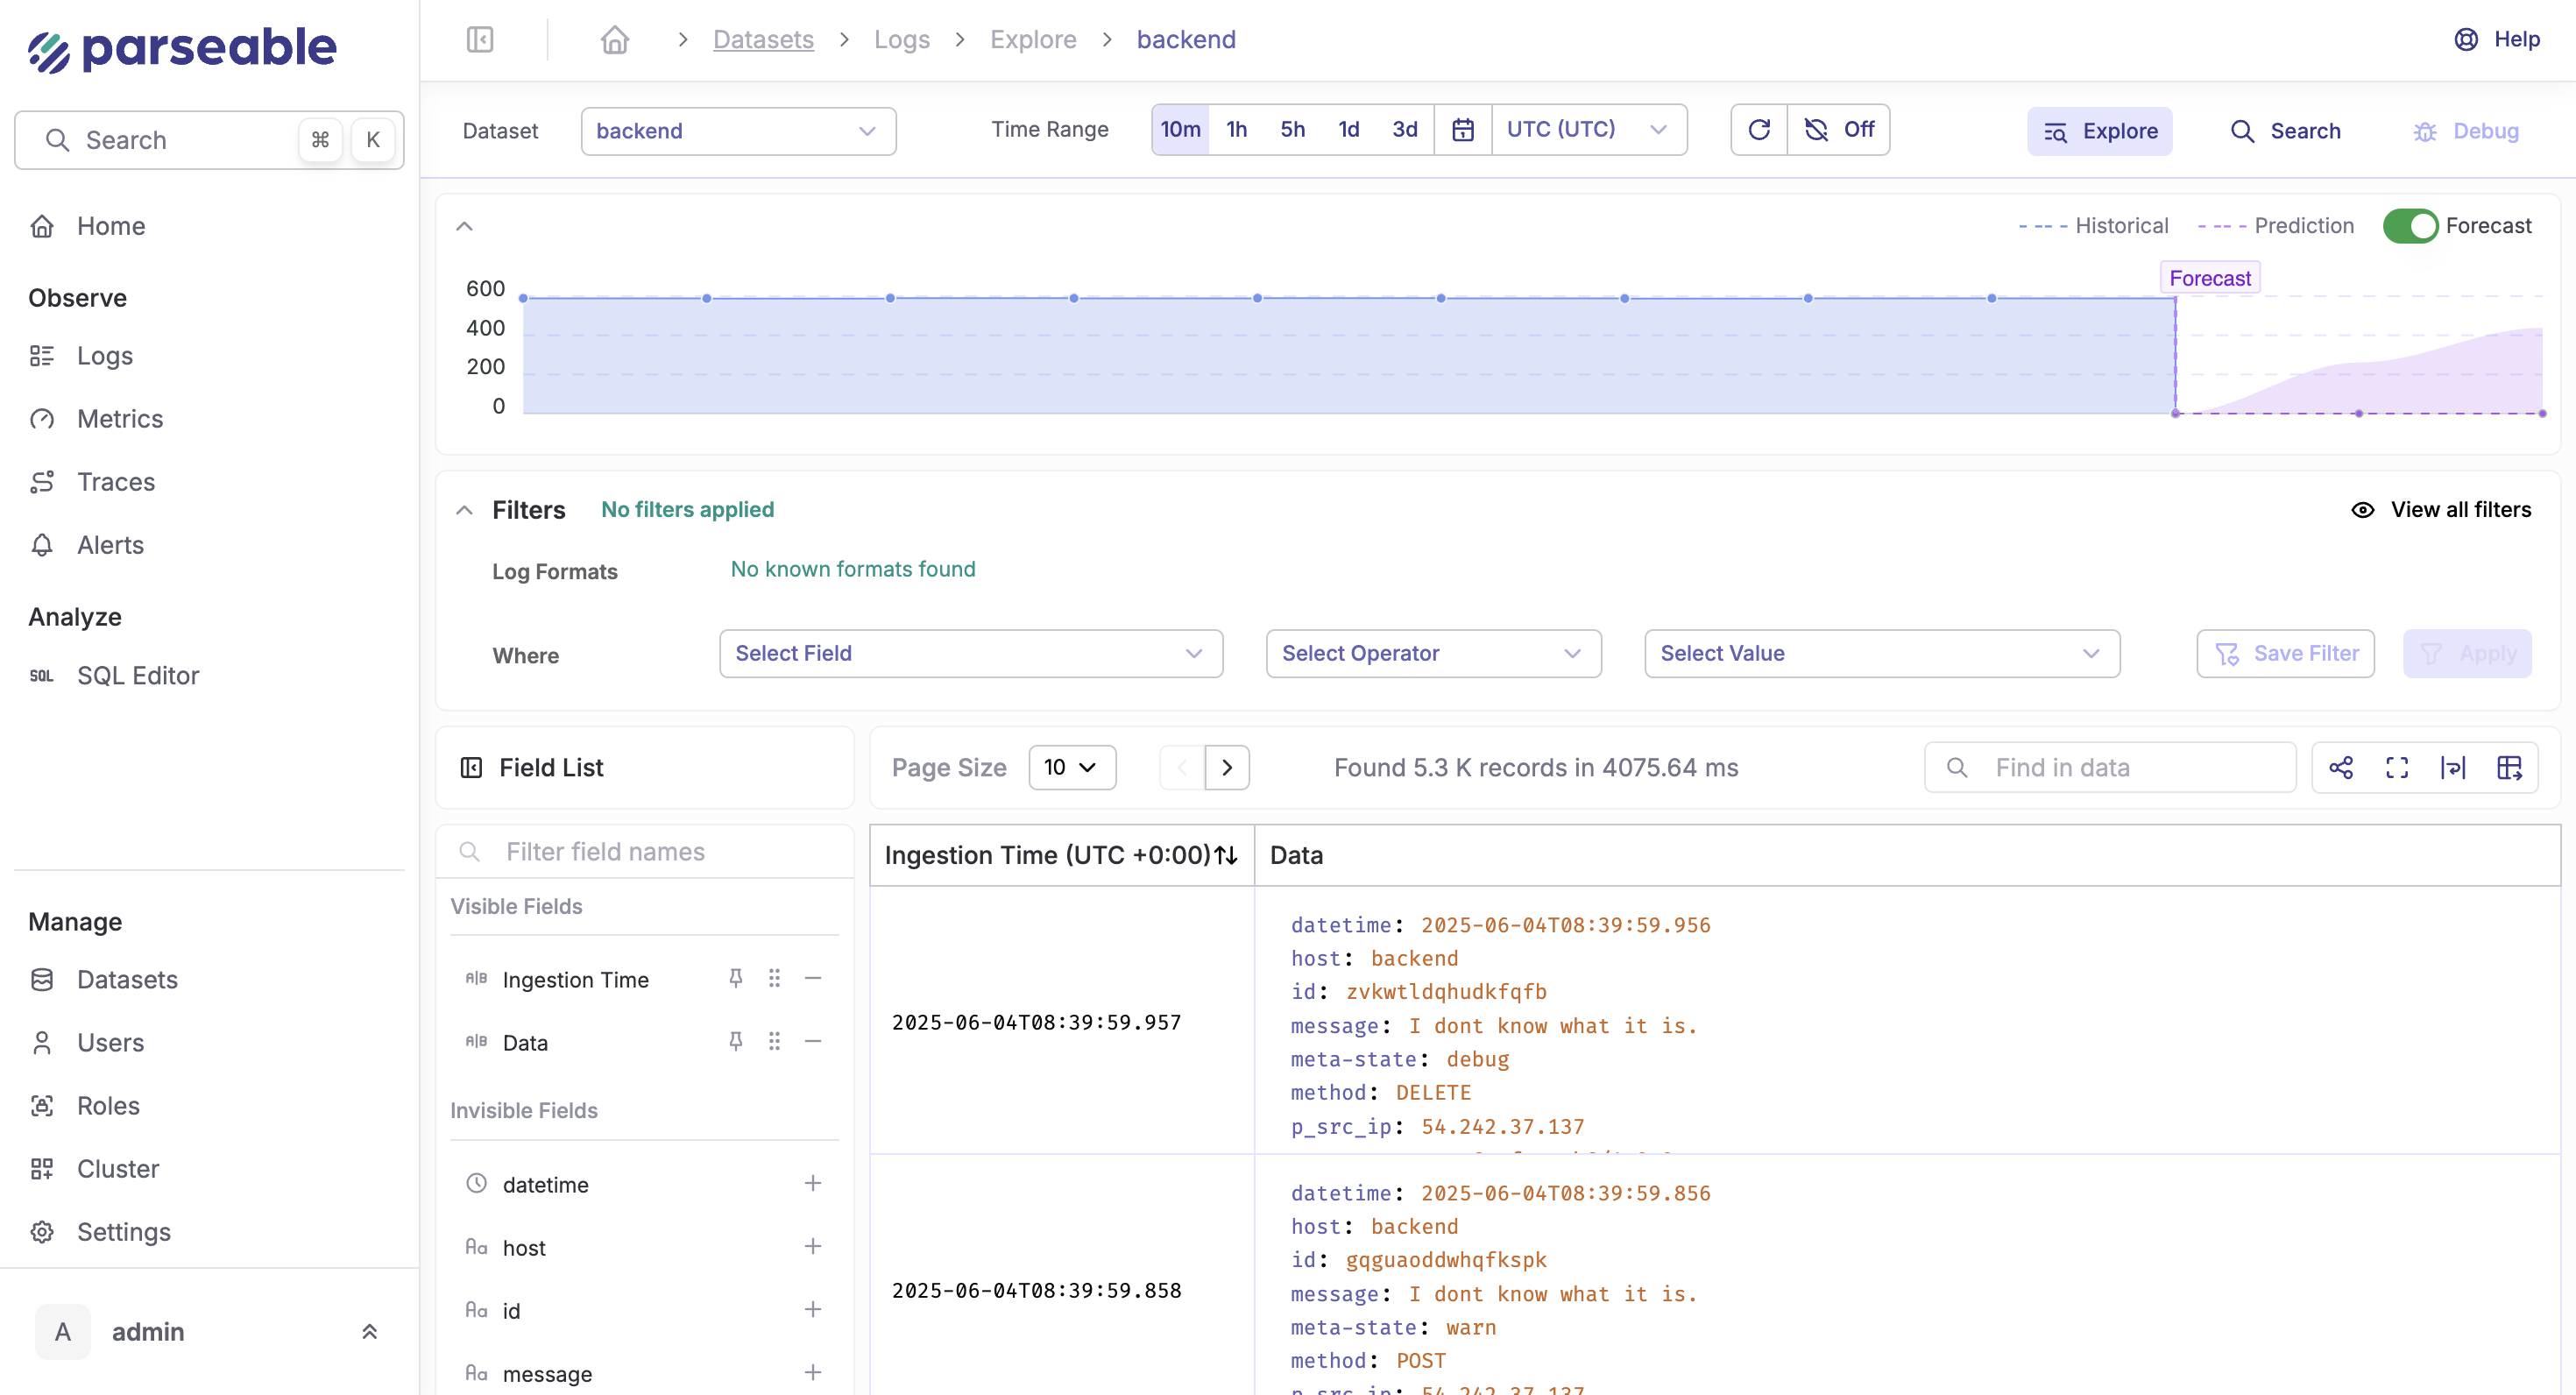
Use cases for Fluent Bit deployments:
- Predict log volume growth
- Plan storage capacity
- Optimize Fluent Bit buffer configurations
Data Summarization
Get instant insights from your telemetry datasets with AI-powered summarization:
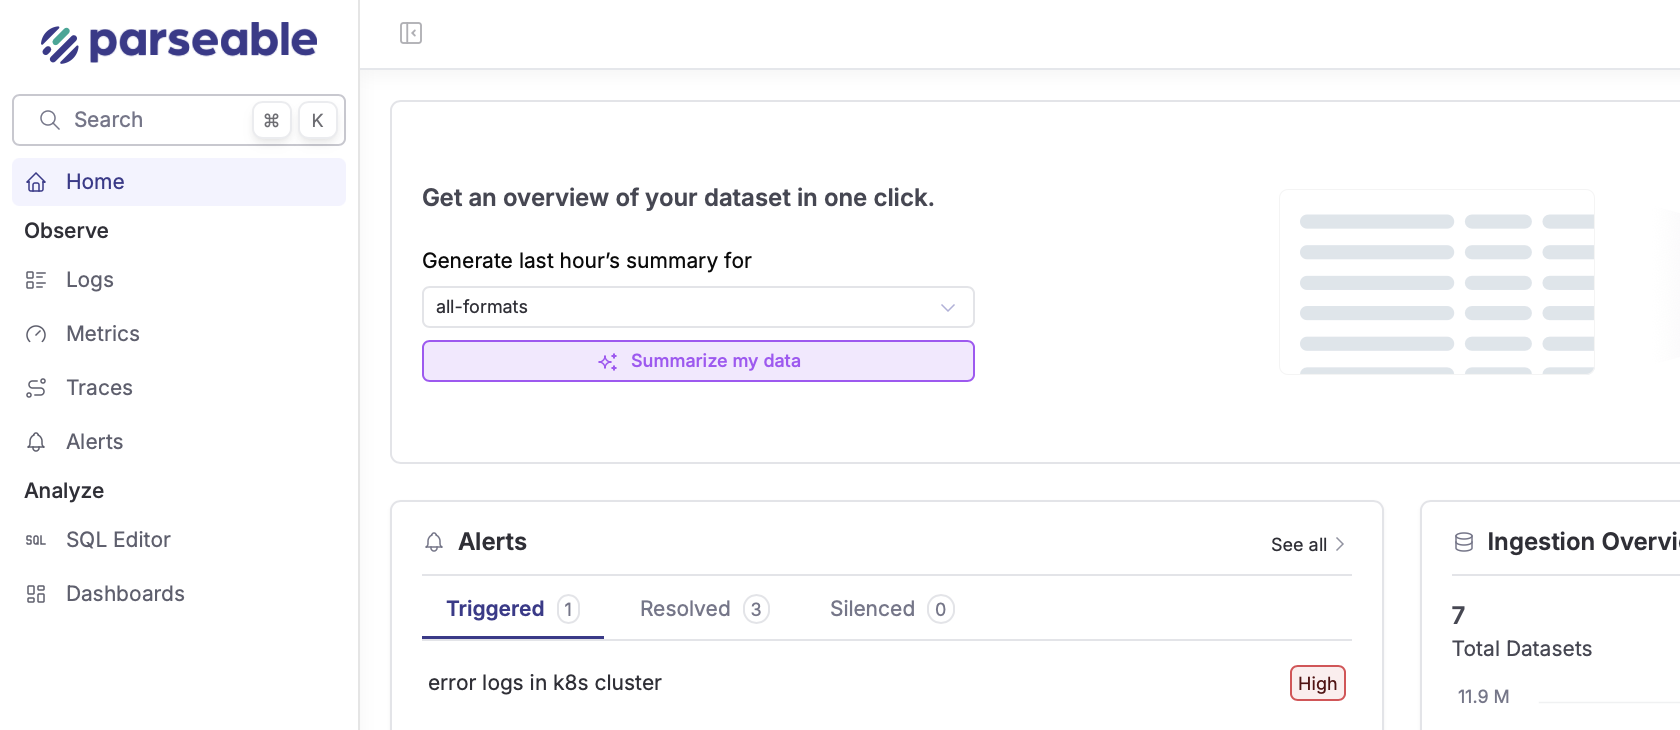
How to use:
- Select any dataset (logs, metrics, or traces)
- Click "Summarize my data"
- Get key patterns, anomalies, and potential issues identified
- Receive actionable recommendations and SQL queries for deeper analysis
Advanced Fluent Bit Configuration
Explore advanced Fluent Bit features:
- Custom Parsers: Create parsers for application-specific log formats
- Lua Scripting: Add custom processing logic
- Stream Processing: Implement real-time data transformations
- Multi-destination Routing: Send different data types to different backends
Performance Optimization
Optimize your Fluent Bit deployment:
- Monitor buffer usage and adjust configurations
- Tune worker processes for your workload
- Implement backpressure handling
- Configure retry mechanisms for reliability
Join the Community
Connect with other Parseable and Fluent Bit users:
- Parseable GitHub Repository
- Fluent Bit Documentation
- Parseable Slack Community
- CNCF Fluent Community
Start your observability journey with Fluent Bit and Parseable today and experience the power of efficient, unified telemetry collection and analysis!

