Introduction
Organizations generate massive volumes of telemetry data - logs, metrics, traces, and events. SRE teams need to correlate this in real-time to ensure system reliability. Yet most organizations struggle with fragmented observability stacks that make this correlation nearly impossible.
With ever growing observability data and strict up-time requirements, simplification in the architecture and operations is the key driver for sustainable observability tooling.
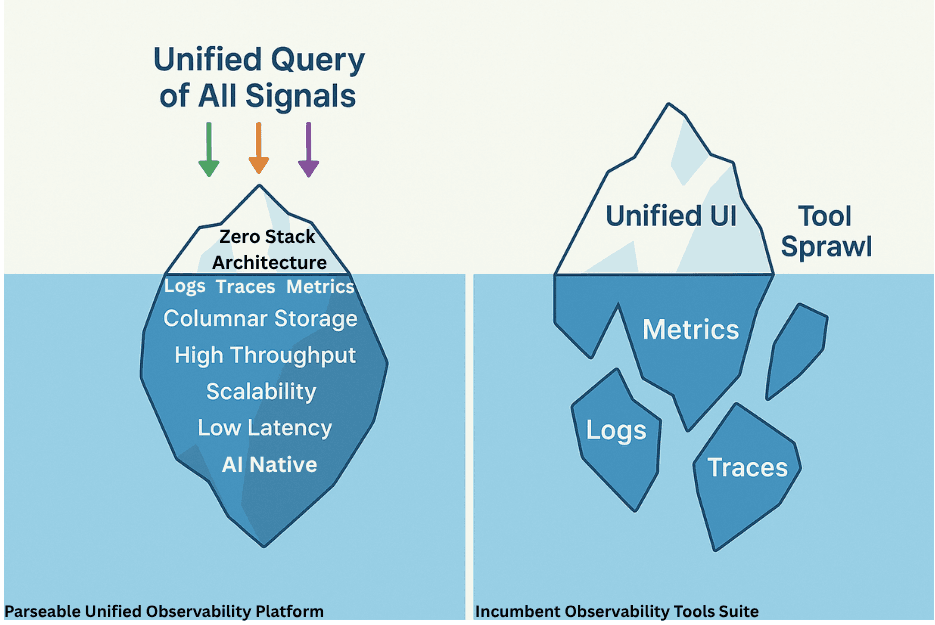
Zero stack architecture offers a fundamentally different approach: unifying all observability signals in a single platform to deliver true full-stack visibility. Think of zero stack design as a highly scalable, observability data lake that allows high throughput ingestion, real time querying, correlation and more.
The challenge with observability stacks
Traditional observability stack architecture fragments data by design. A typical stack looks like - Elasticsearch or Splunk for logs, Prometheus or Thanos for metrics, and Jaeger or Zipkin for traces. This separation creates multiple layers of organizational complexity - data scattered across teams, business units, environments, and database systems. This leads to several challenges.
-
Poor incident response: When production incidents occur, engineers waste critical time jumping between tools, manually piecing together events across disconnected systems. Mean time to resolution (MTTR) suffers because the architecture itself prevents the correlation that modern troubleshooting demands.
-
Operational Complexity: Managing multiple observability systems means maintaining separate infrastructure stacks, each with distinct upgrade cycles, backup procedures, security configurations, and expertise requirements. Platform teams spend disproportionate time on operational overhead rather than delivering value to development teams.
-
AI Integration Barriers: Modern observability increasingly relies on AI-powered capabilities like anomaly detection, intelligent alerting, and automated root cause analysis. These systems require comprehensive data access to function effectively. Fragmented architectures force AI agents to integrate with multiple APIs, schemas, and data formats, significantly limiting their analytical capabilities and accuracy.
-
Cost visibility and control: Distributed tooling creates opaque cost structures where observability spending is scattered across multiple vendors, infrastructure components, and team budgets. Organizations struggle to understand their total cost of observability ownership, making optimization nearly impossible. This often results in runaway costs that can reach 20-30% of infrastructure spend without clear business justification.
To understand why zero stack architecture addresses these challenges, it's helpful to examine how similar problems were solved in adjacent domains.
The case for unified, zero stack observability system
The big data and analytics ecosystem faced a familiar challenge: diverse data sources generating massive volumes, fragmented across organizational silos, teams, and storage systems. The unified data lake emerged as a solution that enabled analysts to slice and dice data across previously isolated sources, unlocking insights that were impossible when data remained scattered.
Today's observability landscape mirrors the big data fragmentation. Distributed systems create cascading failures that span multiple services, infrastructure layers, and signal types. A single user-facing issue might originate from a memory leak (visible in metrics), generate specific error patterns (captured in logs), and create request latency spikes (tracked in traces). Just as business analysts needed to correlate customer data across CRM, web analytics, and transaction systems, DevOps teams need to correlate events across logs, metrics, and traces to understand complex system behaviors.
The architectural solution follows the same principle: rather than maintaining separate specialized systems for each observability signal type, unified observability platforms apply the data lake approach. This consolidates all telemetry data into a single, queryable repository optimized for cross-signal analysis and correlation.
Zero stack architecture provides the most value for organizations generating high-volume observability data - typically 20TB or more daily. At this scale, the operational complexity of managing multiple systems becomes prohibitive, and the correlation benefits of unification become essential for maintaining system reliability.
Having established the principles of zero stack architecture, let's examine how these concepts translate to practical implementation.
Understanding the Parseable zero stack architecture
Zero stack is our design philosophy aimed at simplifying the operational overhead prevalent in the observability tooling. Our goal is a single system that can efficiently and functionally handle different types of telemetry signals.
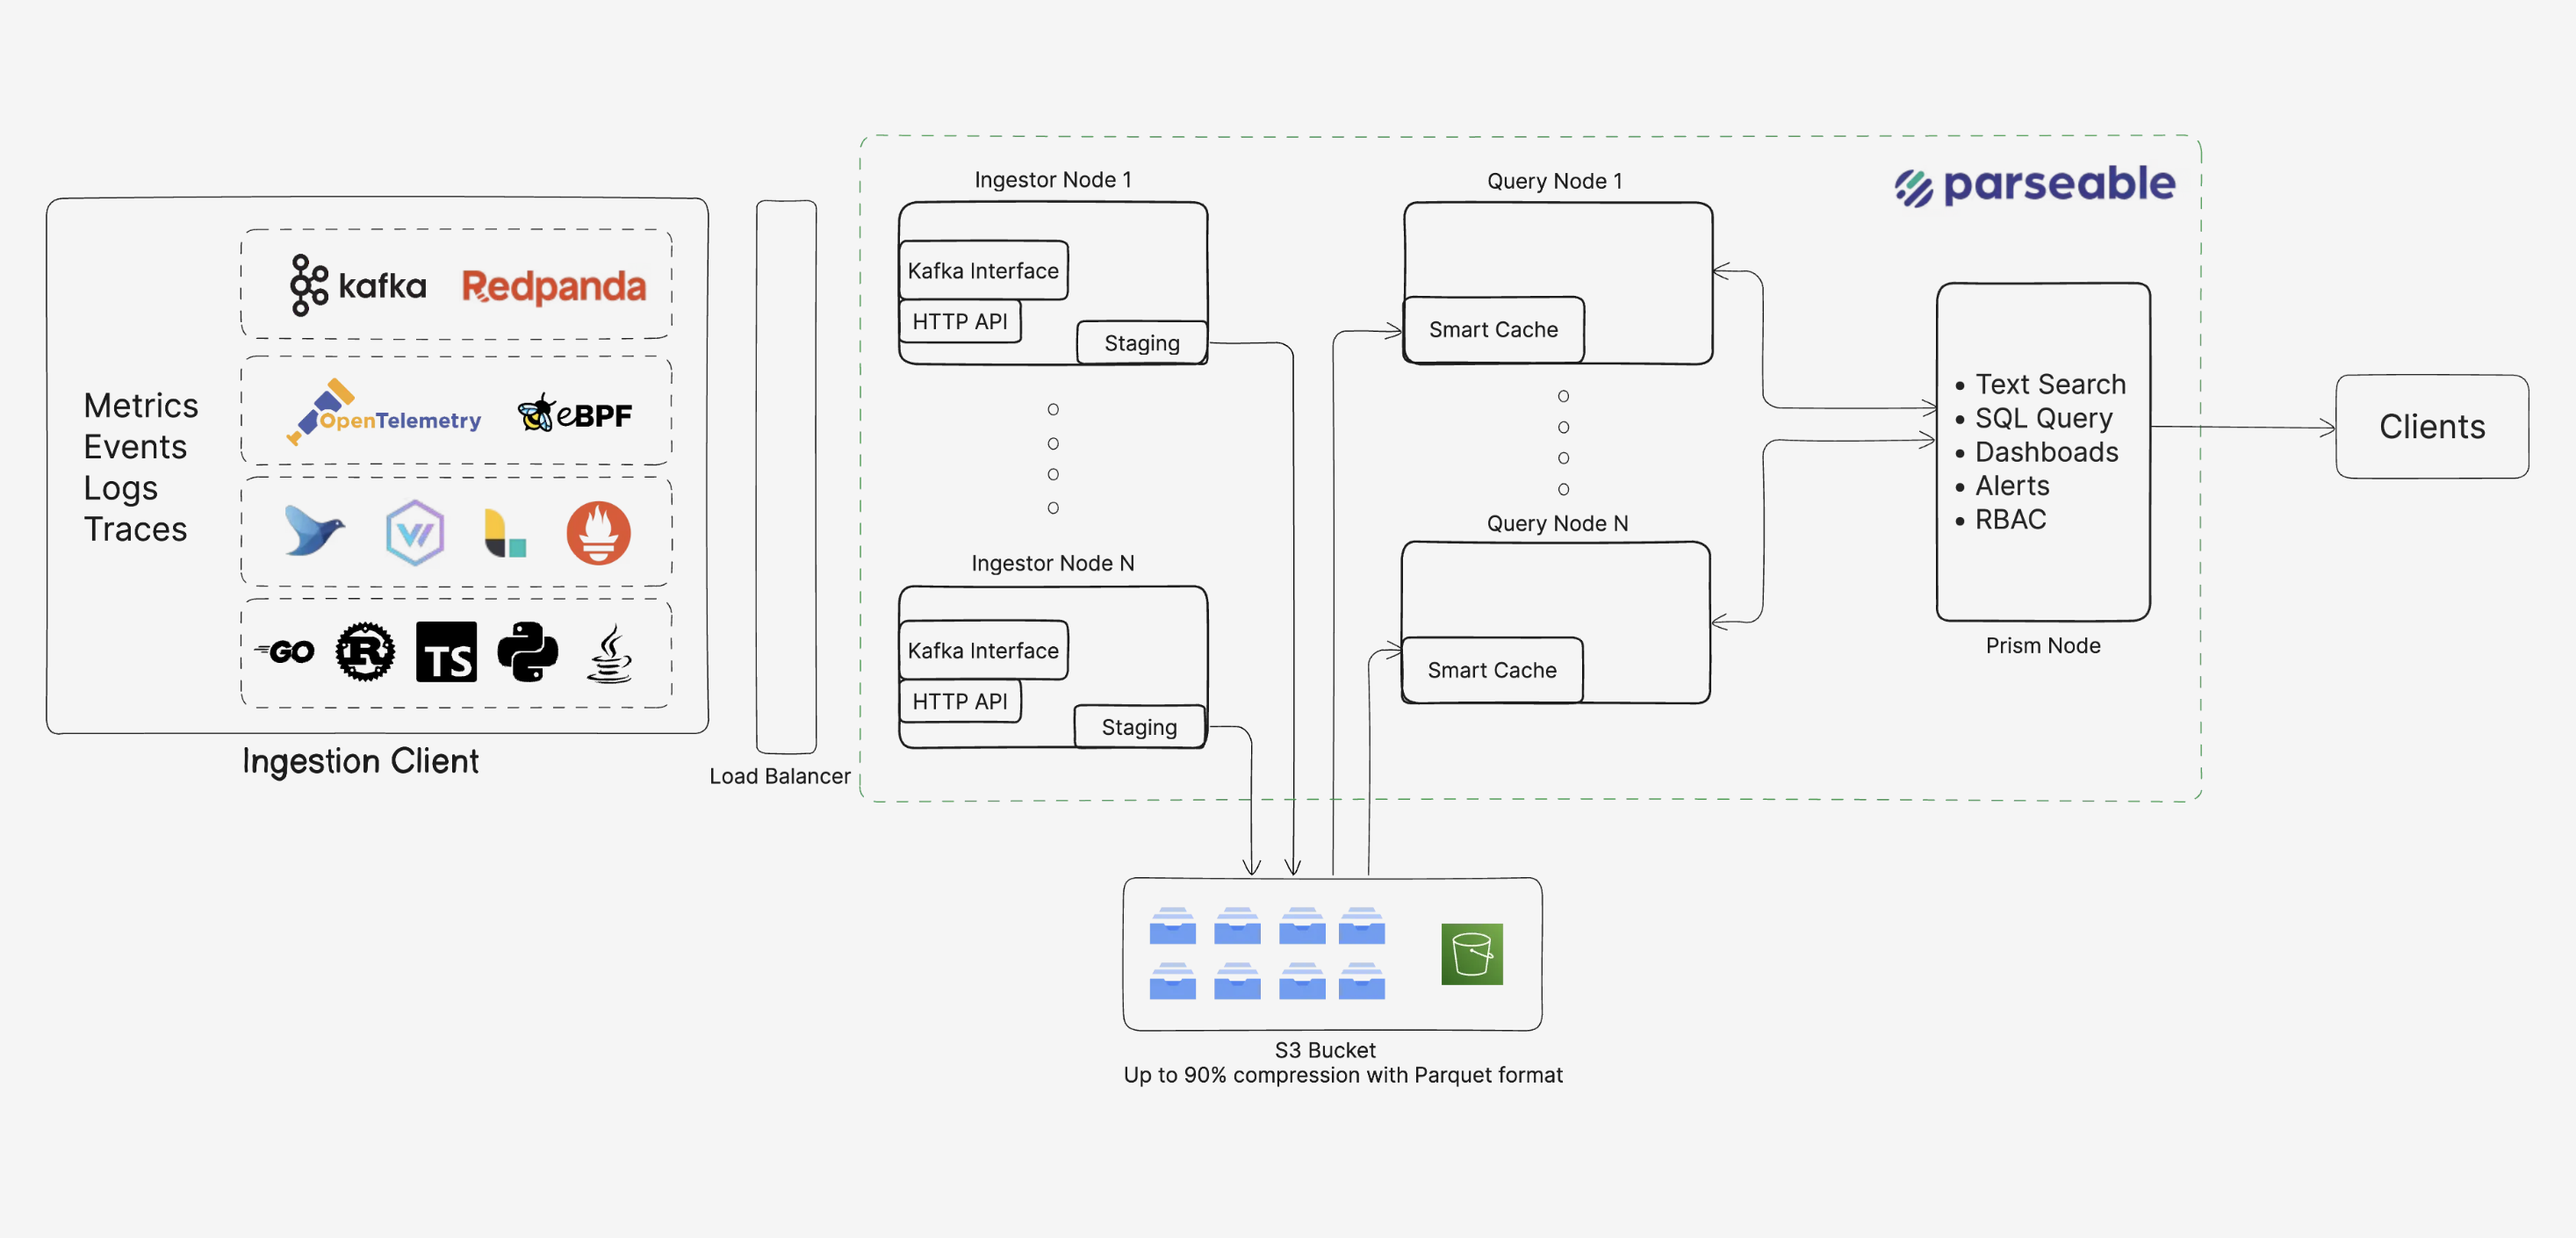
Parseable is written in Rust, built for speed, scale, and simplicity. It is available as a single binary or container that can be run almost anywhere - your laptop, Linux EC2 instance, a Kubernetes Cluster, or any other compute platform.
For a production grade Parseable deployment, the only dependency you need is an object store bucket. This can be anything from AWS S3, MinIO, Ceph, Azure Blobstore, GCS to something else that is S3 API compatible.
With this simple set up you have a full fledged observability platform running in your infrastructure within minutes.
With Parseable configured and running - you’re set to start ingesting data from applications.
Read more about Parseable design here
Go zero stack with Parseable
The next obvious question is how would Parseable behave for all these different types of telemetry signals. For example, how can you handle my very high cardinality metrics data generated from 100s of nodes or how can you handle text heavy log data
From a technical architecture perspective, let’s look at specific signals and understand how Parseable design ensures the best outcome:
Text heavy logs
Logs contain substantial text, but their analytical access patterns make columnar formats like Parquet highly effective. Log analysis rarely involves reading entire log entries; instead, teams typically filter by specific fields (timestamp, service, error code), aggregate metrics (error rates, response times), or search for patterns within structured fields.
Parseable design optimizes for these query patterns by storing each field separately, enabling efficient compression of repetitive values common in logs (service names, log levels, status codes) and allowing queries to read only relevant columns.
Text fields benefit from dictionary encoding and compression algorithms that exploit the repetitive nature of log messages, often achieving 80-90% compression.
Additionally, we’re able to pushdown predicates and prune columns, dramatically reducing I/O when filtering large log volumes by timestamp ranges or specific services. The result is significantly faster query performance for typical observability workloads, even when dealing with unstructured text content within the structured log schema.
High cardinality metrics
Traditionally time-series engines rely on inverted indexes and store data row-wise along timelines. Columnar formats like Parquet on the other hand store data by columns, enabling highly selective scans and predicate pushdowns.
This storage model inherently sidesteps many of the scaling issues caused by high cardinality, because data in a high-cardinality column is physically isolated from others, the cardinality of one field doesn’t balloon memory usage or index size. In our experience, column-level compression and efficient on-disk scans allow a better approach instead of maintaining in-memory indexes.
Read more on metrics in Parseable here
Traces data
High-granularity trace data while allowing fast, flexible queries is the core of tracing. Columnar formats like Apache Parquet shine in this context: they store each field (column) separately, making scans and filtering much faster than row-by-row storage. In Parquet, a query that filters on a span attribute (e.g. service name) can scan only the service column, skipping all other fields entirely. This reduces I/O and accelerates span queries.
While Parquet provides the core framework for efficient and compressed storage. Parseable combines it with efficient metadata management, smart caching, Rust based cloud native design to bring a high performance observability system.
Read more in our detailed post here
Conclusion
Modern distributed systems demand observability architectures that match their complexity and scale. As telemetry volumes grow and system inter dependencies multiply, observability stacks create more problems than they solve.
- Operational overhead scales linearly with the number of tools.
- Correlation becomes increasingly difficult.
- Costs spiral without proportional value.
Zero stack architecture represents a fundamental shift from specialized tool proliferation to unified platform consolidation. By applying proven big data principles - columnar storage, efficient compression, and unified query interfaces - to telemetry data, organizations can achieve better performance, lower operational complexity, and more comprehensive insights than fragmented architectures allow.
Zero stack is essentially about architectural alignment with how modern systems actually fail and how teams actually troubleshoot. For organizations generating substantial observability data, zero stack architecture offers a path to sustainable, scalable observability that grows with system complexity rather than being constrained by it.