

Introduction
In this guide, we'll set up OpenTelemetry Collector to automatically collect logs from all Kubernetes pods and ship them to Parseable. The setup includes automatic extraction of Kubernetes metadata like namespace, pod name, and container name, making your logs instantly queryable, searchable and filterable.
Architecture Overview
The solution uses a DaemonSet deployment pattern:
┌─────────────────────────────────────────────────────────────┐
│                     Kubernetes Cluster                       │
│                                                              │
│  ┌──────────┐  ┌──────────┐  ┌──────────┐                   │
│  │  Pod A   │  │  Pod B   │  │  Pod C   │                   │
│  │  (app)   │  │  (api)   │  │  (worker)│                   │
│  └────┬─────┘  └────┬─────┘  └────┬─────┘                   │
│       │             │             │                          │
│       ▼             ▼             ▼                          │
│  ┌─────────────────────────────────────┐                    │
│  │         /var/log/pods/*             │                    │
│  │      (Container Runtime Logs)        │                    │
│  └─────────────────┬───────────────────┘                    │
│                    │                                         │
│                    ▼                                         │
│  ┌─────────────────────────────────────┐                    │
│  │   OpenTelemetry Collector DaemonSet │                    │
│  │   (runs on every node)              │                    │
│  └─────────────────┬───────────────────┘                    │
│                    │                                         │
└────────────────────┼────────────────────────────────────────┘
                     │ OTLP/HTTP
                     ▼
            ┌─────────────────┐
            │    Parseable    │
            │  (Log Storage)  │
            └─────────────────┘
Each node runs an OTel Collector instance that:
- Reads logs from
/var/log/pods - Parses CRI (Container Runtime Interface) log format
- Extracts Kubernetes metadata from file paths
- Ships logs to Parseable via OTLP/HTTP
Prerequisites
Before you begin, ensure you have:
- A running Kubernetes cluster (GKE, EKS, AKS, or self-managed)
kubectlconfigured to access your cluster- A Parseable instance accessible from the cluster. You will need:
- Parseable host URL
- A log stream created in Parseable to receive Kubernetes logs
- Basic auth credentials (username and password) for Parseable
You can create a Parseable account on https://telemetry.new/ if you don't have one.
Configure OpenTelemetry Collector for Kubernetes logs
Create a ServiceAccount and configure RBAC
The OTel Collector needs permissions to access Kubernetes resources for metadata enrichment. So we'll create a ServiceAccount, ClusterRole, and ClusterRoleBinding. This allows the collector to read pod and node information.
apiVersion: v1
kind: ServiceAccount
metadata:
  name: otel-collector
  namespace: default
---
apiVersion: rbac.authorization.k8s.io/v1
kind: ClusterRole
metadata:
  name: otel-collector-role
rules:
- apiGroups: [""]
  resources:
  - nodes
  - nodes/metrics
  - nodes/proxy
  - services
  - endpoints
  - pods
  verbs: ["get", "list", "watch"]
- apiGroups: [""]
  resources:
  - configmaps
  verbs: ["get"]
---
apiVersion: rbac.authorization.k8s.io/v1
kind: ClusterRoleBinding
metadata:
  name: otel-collector-binding
roleRef:
  apiGroup: rbac.authorization.k8s.io
  kind: ClusterRole
  name: otel-collector-role
subjects:
- kind: ServiceAccount
  name: otel-collector
  namespace: default
Save the above YAML into a file named otel-collector-rbac.yaml and apply it:
kubectl apply -f otel-collector-rbac.yamlOTel Collector configuration
Next step is to create a ConfigMap with the collector configuration. This is where the magic happens, i.e. reading logs, parsing them, extracting metadata, and exporting to Parseable.
apiVersion: v1
kind: ConfigMap
metadata:
  name: otel-collector-conf
  namespace: default
data:
  otel-collector-config.yaml: |
    receivers:
      filelog/pods:
        include:
          - /var/log/pods/*/*/*.log
        exclude:
          - /var/log/pods/*/otel-collector/*.log
        start_at: end
        include_file_path: true
        include_file_name: false
        operators:
          # Extract metadata from log file path
          - type: regex_parser
            id: extract_metadata_from_filepath
            regex: '^/var/log/pods/(?P<namespace>[^_]+)_(?P<pod_name>[^_]+)_(?P<uid>[^/]+)/(?P<container_name>[^/]+)/.*\.log$'
            parse_from: attributes["log.file.path"]

          # Parse CRI log format
          - type: regex_parser
            id: parser-cri
            on_error: send
            regex: '^(?P<time>[^ ]+) (?P<stream>stdout|stderr) (?P<logtag>[^ ]*) ?(?P<log>.*)$'
            timestamp:
              parse_from: attributes.time
              layout: '%Y-%m-%dT%H:%M:%S.%LZ'

          # Move extracted fields to resource attributes
          - type: move
            from: attributes.namespace
            to: resource["k8s.namespace.name"]
          - type: move
            from: attributes.pod_name
            to: resource["k8s.pod.name"]
          - type: move
            from: attributes.container_name
            to: resource["k8s.container.name"]
          - type: move
            from: attributes.uid
            to: resource["k8s.pod.uid"]
          - type: move
            from: attributes.log
            to: body

    processors:
      batch:
        send_batch_size: 10
        send_batch_max_size: 100
        timeout: 5s

      resource:
        attributes:
          - key: cluster
            value: "my-kubernetes-cluster"
            action: insert

    exporters:
      otlphttp/parseablelogs:
        logs_endpoint: "http://<PARSEABLE_INGESTION_ENDPOINT>/v1/logs"
        encoding: json
        compression: gzip
        tls:
          insecure: true
        headers:
          Authorization: "Basic <BASE64_CREDENTIALS>"
          X-P-Stream: "kubernetes-logs"
          X-P-Log-Source: "otel-logs"
          Content-Type: "application/json"

    service:
      telemetry:
        logs:
          level: info
      pipelines:
        logs/pods:
          receivers: [filelog/pods]
          processors: [resource, batch]
          exporters: [otlphttp/parseablelogs]
Let's break down the key components:
Receivers
The filelog receiver reads log files from the filesystem. Kubernetes stores container logs at /var/log/pods/<namespace>_<pod-name>_<pod-uid>/<container-name>/<restart-count>.log.
include:
  - /var/log/pods/*/*/*.log
exclude:
  - /var/log/pods/*/otel-collector/*.log
We include all pod logs but exclude the collector's own logs to prevent infinite loops.
Operators
The operators form a processing pipeline that transforms raw log lines into structured data:
- Extract Metadata from Path: The file path contains namespace, pod name, UID, and container name. We extract these using regex:
regex: '^/var/log/pods/(?P<namespace>[^_]+)_(?P<pod_name>[^_]+)_(?P<uid>[^/]+)/(?P<container_name>[^/]+)/.*\.log$'- Parse CRI Format: Kubernetes uses CRI log format:
<timestamp> <stream> <tag> <message>. For example:
2025-12-17T21:28:56.443Z stdout F Published status for workspace: running- Move to Resource Attributes: We move the extracted fields to standard OpenTelemetry resource attributes (
k8s.namespace.name,k8s.pod.name, etc.).
Processors
batch: Groups logs for efficient transmissionresource: Adds cluster identifier to all logs
Exporters
The otlphttp exporter sends logs to Parseable's OTLP endpoint with required headers:
Authorization: Basic auth credentials (base64 encodedusername:password)X-P-Stream: Target log stream in ParseableX-P-Log-Source: Identifies the log source type
Make sure to update the <PARSEABLE_INGESTION_ENDPOINT> and <BASE64_CREDENTIALS> placeholders with your actual Parseable endpoint and base64-encoded credentials. Then save the above YAML into a file named otel-collector-configmap.yaml and apply it:
kubectl apply -f otel-collector-configmap.yamlDeploy the OTel Collector DaemonSet
The DaemonSet is used to ensure the collector runs on every node.
apiVersion: apps/v1
kind: DaemonSet
metadata:
  name: otel-collector
  namespace: default
spec:
  selector:
    matchLabels:
      app: otel-collector
  template:
    metadata:
      labels:
        app: otel-collector
    spec:
      serviceAccountName: otel-collector
      tolerations:
        - operator: Exists
      containers:
        - name: otel-collector
          image: otel/opentelemetry-collector-contrib:0.103.0
          args:
            - "--config=/etc/otel/otel-collector-config.yaml"
          env:
            - name: NODE_NAME
              valueFrom:
                fieldRef:
                  fieldPath: spec.nodeName
            - name: HOST_IP
              valueFrom:
                fieldRef:
                  fieldPath: status.hostIP
          resources:
            requests:
              cpu: 100m
              memory: 128Mi
            limits:
              cpu: 500m
              memory: 512Mi
          volumeMounts:
            - name: otel-collector-config
              mountPath: /etc/otel
            - name: varlogpods
              mountPath: /var/log/pods
              readOnly: true
            - name: varlibdockercontainers
              mountPath: /var/lib/docker/containers
              readOnly: true
      volumes:
        - name: otel-collector-config
          configMap:
            name: otel-collector-conf
        - name: varlogpods
          hostPath:
            path: /var/log/pods
        - name: varlibdockercontainers
          hostPath:
            path: /var/lib/docker/containers
Key points:
- tolerations:
operator: Existsallows the collector to run on all nodes, including control plane nodes - Volume mounts: We mount
/var/log/podsto access container logs - Resource limits: Start conservative and adjust based on log volume
Save all the YAML above into a single file otel-collector.yaml and apply:
kubectl apply -f otel-collector.yamlVerify the deployment:
# Check collector pods (one per node)
kubectl get pods -l app=otel-collector

# Check logs for any errors
kubectl logs -l app=otel-collector --tail=50
Verify logs in Parseable
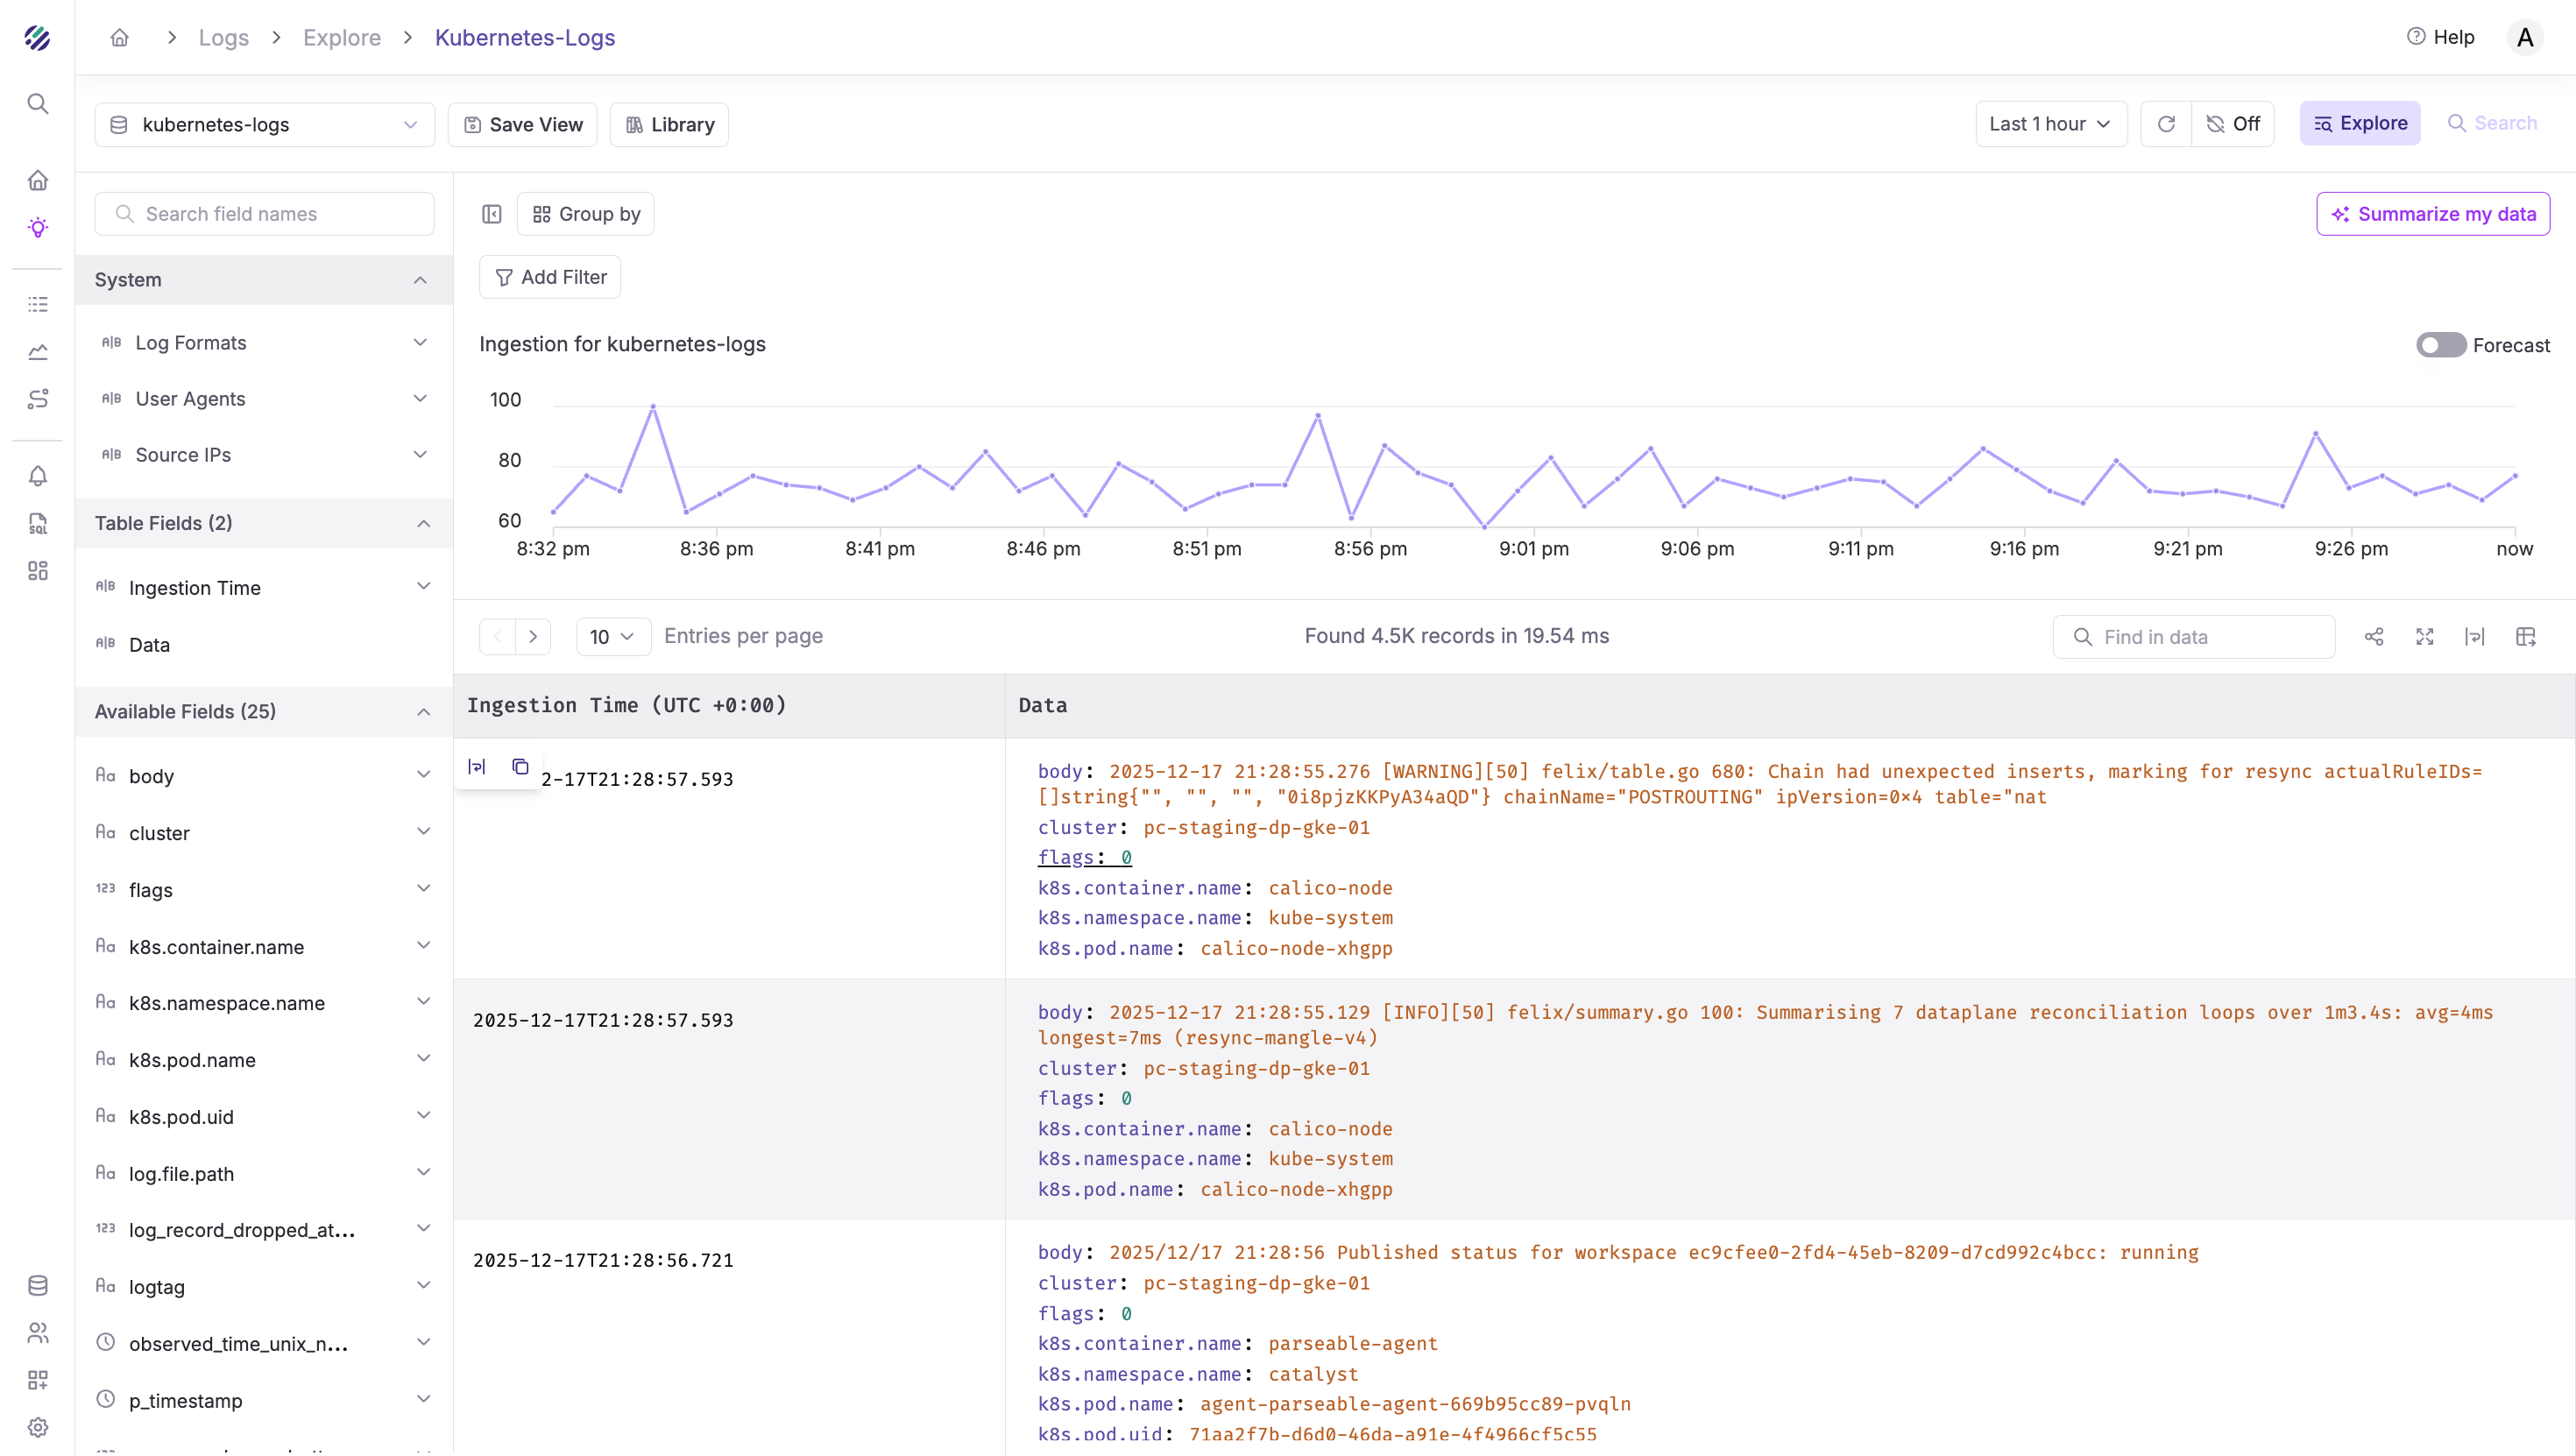
Once deployed, logs should start flowing to Parseable within seconds. Log in to your Parseable instance, navigate to the log stream you specified in the X-P-Stream header (e.g., kubernetes-logs), and you should see incoming logs with rich Kubernetes metadata.
Querying Kubernetes Logs in Parseable
With the metadata extracted, you can run powerful SQL queries. Select your time range in the Parseable UI, then run these queries:
View recent logs from a namespace:
SELECT * FROM "kubernetes-logs"
WHERE "k8s.namespace.name" = 'catalyst'
ORDER BY p_timestamp DESC
LIMIT 100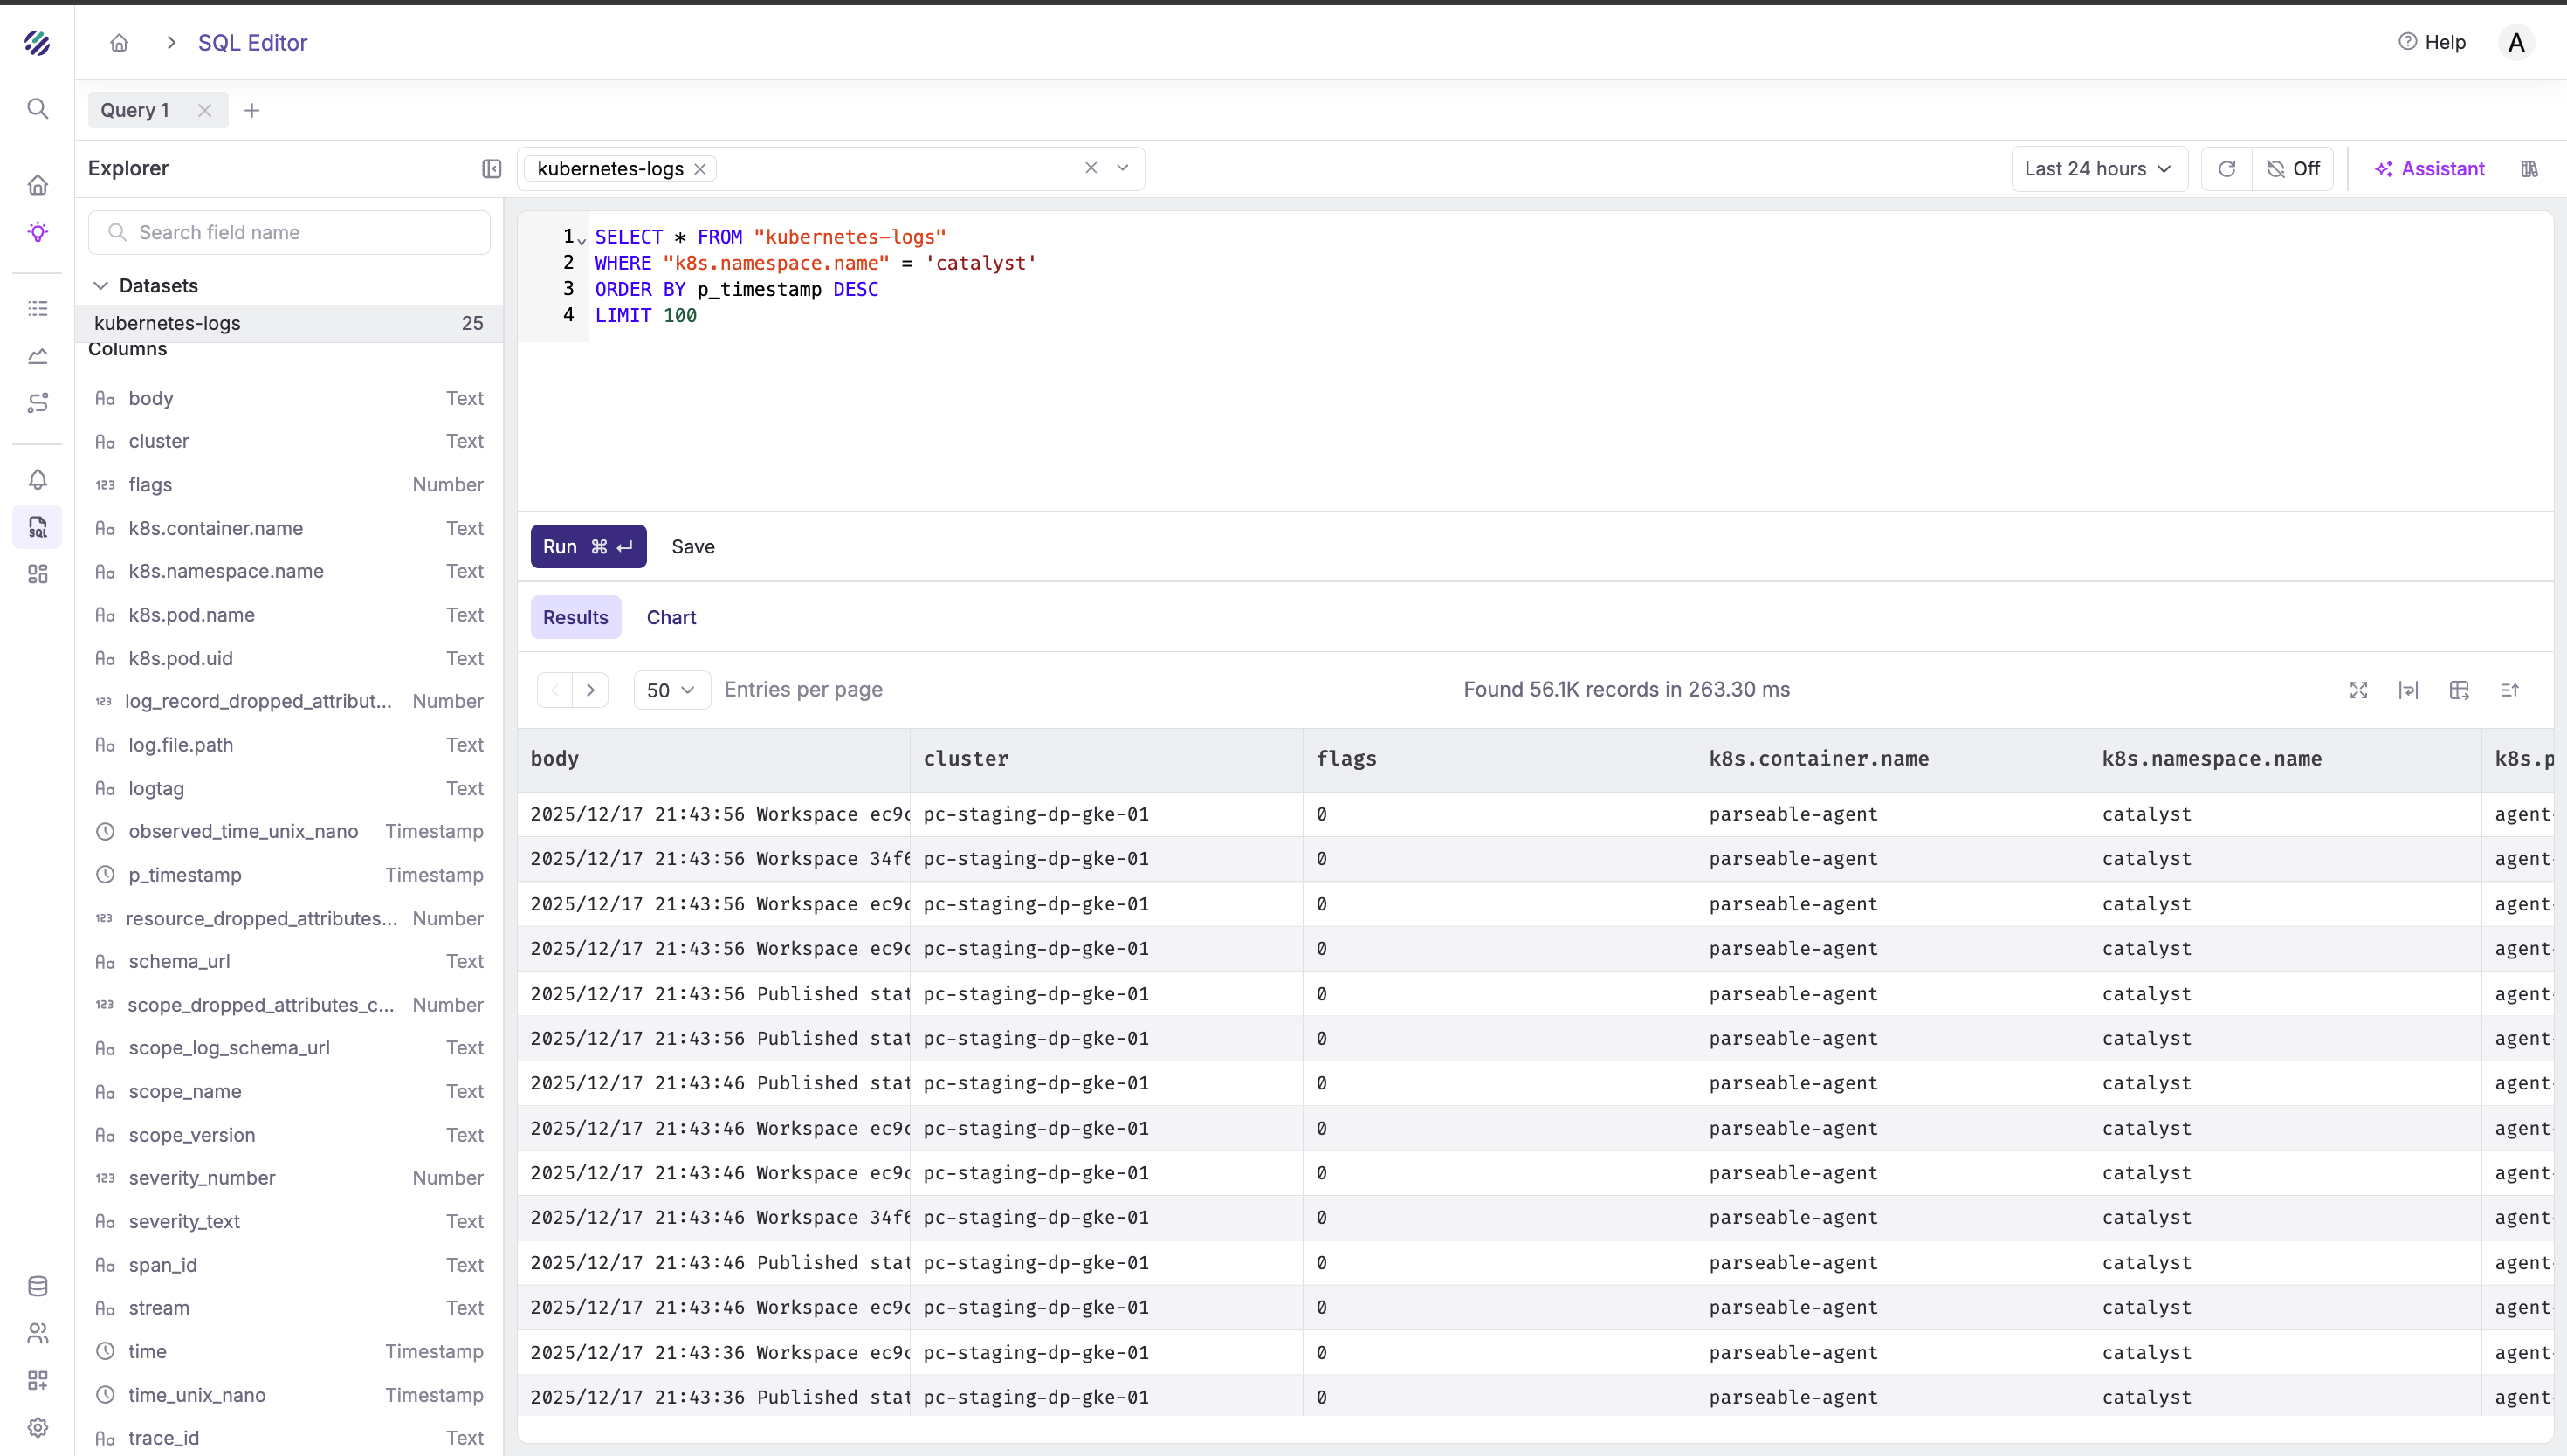
Find errors in logs:
SELECT
  "k8s.pod.name",
  "k8s.container.name",
  body,
  p_timestamp
FROM "kubernetes-logs"
WHERE body LIKE '%error%' OR body LIKE '%Error%' OR body LIKE '%ERROR%'
ORDER BY p_timestamp DESC
LIMIT 100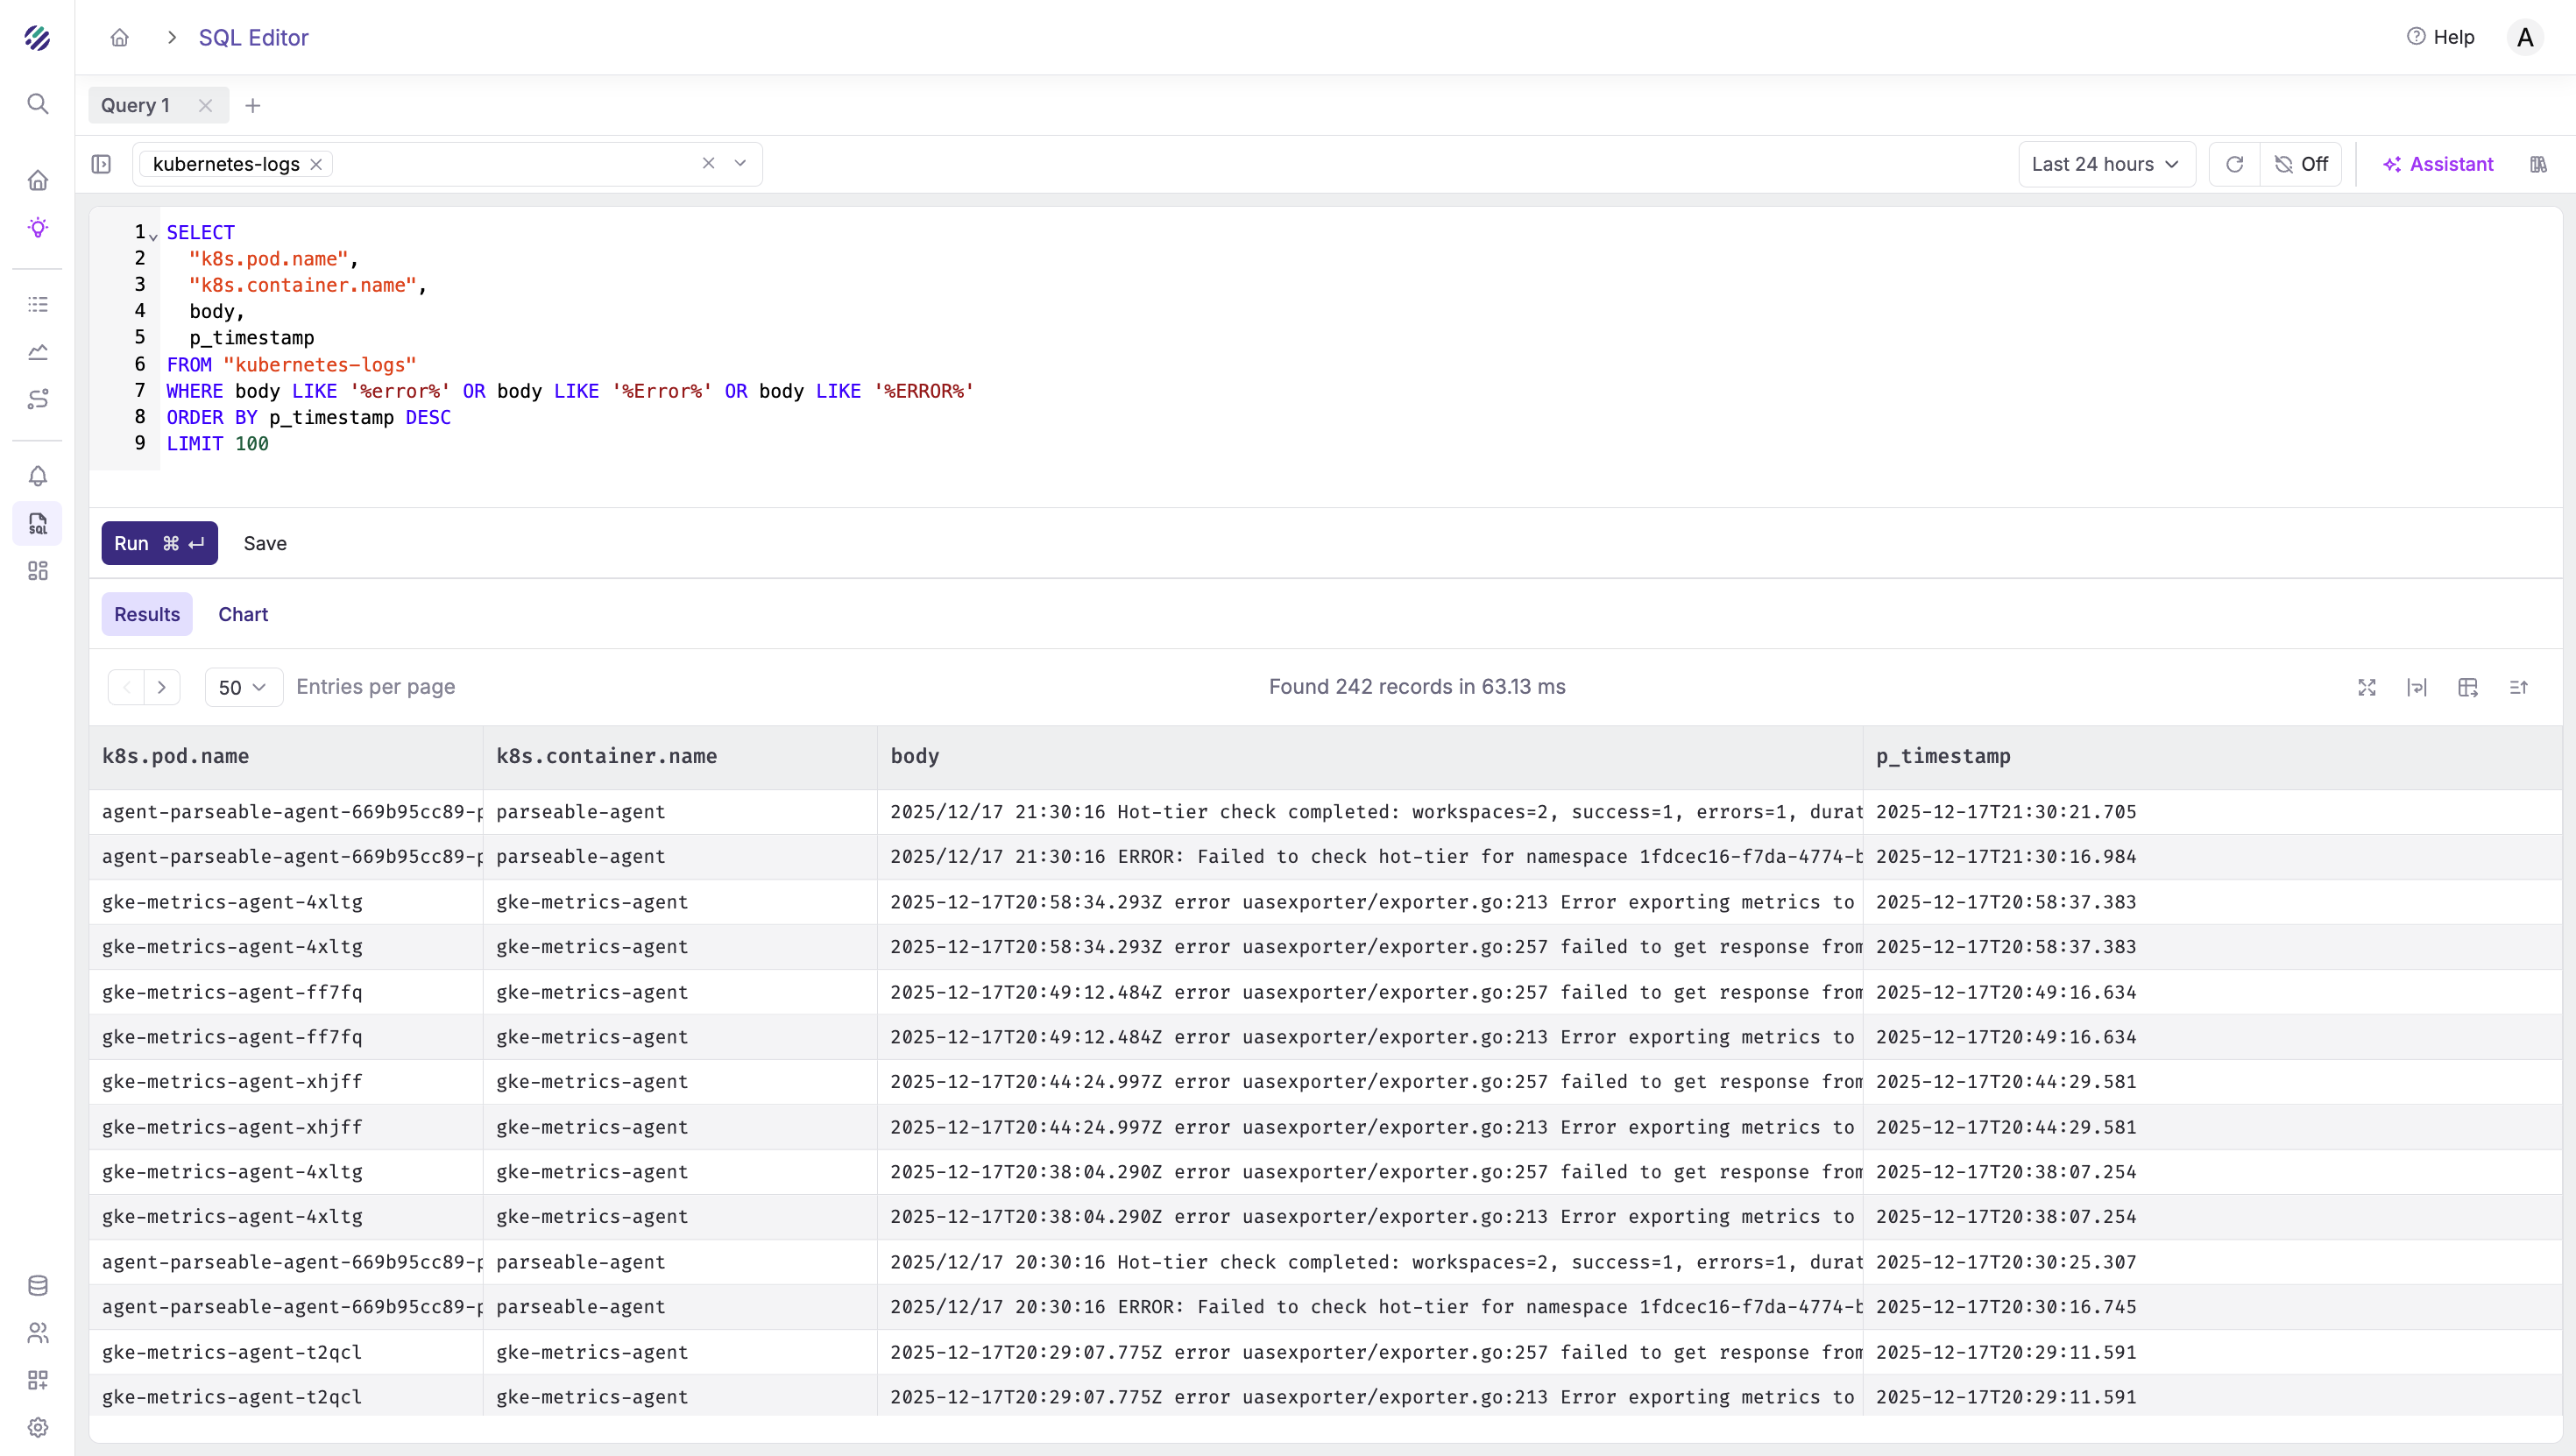
Filter by stderr stream:
SELECT
  "k8s.namespace.name",
  "k8s.pod.name",
  body,
  p_timestamp
FROM "kubernetes-logs"
WHERE stream = 'stderr'
ORDER BY p_timestamp DESC
LIMIT 100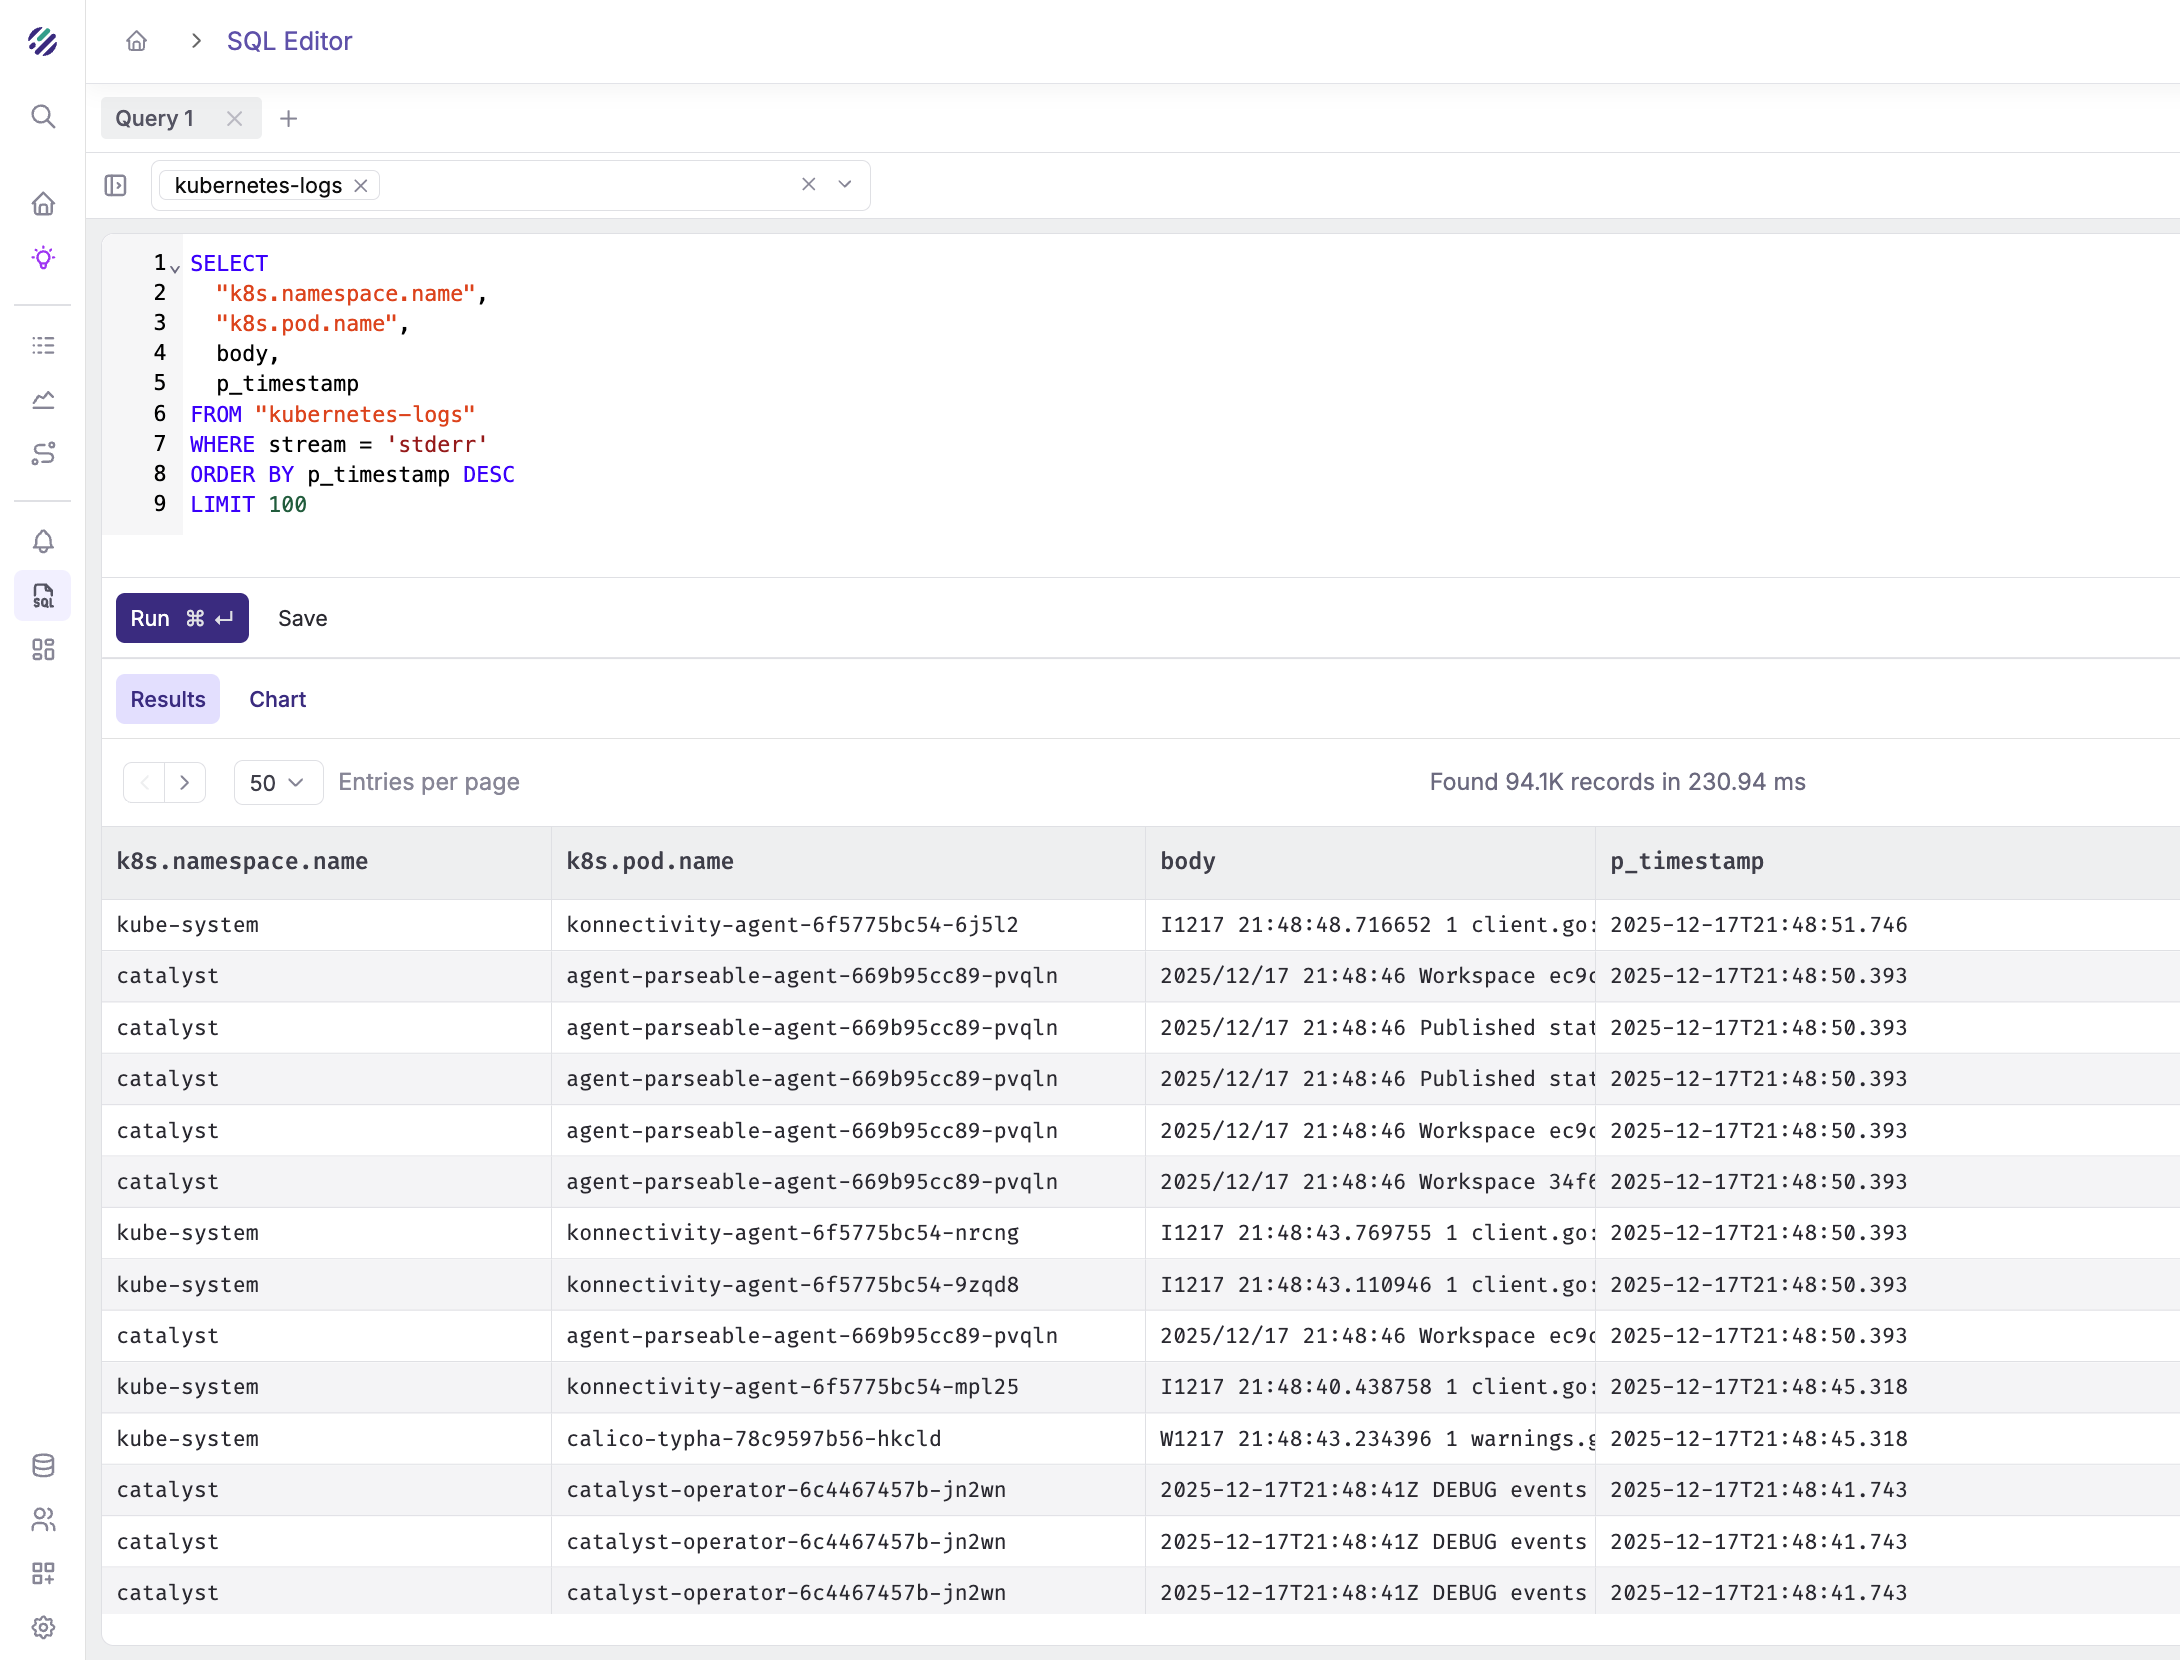
Count logs by pod:
SELECT
  "k8s.namespace.name",
  "k8s.pod.name",
  COUNT(*) as log_count
FROM "kubernetes-logs"
GROUP BY "k8s.namespace.name", "k8s.pod.name"
ORDER BY log_count DESC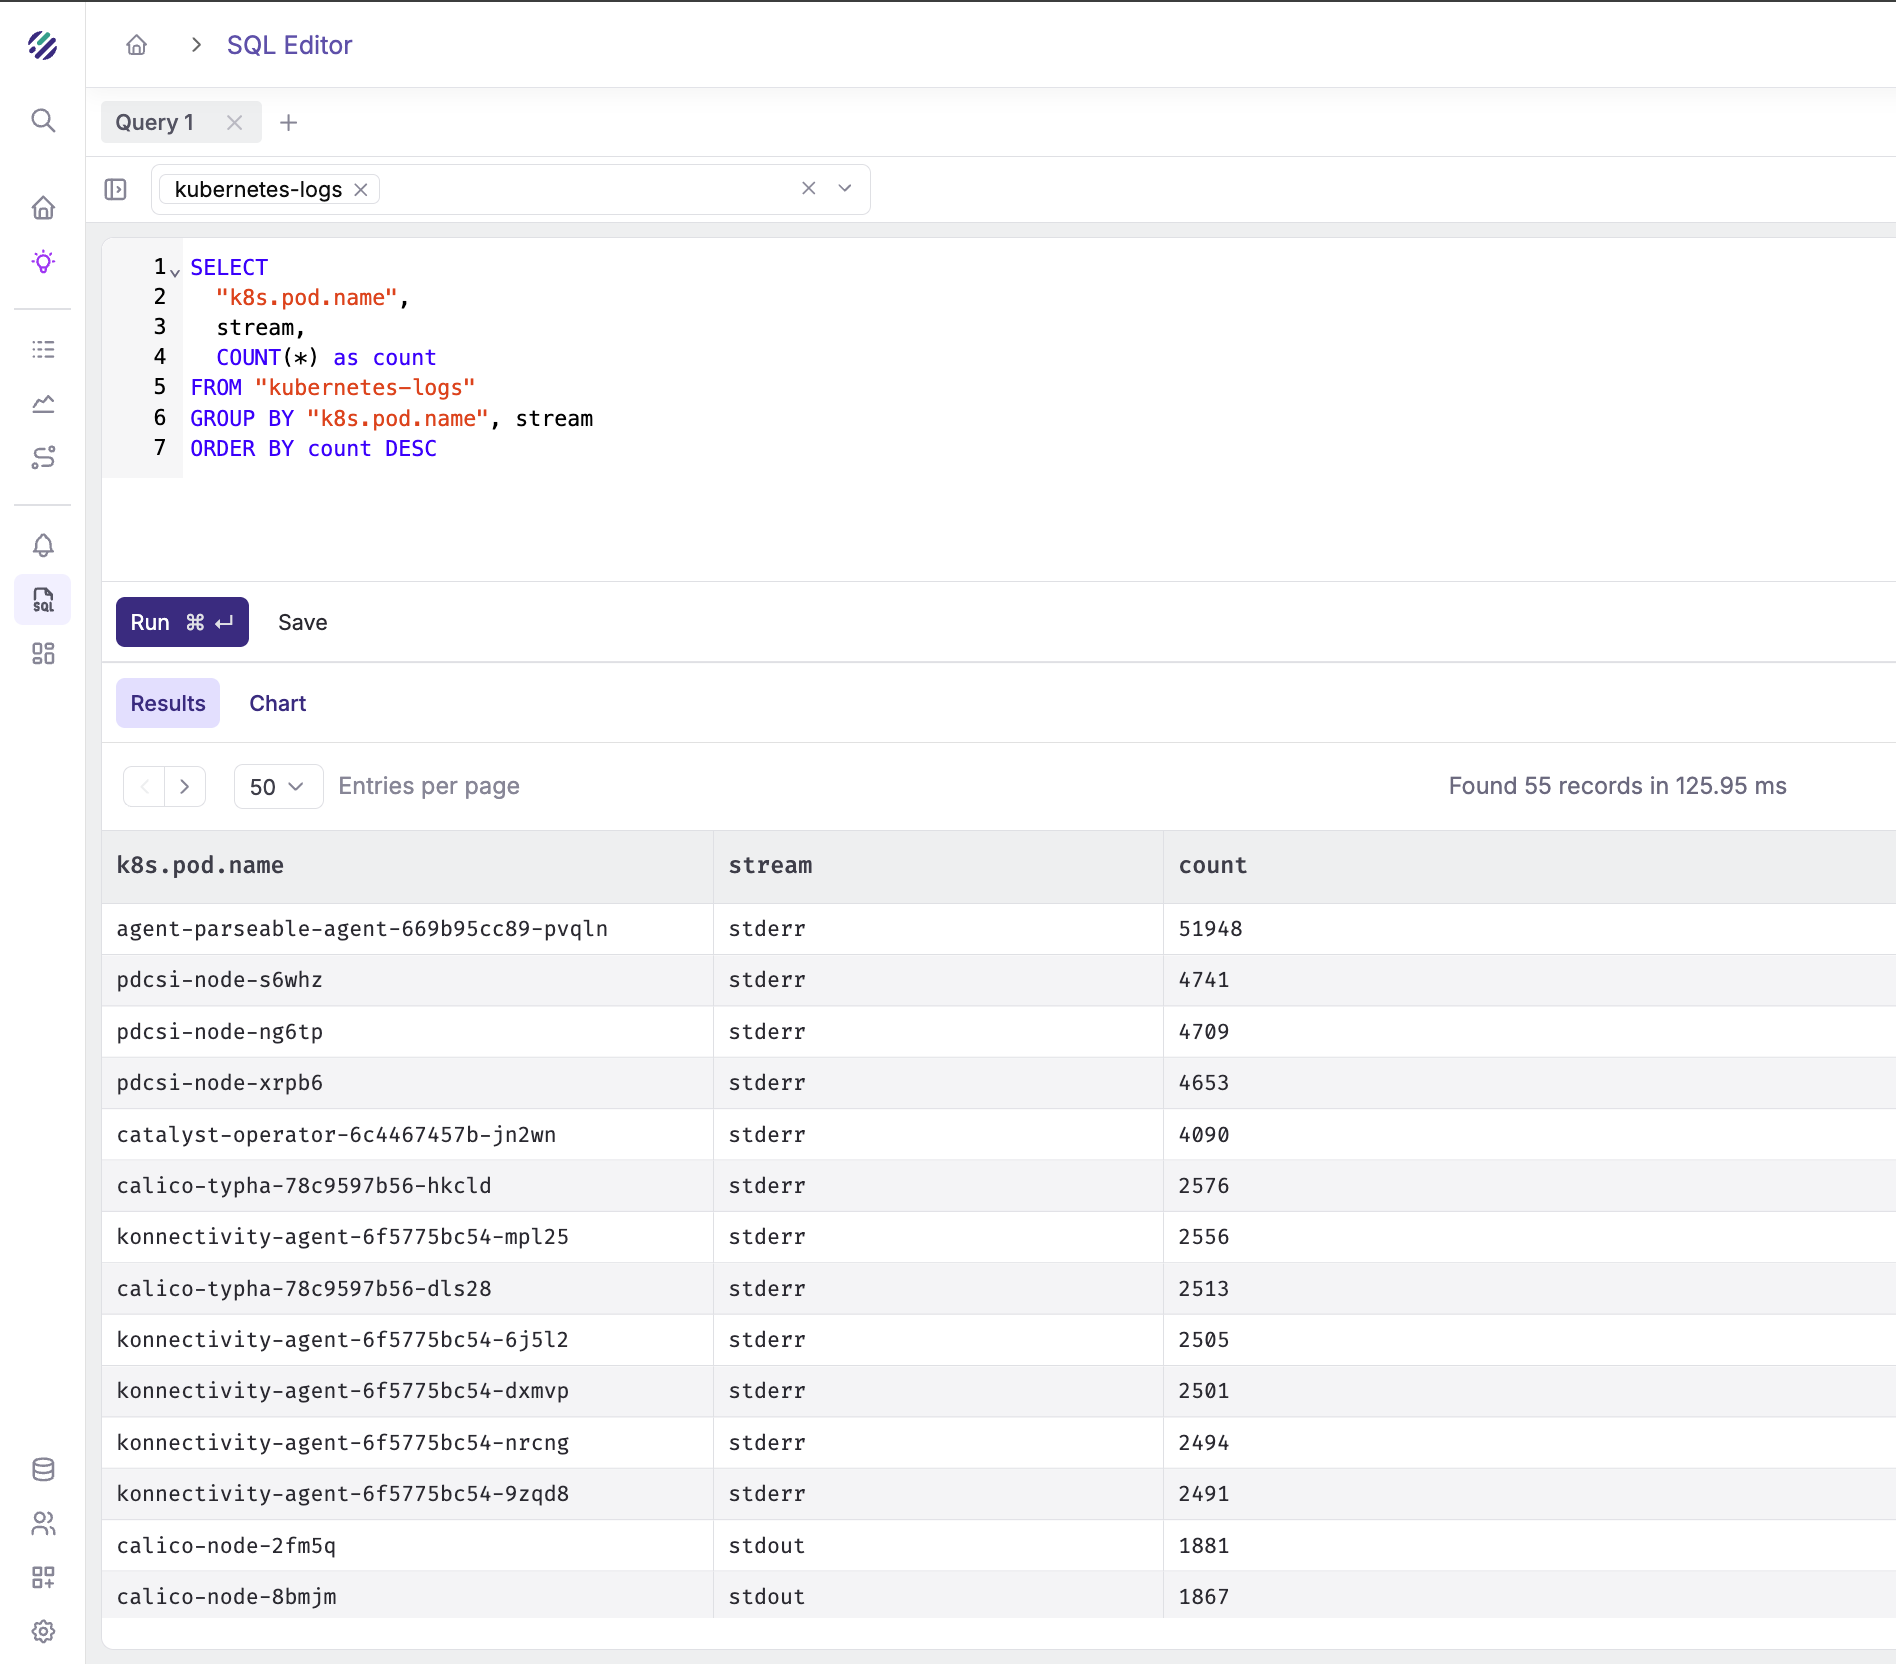
Count stderr vs stdout by pod:
SELECT
  "k8s.pod.name",
  stream,
  COUNT(*) as count
FROM "kubernetes-logs"
GROUP BY "k8s.pod.name", stream
ORDER BY count DESC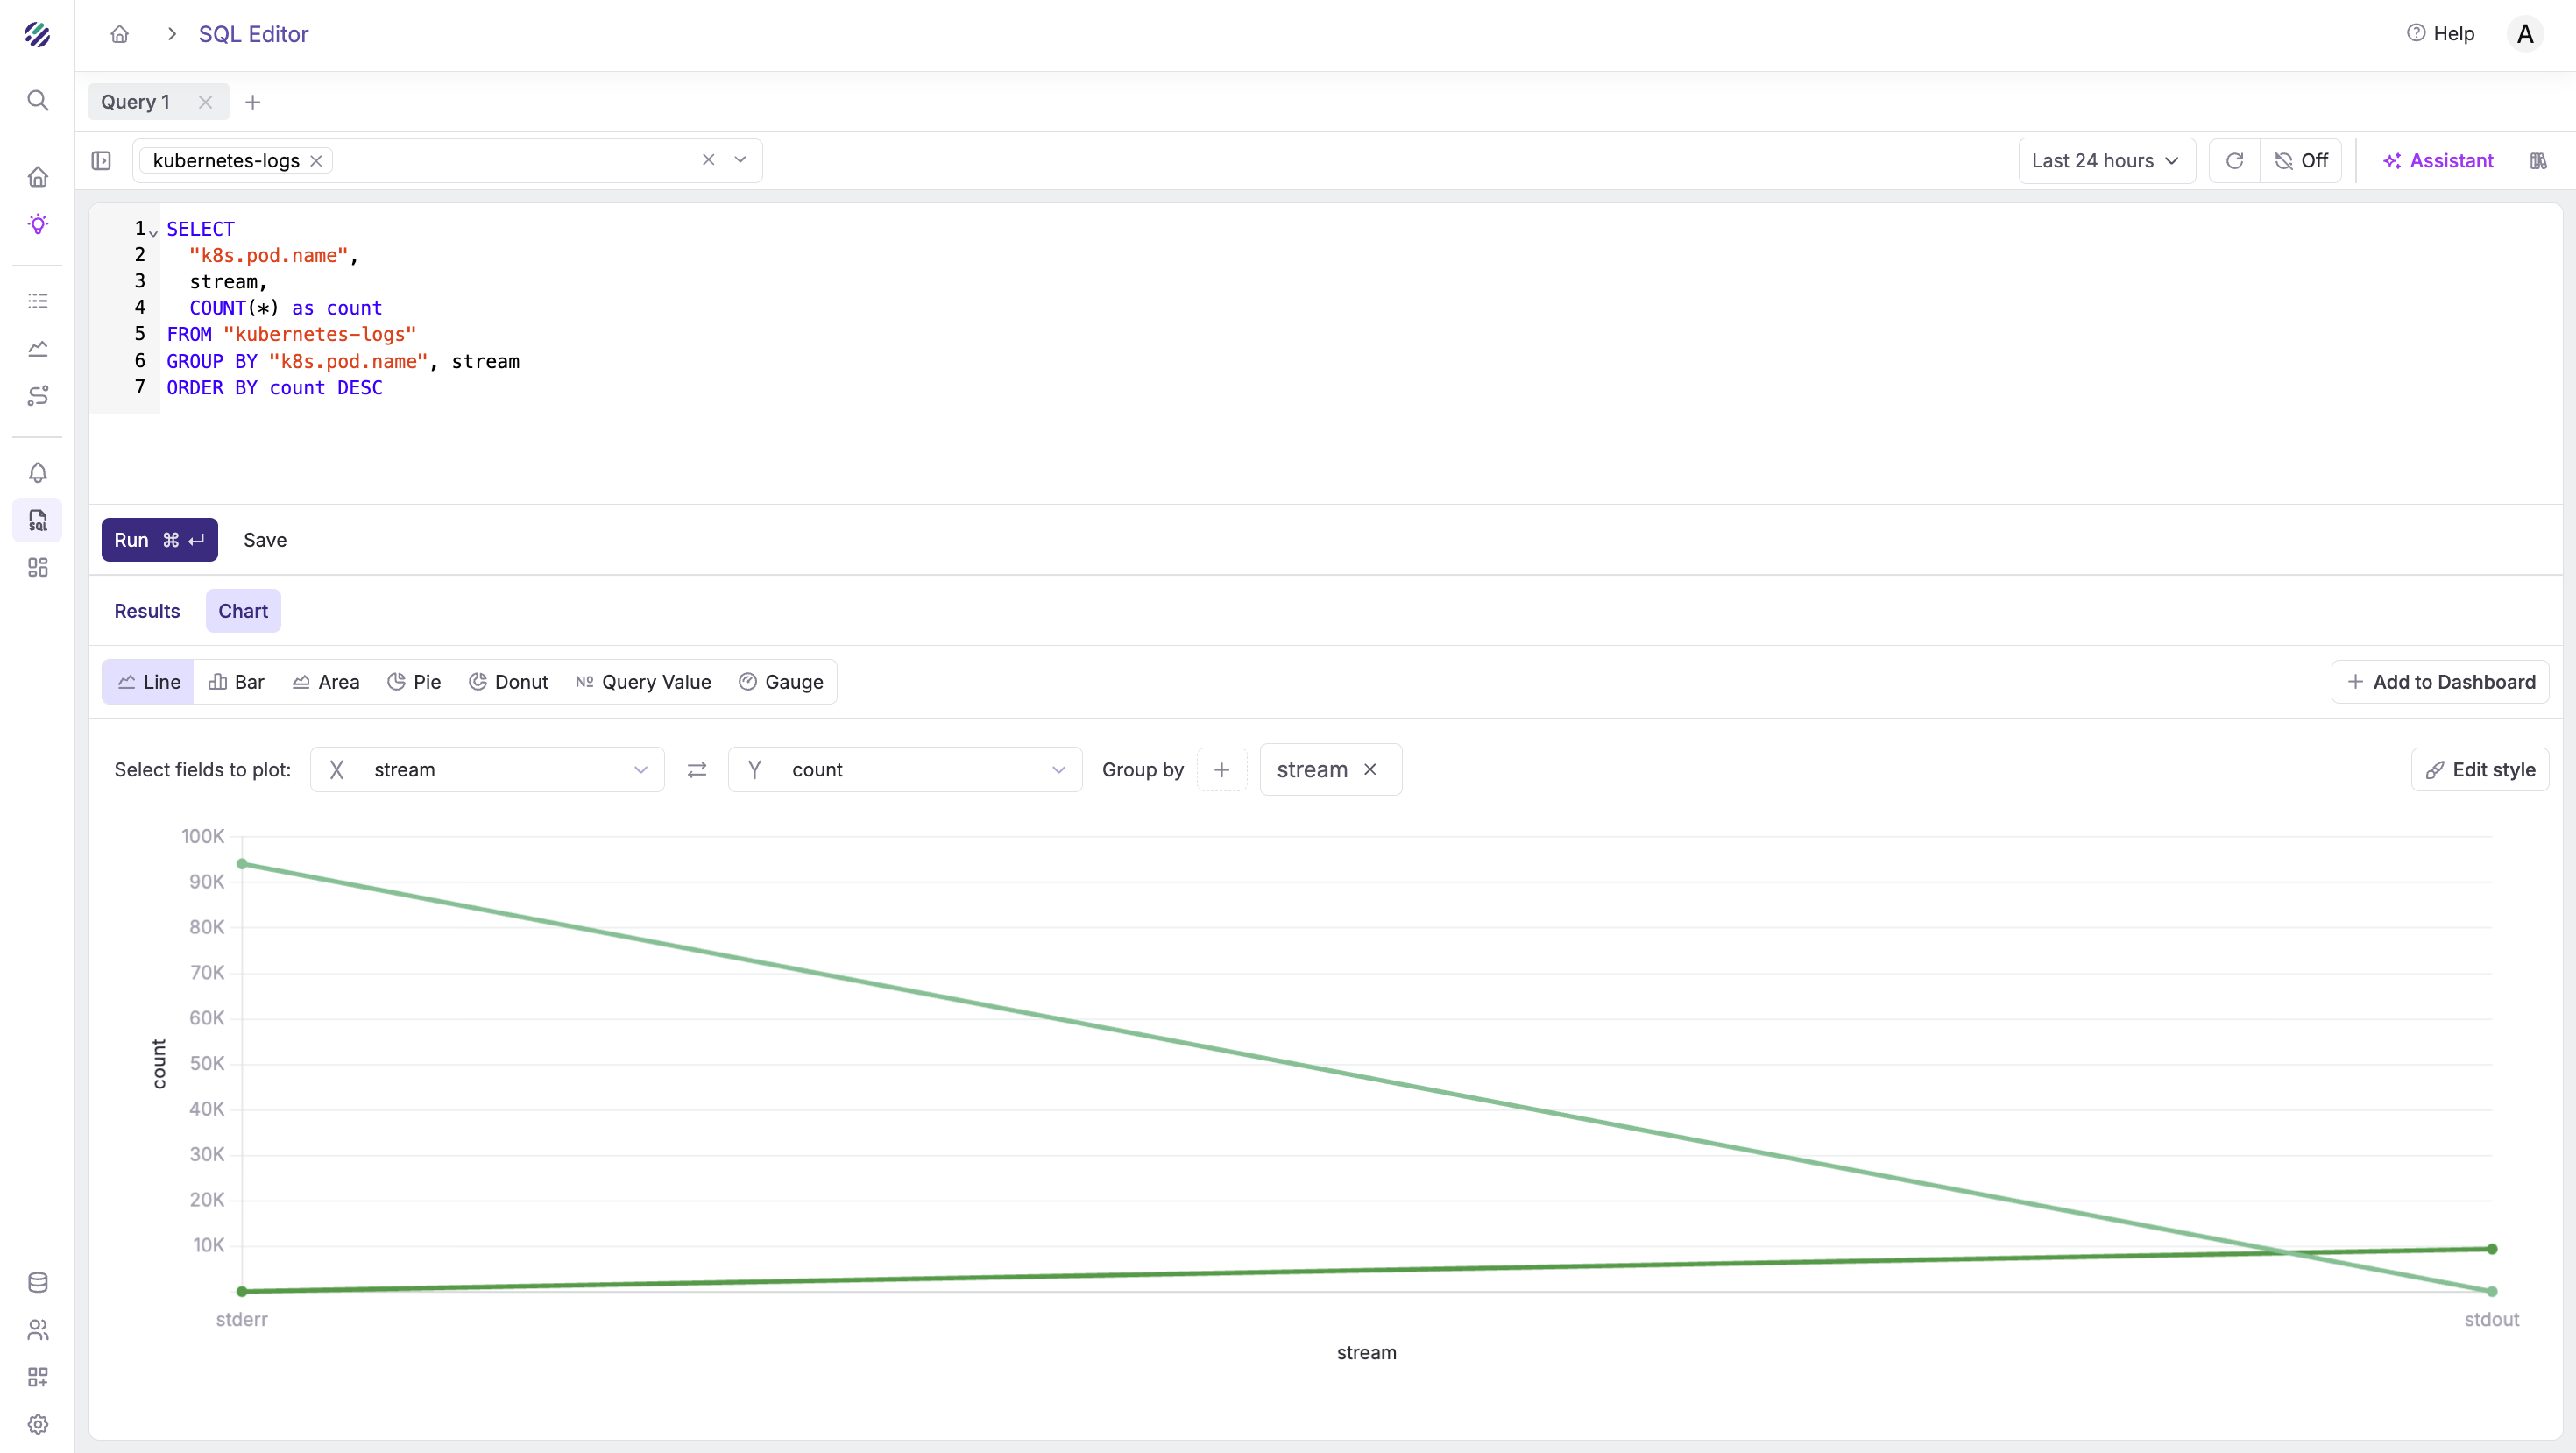
Search logs by container name:
SELECT
  "k8s.namespace.name",
  "k8s.pod.name",
  body,
  p_timestamp
FROM "kubernetes-logs"
WHERE "k8s.container.name" = 'parseable-agent'
ORDER BY p_timestamp DESC
LIMIT 50
Get log volume by namespace:
SELECT
  "k8s.namespace.name",
  COUNT(*) as log_count
FROM "kubernetes-logs"
GROUP BY "k8s.namespace.name"
ORDER BY log_count DESC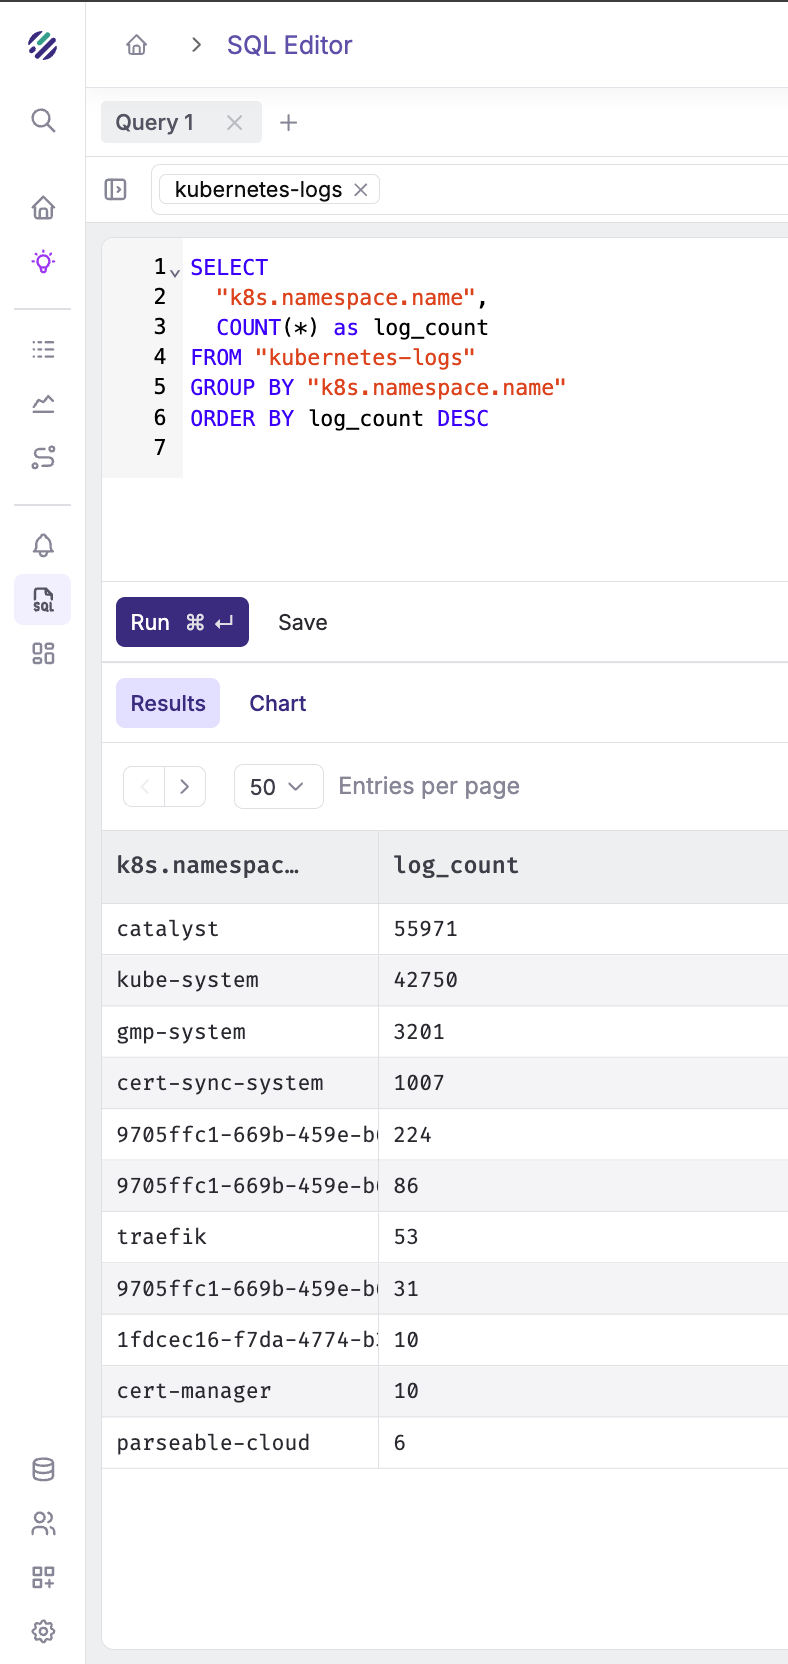
Search for specific text in logs:
SELECT
  "k8s.pod.name",
  "k8s.container.name",
  body,
  p_timestamp
FROM "kubernetes-logs"
WHERE body LIKE '%workspace%'
ORDER BY p_timestamp DESC
LIMIT 100
Customizing for your environment
Change the Target Stream
Update the X-P-Stream header to route logs to different datasets. Note that datasets are a way to organize telemetry in Parseable. Read more on Data modelling in Parseable.
headers:
  X-P-Stream: "prod-kubernetes-logs"  # or staging, dev, etc.
Add Cluster Identifier
Update the resource processor to identify your cluster:
resource:
  attributes:
    - key: cluster
      value: "prod-gke-us-east1"
      action: insert
    - key: environment
      value: "production"
      action: insert
Filter Specific Namespaces
To collect logs only from specific namespaces, modify the include pattern:
include:
  - /var/log/pods/production_*/*/*.log
  - /var/log/pods/staging_*/*/*.log
Exclude Noisy Pods
Add more exclusions for noisy system pods:
exclude:
  - /var/log/pods/*/otel-collector/*.log
  - /var/log/pods/kube-system_*/*/*.log
  - /var/log/pods/*/istio-proxy/*.log
Troubleshooting
Collector pods not starting:
kubectl describe pod -l app=otel-collectorCheck for volume mount issues or resource constraints.
No logs appearing in Parseable:
- Check collector logs for export errors:
kubectl logs -l app=otel-collector | grep -i error- Verify network connectivity to Parseable:
kubectl exec -it <collector-pod> -- wget -O- http://<PARSEABLE_HOST>:8000/api/v1/liveness- Check authentication:
# Generate correct base64 credentials
echo -n "admin:admin" | base64
Missing metadata fields:
Ensure the log file path matches the expected format. Check a sample path:
kubectl exec -it <collector-pod> -- ls -la /var/log/pods/Conclusion
With OpenTelemetry Collector and Parseable, you now have a production-ready Kubernetes logging pipeline that:
- Automatically collects logs from all pods
- Extracts rich Kubernetes metadata
- Enables powerful SQL-based log analysis
- Scales horizontally with your cluster
The DaemonSet pattern ensures every node is covered, and the filelog receiver efficiently tails log files without missing entries.

