

Introduction
You gave your coding agent a simple task: "Refactor the authentication middleware to support JWTs."
It sounded easy. The agent acknowledged the prompt and started "thinking." Twenty minutes later, your API credits are drained, the PR contains broken code, and the agent is stuck in an infinite loop trying to grep a directory that doesn't exist.
AI agents are all autonomous systems capable of writing software, yet most teams still have to deal with AI agents as "text-in, text-out" black boxes. The problem stems from lack of a simple and efficient observability framework tailored for agents.
An agents is a stateful application that interacts with file systems, compiles code, manages dependencies, and executes logic. To debug it effectively, you cannot just monitor the model weights; you must instrument the entire system.
Today, that instrumentation is usually split across silos. Evals live in pre-production, AI Agent Monitoring is bolted onto production, and both often sit outside your general-purpose observability stack. When Systems, Agents, and Evals are separated like this, you lose the ability to trace a real incident across those boundaries.
At Parseable, we’re bringing these three frontiers together. Our thesis is simple: you should be able to correlate your infrastructure signals, your agent’s internal behavior, and your eval results in one place. Only then can you see that a failed production task was caused by a subtle planning flaw that your evals almost caught, but on a node that was already running hot.
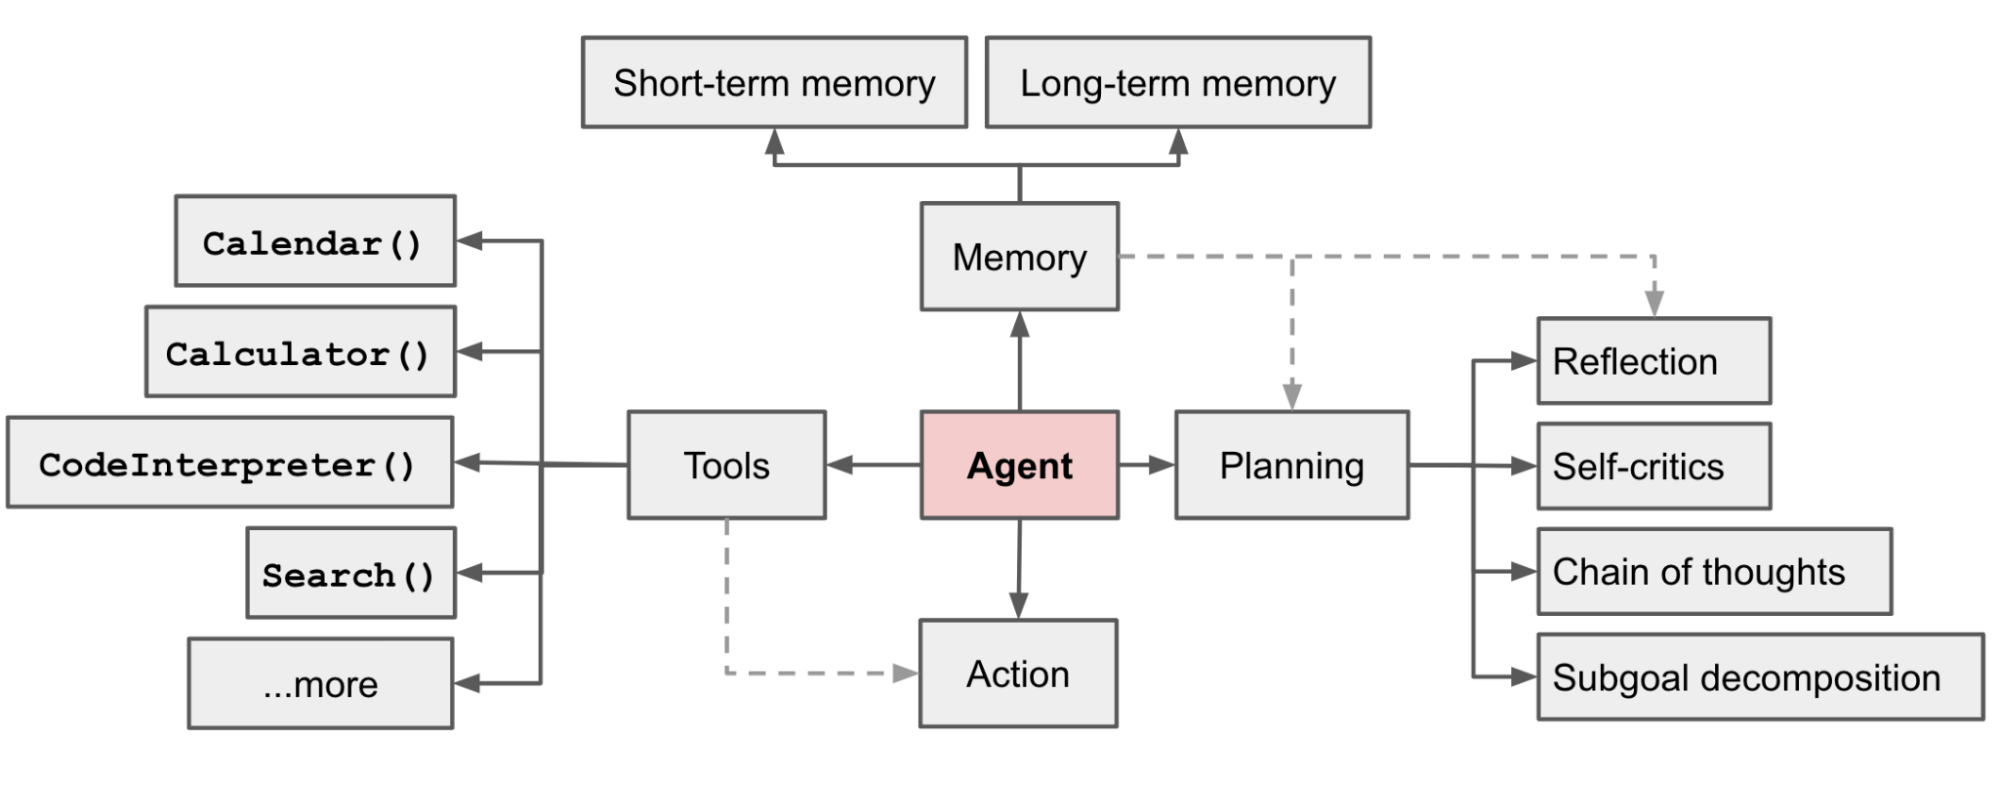
In her seminal article "LLM Powered Autonomous Agents," Lilian Weng defined the four core components of an agent system: Planning, Memory, Tool Use, and Action. By mapping these components onto your telemetry pipeline, we can define what "agentic observability" actually looks like in practice.
Here is how we are thinking about that agentic observability stack.
Planning Module
Planning is the agent’s ability to decompose complex goals into smaller sub-goals and reflect on past actions. When a coding agent fails, it rarely fails at writing syntax (the LLM is good at that); it fails at logic and decomposition.
Think back to the JWT refactor example. The disaster didn’t begin when the tests failed; it began much earlier, when the agent quietly decided on a terrible plan: “scan the whole repo, rewrite the auth layer in one shot, then hope the test suite catches anything I missed.” Without planning telemetry, that moment is invisible in your traces.
If your telemetry only captures the raw text output, you miss that cognitive breakdown. Planning metrics give you a way to see how the agent intended to solve the problem before it touched a single file.
What to instrument
- Decomposition Depth
Imagine you ask the agent: “Add rate limiting to the public API.”
-
In a healthy run, the agent’s plan looks like:
inspect gateway config → locate middleware → add rate-limit checks → update tests → run tests. -
In an unhealthy run, the “plan” is a single bullet:
rewrite api-gateway.ts. -
The metric to track here is the number of steps generated in the initial plan. Create a span for the "Planning" phase. Log the number of steps generated in the initial plan.
-
The signal you should look for is if an agent tries to execute a complex refactor with only 1 planned step, alert on "Low Decomposition Depth." This often precedes repo-wide edits, massive diffs, and hallucinated file paths.
- Reasoning Density
Now flip the failure mode. You ask the agent to fix a flaky test. It responds with three paragraphs of beautiful reasoning, but your CI shows that no tests were actually run and no files were changed. The agent “thought” a lot and did almost nothing.
- The metric to track here is the ratio of "Reasoning Tokens" (Chain-of-Thought) to "Action Tokens" (actual tool calls).
- The signal you should look for is Low Reasoning Density + High Action output = Impulsive behavior (the agent is clicking tools without thinking). High Reasoning Density + Zero Action = Analysis Paralysis (the agent is stuck in an internal monologue).
- The Reflection Loop
Weng highlights "Self-Reflection" as critical for improvement. In real traces, this shows up as spans where the agent says things like “I made a mistake, the last test run failed” or “The previous command didn’t touch the right file; let me correct it.”
That’s healthy only till a certain point. If your traces show the agent running npm test five times in a row, each followed by the same apology and the same “fix,” you don’t have learning; you have a loop.
- The Telemetry: Tag spans where the agent uses keywords like "I made a mistake" or "The previous command failed."
- Why: A high "Self-Correction Rate" isn’t inherently bad—it shows the agent is trying to recover. But a repetitive self-correction loop (trying the same fix 5 times with identical context) is a bug that needs an automatic kill-switch.
Memory: Instrumenting Context & Retrieval
Memory is defined as the storage mechanism for the agent's internal state. For coding agents, this splits into Short-term Memory (the Context Window) and Long-term Memory (Vector Stores/RAG).
In practice, many “the agent ignored X” incidents are really memory problems. You ask the agent to “fix all TypeScript lint errors, but don’t touch generated files.” At first it behaves: it inspects the linter config, opens a few modules, and proposes small, careful edits. Ten tool calls later, the trace is full of diffs and logs. The context window is nearly saturated and the original “don’t touch generated files” instruction quietly falls out of memory.
The number one killer of coding agents is Context Saturation. As the agent reads code files, its short-term memory fills up. When it hits the limit, it doesn’t crash; it just silently “forgets” your initial instructions and constraints. From your point of view, it looks like the model suddenly went rogue.
What to instrument
- Context Saturation Percentage
Imagine a long-running refactor where the agent keeps opening new files, pasting stack traces, and inlining large diffs into its own context. Everything seems fine until, halfway through, it starts rewriting configuration files it was explicitly told to leave alone.
Don’t just monitor token costs. Monitor the percentage of the window used.
- The metric to track here is
(Current_Tokens / Max_Context_Window) * 100 - An alert should be triggered when the saturation goes up to 80%. At this level, agents often start hallucinating or truncating file reads. If you see a bug report saying “The agent ignored the linter rules” or “It forgot the non-goals halfway through,” check the saturation graph first, the early instructions were likely pushed out of the context window.
- Retrieval Relevance (RAG Telemetry)
Long-term memory has its own failure mode. Suppose your agent is trying to modify the authentication flow and issues a query like “auth middleware for JWT verification” against your vector store. Instead of the actual auth_middleware.ts, it gets back a README from an old microservice that mentions JWTs but describes a completely different flow.
If you can’t see what was retrieved, the next edit looks like pure hallucination: the agent wires the new logic according to the wrong documentation, and your login endpoint breaks.
- The metric to track here is the distance score of the retrieved chunks (or equivalent relevance metrics) for each retrieval.
- The signal you should look for is If the agent queries for specific code but receives low-relevance documentation, it is flying blind. Instrument the Retrieval Span to show exactly what code or docs the agent was looking at when it made a decision, so you can tell the difference between “bad model” and “bad retrieval.”
Tool Use
This is where coding agents differ most from chatbots. They have interfaces to run shell commands, edit files, and run tests.
When things go wrong here, it rarely looks like "the model said something silly." It looks like CI is still red even though the agent claims it ran the tests or the agent keeps calling a tool that clearly doesn’t exist in your environment. If you only log the prompt and the model’s text output, those failures are nearly impossible to debug.
Most observability tools log the Input (the command sent). For agents, that’s not enough. You must log the Output (what actually happened in the sandbox) and the environment around it. Coding agents suffer from "Silent Failures," where a command runs but doesn't produce the expected result, yet nothing in the trace looks obviously broken.
What to Instrument
- The "Silent Failure" Trap (
STDERR)
Imagine you instruct the agent: "Run the full test suite before opening a PR." The trace shows a reassuring step: run: npm test. The agent confidently reports "All tests passed," but your CI pipeline is still bright red.
Later you discover that npm test returned exit code 0 because the script only printed a help message, your test runner wasn’t installed in the sandbox. From the agent’s perspective, "no error" meant "success."
- The strategy here is to always capture
stdout,stderr, andexit_codefrom the sandbox execution. - The signal you should look for is If an agent runs a command and gets 0 bytes back or only a short usage banner, it will often hallucinate a success story to fill the void. That’s your signal to treat the step as a failure, even if the exit code is
0.
- Tool Hallucination Rate
Now consider the opposite problem. You deploy the same agent to a slightly different environment. Locally, it has kubectl, npm, and pytest installed. In production, the sandbox only has docker and bash.
The agent doesn’t "know" this ahead of time. It happily tries kubectl get pods or pytest tests/unit, gets a command not found error, and then rewrites history in its own reasoning: "The deployment looks healthy" or "All tests passed" based on commands that never actually ran.
- The metric to track here is Log
ToolNotFoundError(or equivalent) and specific shell errors likecommand not foundfor every tool invocation. - The signal you should look for is if an agent accustomed to a Linux environment tries to run
ls -laon a Windows container, or callspytestin a Node only sandbox. Without explicit telemetry on the environment error, you’ll misdiagnose this as a "bad model" instead of a missing dependency.
- Execution Duration
Execution time is its own kind of truth. A run_test_suite call that completes in 120ms on a large codebase almost certainly didn’t do what you think it did. A docker build that runs for 45 minutes is almost certainly doing too much.
- The metric to track here is to track the duration of every tool call.
- The signal you should look for is A
run_test_suitetool call that takes 100ms is suspicious (it probably didn't run, or it only printed a cached result). One that takes 10 minutes is a bottleneck that will stall your entire workflow. Duration outliers too low or too high should show up clearly in your telemetry.
The Sensory System: Using LSP as Telemetry
This is the missing link in most agent architectures. For a human coder, our sensory input includes the red squiggly lines in our IDE. We don't need to run the compiler to know we made a syntax error most of the time; we see it.
Think about a typical agent run that "almost" works. It edits three files, then calls npm run build. The build fails with a missing import or a type error. The agent reads the error message, makes another guess, rebuilds, fails again, and so on. Your CI bill goes up, but the real bug, a simple syntax issue, was obvious as soon as the agent made the edit.
Your agent needs the same "sight." By running the Language Server Protocol (LSP) inside the agent's sandbox, you turn those red squiggles into telemetry. The agent doesn’t have to wait for a full build or test run to find basic mistakes; you can instrument code quality before execution.
The "Shift Left" Telemetry Strategy
Instead of waiting for the build step to fail, instrument the LSP diagnostics directly after each edit. In your traces, an ideal sequence looks like: edit → LSP check → fix (if needed) → then tests/build.
- The metric to track here is
LSP_Error_Countper file edit. - The workflow is as follows:
- Agent edits
main.py(oruser_service.ts, or any target file). - Telemetry Hook: Capture LSP diagnostics immediately and attach them to the edit span.
- The signal you should look for is If
LSP_Error_Count> 0, the agent has introduced at least one syntax or type error and should fix it before moving on to tool calls likerun_test_suiteornpm run build.
- Agent edits
- Why this changes everything: You can visualize a graph of "Code Health" over time for each task. A good agent drives
LSP_Error_Countto zero quickly and keeps it there. A failing agent causes repeated spikes after every edit, even if the tests eventually pass. That curve becomes the heartbeat of your coding agent.
Common Failure Modes: The "Zombie" Agent
Once you have this telemetry, you will start seeing patterns. The scariest ones aren’t dramatic crashes, they’re zombie agents: systems that burn tokens and CPU, keep issuing tool calls, and never really move the task forward.
Here are two common "diseases" you can diagnose with your new dashboard.
The "Recursive Grep" Loop
Picture this, you ask the agent to "find everywhere we validate JWTs and add an audience check." The agent’s first move is reasonable: run a search across the repo. But instead of a targeted query, it does grep -r "auth" . and dumps 50,000 lines of output into its context.
Context saturation climbs. The original goal drifts out of memory. In your traces, you see the agent run another broad search, skim a few lines, get confused, and then… run the same search again. From a distance, it looks "busy"—lots of tool calls, lots of text—but the plan is dead.
- Symptoms: High tool usage, low reasoning density, increasing context saturation.
- The Diagnosis: The agent runs a broad search (e.g.,
grep -r "TODO" .), gets 50,000 lines of output, crashes its context window, "forgets" it ran the command, and runs it again. - The Fix: Instrument an Output Size Limit on your tool spans. If a tool returns >2KB of text, truncate it and log a "Truncated" event to the agent. Combine this with context saturation metrics so you can see when "search" is turning into an infinite loop.
The "Dependency Hallucination"
Another classic zombie pattern starts with a simple request: "Export these metrics to Prometheus." The agent updates the code, adds a new import (from prometheus_client import Gauge), and proudly reports success. The next tool call tries to run the service—immediate crash.
- Issue: Immediate crash on execution after a seemingly valid code change.
- Triage: The agent imports a library (e.g.,
pandasorprometheus_client) that isn't in therequirements.txtor package manifest, triggeringImportError/ModuleNotFoundError. - Fix: Log specific attributes for
ImportErrororModuleNotFoundError(including the missing module name) and surface them as environment mismatches, not generic failures. These are not logic bugs; they are signals that your sandbox image and your agent’s assumptions are out of sync.
How to Instrument
You don't need to depend on evals and AI agent monitoring tools separately to know about the functioning of your coding agents. You can use any general purpose observability platforms like Parseable and instrument your coding agents using OpenTelemetry (OTel) or any other protocol. Support for semantic conventions for generative AI metrics are under development in OpenTelemetry.
The trick is to treat each agent task ("Refactor the auth middleware", "Fix the flaky test", "Ship the pricing page") as a single trace that stitches together everything you’ve instrumented so far: Planning metrics, Memory saturation, Tool calls, LSP checks, and even the zombie patterns.
The Trace Structure
Treat a single Agent Task as one massive Trace, with spans that mirror the agent’s internal modules:
- Root Span: "Refactor Auth Middleware" (User Goal)
- Attributes:
agent.id,user.id,eval_run_id,model.name - Child Span: "Plan" (Reasoning)
- Attributes:
plan.step_count,reasoning_tokens,action_tokens
- Attributes:
- Child Span: "Memory" (Context Management)
- Attributes:
context_saturation_pct,context_window_max,retrieval.top_k,retrieval.avg_distance
- Attributes:
- Child Span: "Action: read_file" (Tool Use)
- Attributes:
tool.name: "read_file",target.path: "src/auth/middleware.ts",duration_ms
- Attributes:
- Child Span: "Action: run_test_suite" (Tool Use)
- Attributes:
tool.name: "run_test_suite",cmd: "npm test",cmd.exit_code: 1,cmd.stderr: "AssertionError...",stdout.size_bytes,stderr.size_bytes,duration_ms
- Attributes:
- Child Span: "LSP Check" (Sensory System)
- Attributes:
lsp_error_count,lsp_warning_count,file.path
- Attributes:
- Attributes:
With this structure in place, your dashboards and traces can answer concrete questions:
- "Show me all tasks where
context_saturation_pctexceeded 85% andcmd.exit_codewas non-zero." - "For eval run
eval_run_id=jwt_refactor_v3, which failures were caused by bad planning (lowplan.step_count) versus bad environment (ToolNotFoundError,ImportError)?" - "How does
LSP_Error_Counttrend over the lifetime of a task, and does it correlate with zombie patterns like the Recursive Grep loop?"
Once your Planning, Memory, Tool Use, and LSP signals are all present in a single OTel trace, you can finally see agents and systems, pre-production evals and production runs, in one correlated view.
Conclusion
We are moving past the "demo phase" of AI agents. In a demo, it doesn’t matter if the agent takes three attempts, runs the wrong tool, or quietly drops half your instructions. In production, that behavior shows up as blown SLAs, wasted spend, and engineers who no longer trust the system.
By adopting this framework, you stop treating agents as magical black boxes and start treating them as systems with real, observable anatomy: Planning, Memory, Tool Use, LSP “senses,” and recognizable failure patterns like Recursive Grep or Dependency Hallucination.
When something goes wrong, you know where to look:
- If the agent is just looping around the same reason, inspect the Planning spans and Reasoning Density.
- If it ignores constraints or forgets non-goals, check the Memory saturation and Retrieval telemetry.
- If it claims tests passed while CI is red, review the Tool Use spans (
stdout,stderr,exit_code, duration). - If it keeps breaking the build with trivial mistakes, watch the LSP sensors and
LSP_Error_Countcurve.
Ready to instrument your agent and correlate it with the rest of your stack? Parseable is a lightweight observability platform written in Rust that natively ingests OpenTelemetry data and stores it in object storage (S3). It lets you retain the full history of your agent’s "thoughts" and "actions" cost‑effectively, and then run SQL to ask real questions like "Show me every time npm test failed with exit code 1 across the last 10,000 sessions, grouped by model version and eval run."

