

Introduction
Ray.io is an open-source, unified compute framework that allows you to scale Python and AI applications from a single machine to a massive cluster with minimal code changes. But once you move beyond the hello-world stage, a new question shows up quickly:
What is my Ray cluster actually doing right now and how healthy is it?
The built-in Ray Dashboard is great for an at-a-glance view, but for real operations work you need something more:
- Historical metrics across many runs
- Centralized storage for all cluster metrics
- Cross-layer analysis with logs, traces, and audit data
In this post, we’ll set up a observability pipeline to monitor Ray with Parseable using the data ingested through Fluent Bit.
- Ray exposes Prometheus metrics on multiple ports.
- Fluent Bit scrapes those metrics and sends them to Parseable in OpenTelemetry metrics format.
- Parseable receives them under a dedicated
raymetricsdataset.
Let’s walk through the architecture, configuration, and how to actually use these metrics in Parseable.
Architecture Overview
The pipeline looks like this:
-
Ray
Ray head and worker components expose Prometheus metrics endpoints on different ports. -
Fluent Bit (v4.0.7)
Uses theprometheus_scrapeinput plugin to scrape those endpoints every 15 seconds, and theopentelemetryoutput plugin to send metrics in OTLP format. -
Parseable
Receives OTLP metrics athttp://localhost:8000/v1/metrics
Uses headers to route data into a dedicatedraymetricsdataset
Stores all metrics in object storage (S3) and exposes them via SQL.
Visually:
Ray Prometheus endpoints → Fluent Bit (Prometheus scrape) → OTLP → Parseable (dataset:
raymetrics)
Prerequisites
You’ll need:
- A running Ray cluster (local or remote).
- Fluent Bit v4.x installed.
- A running Parseable instance accessible at
localhost:8000(or your own host). - Network connectivity from Fluent Bit to Parseable.
We’ll assume:
- Ray Dashboard:
http://localhost:8265 - Parseable:
http://localhost:8000 - Parseable dataset for Ray metrics:
raymetrics
If your hostnames or ports differ, just substitute them in the configuration snippets below.
Configure Fluent Bit to Scrape Ray Metrics
First, create a configuration file, for example fluent-bit-ray.conf, that tells Fluent Bit:
- How often to flush data.
- Which Prometheus endpoints to scrape.
- Where to send data in OTLP format.
Here is the configuration you used:
[SERVICE]
    Flush        5
    Daemon       Off
    Log_Level    debug

[INPUT]
    Name              prometheus_scrape
    Host              127.0.0.1
    Port              55979
    Tag               ray.metrics.1
    Scrape_Interval   15

[INPUT]
    Name              prometheus_scrape
    Host              127.0.0.1
    Port              44217
    Tag               ray.metrics.2
    Scrape_Interval   15

[INPUT]
    Name              prometheus_scrape
    Host              127.0.0.1
    Port              44227
    Tag               ray.metrics.3
    Scrape_Interval   15

[OUTPUT]
    Name          opentelemetry
    Match         ray.metrics.*
    Host          localhost
    Port          8000
    Metrics_uri   /v1/metrics
    Log_response_payload True
    Tls           Off
    Http_User     admin
    Http_Passwd   admin
    Header        X-P-Stream raymetrics
    Header        X-P-Log-Source otel-metrics
    compress      gzip
    Retry_Limit   3
A quick breakdown:
-
[SERVICE]
Flush 5– send data every 5 seconds.
Log_Level debug– very useful while you’re wiring everything up. -
[INPUT] prometheus_scrape
Host 127.0.0.1/Port 55979, 44217, 44227– your Ray metrics endpoints.
Scrape_Interval 15– scrape each endpoint every 15 seconds.
Tag ray.metrics.X– tags used to route metrics to the correct output. -
[OUTPUT] opentelemetry
Match ray.metrics.*– send all three input streams to this output.
Host anton,Port 8010,Metrics_uri /v1/metrics– your Parseable OTLP metrics endpoint.
Header X-P-Stream raymetrics– tells Parseable to store everything in streamraymetrics.
Header X-P-Log-Source otel-metrics– optional metadata about the source.
Log_response_payload True– log Parseable’s response body (handy for debugging).
Retry_Limit 3– retry failed sends a few times before giving up.
Start Fluent Bit and Verify Data Flow
Start Fluent Bit with your configuration:
fluent-bit -c fluent-bit-ray.conf > fluent-bit.log 2>&1 &Your log file fluent-bit.log should show all the interesting stages:
- Inputs initialized:
[ info]  inputs:
[ info]      prometheus_scrape
[ info]      prometheus_scrape
[ info] prometheus_scrape- Output configured:
[ info]  outputs:
[ info] opentelemetry.0- Metrics being encoded and sent:
[debug] [output:opentelemetry:opentelemetry.0] cmetrics msgpack size: 87913
[debug] [output:opentelemetry:opentelemetry.0] final payload size: 108896
[debug] [upstream] KA connection #45 to anton:8010 is connected
[ info] [output:opentelemetry:opentelemetry.0] anton:8010, HTTP status=200
[debug] [output:opentelemetry:opentelemetry.0] http_post result FLB_OK
Whenever Parseable is temporarily unavailable, you will also see messages like:
[error] [http_client] broken connection to anton:8010 ?
[error] [output:opentelemetry:opentelemetry.0] anton:8010, HTTP status=0
[debug] [output:opentelemetry:opentelemetry.0] http_post result FLB_ERROR
…and then Fluent Bit retries until it can reconnect and see HTTP status=200 again.
This alone is useful telemetry:
- You know Fluent Bit is scraping Ray (tasks being created for
prometheus_scrapeinputs). - You know Parseable is receiving metrics (
HTTP status=200). - You can see payload sizes and retry patterns when the connection is unstable.
At this point, your setup is:
- Ray Dashboard:
http://127.0.0.1:8265 - Fluent Bit: running in the background, scraping 3 Ray metrics endpoints every 15 seconds.
- Parseable: receiving OTLP metrics at
localhost:8000/v1/metricsin streamraymetrics.
Confirm Ray Metrics in Parseable
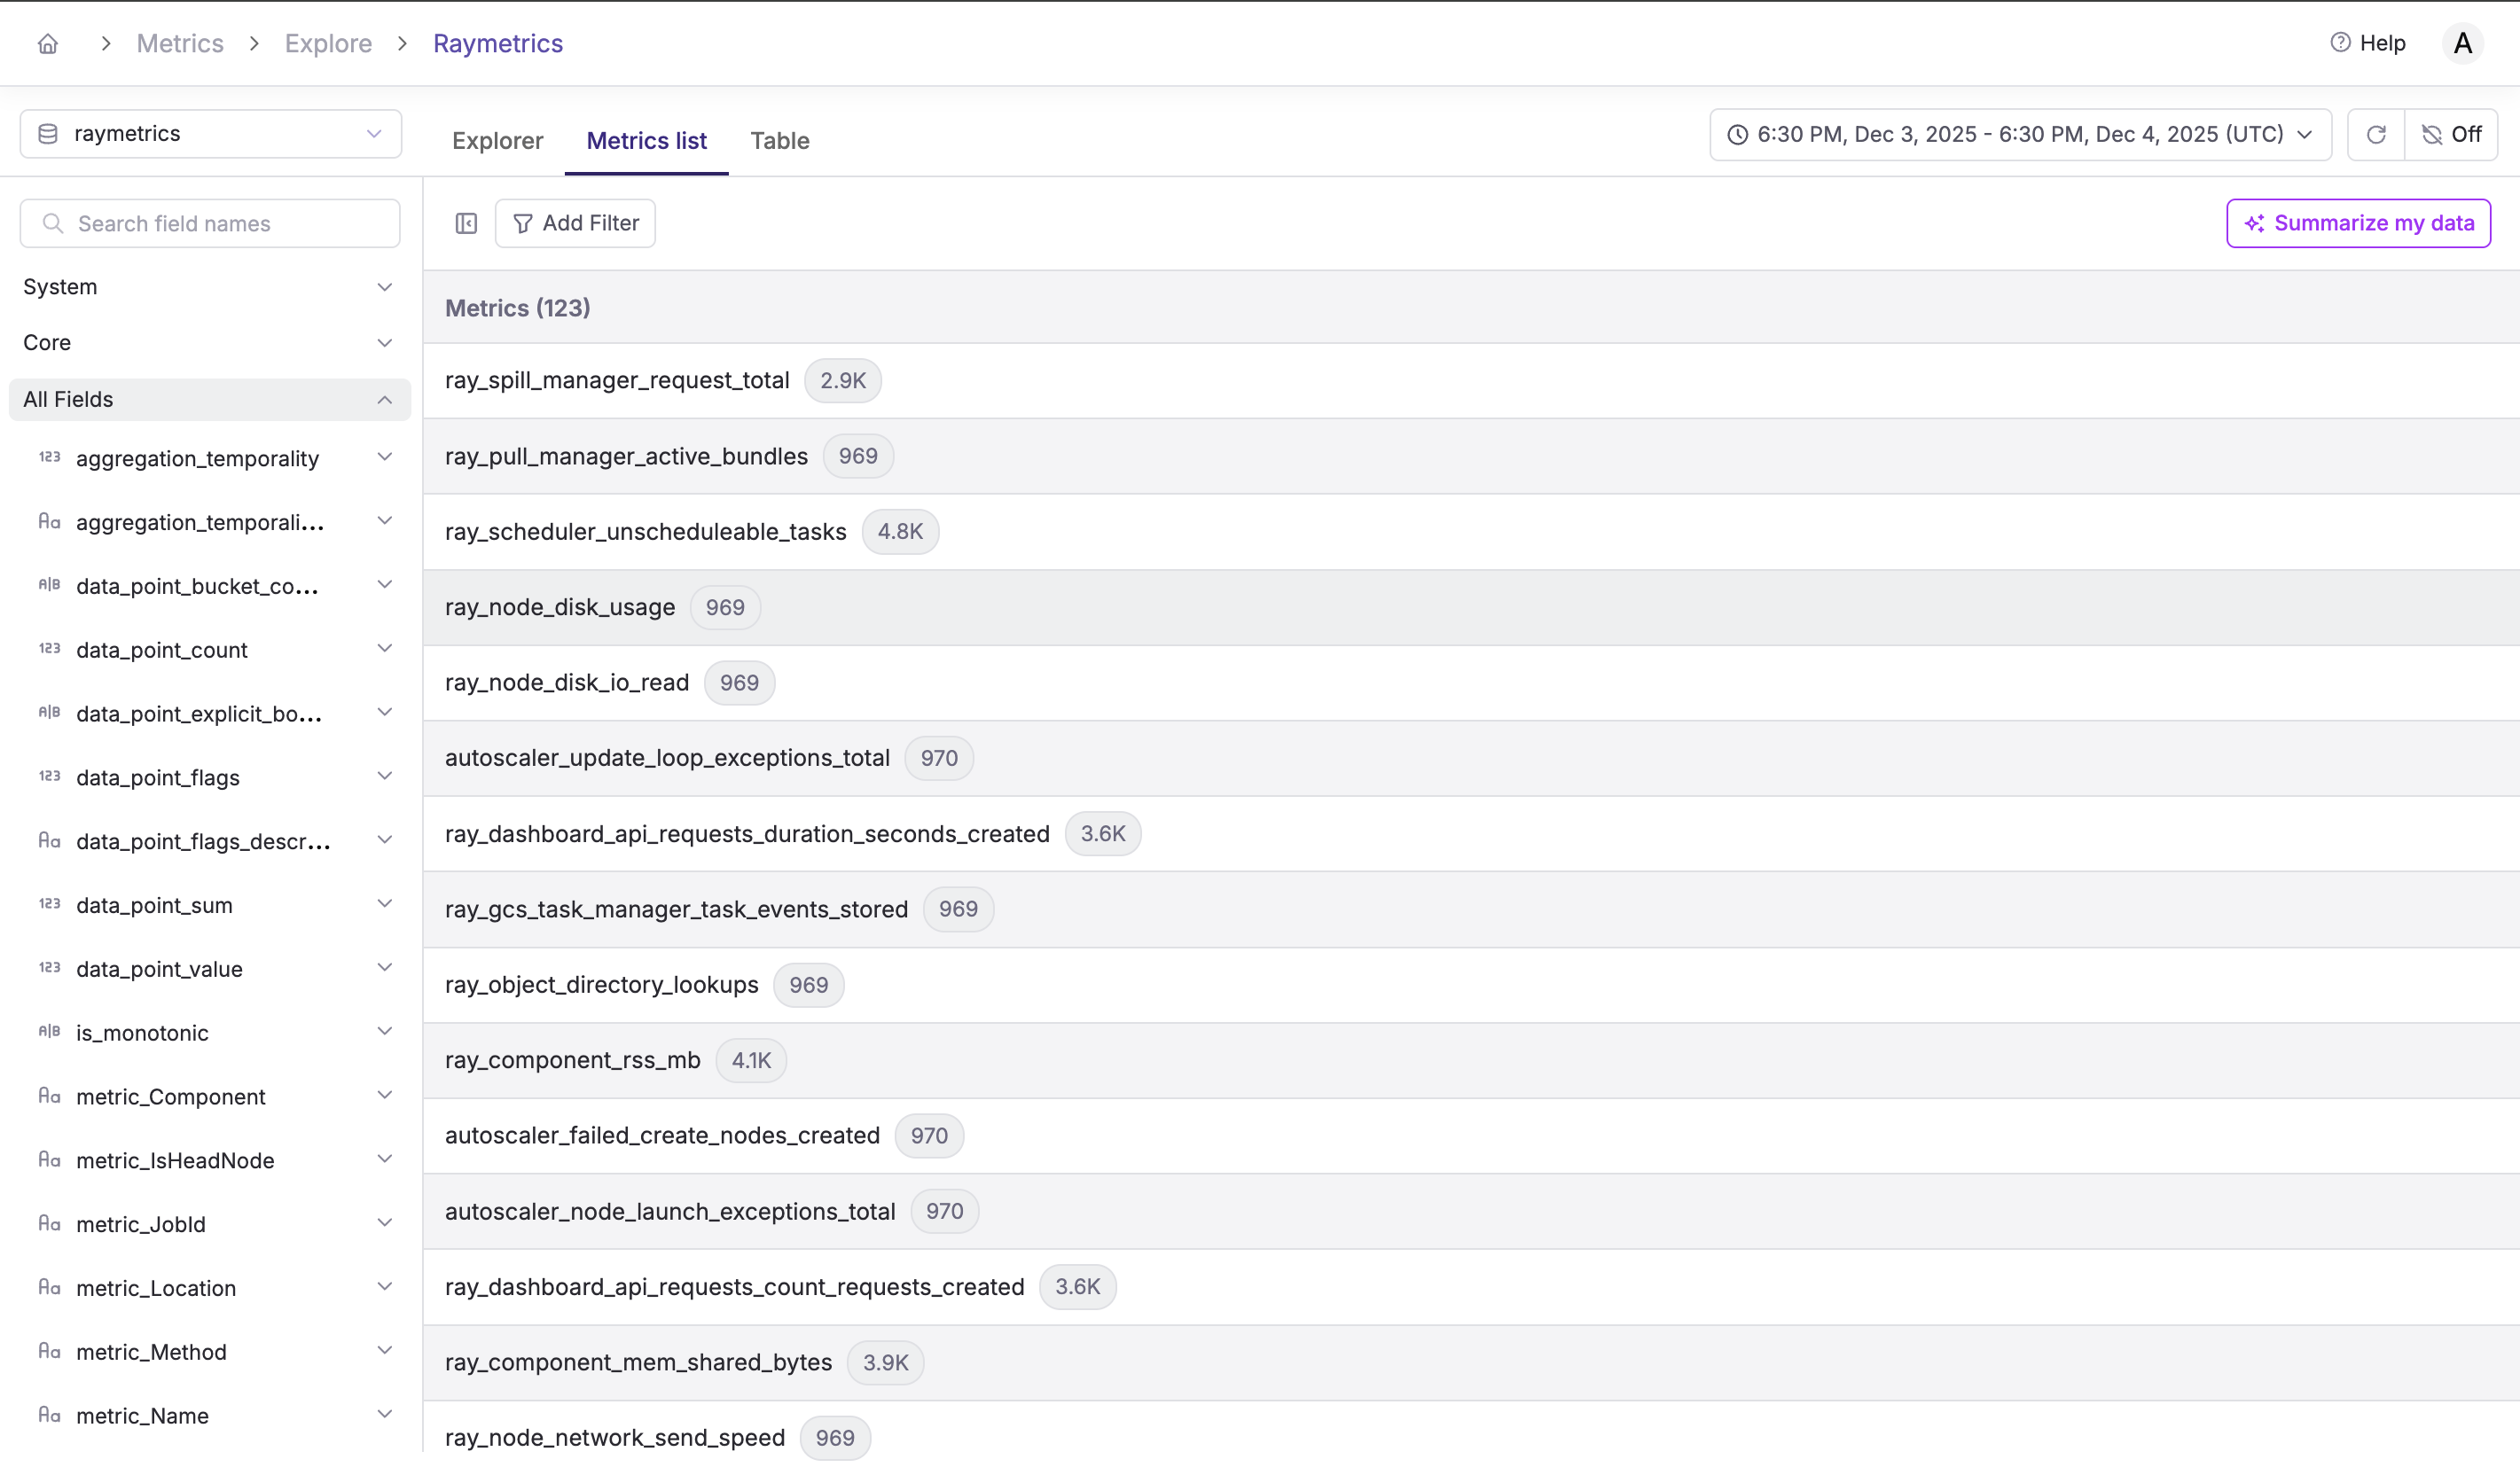
In Parseable, you should now see a dataset called raymetrics populated with OpenTelemetry metrics from Ray.
Assuming you created the dataset (or Parseable auto-created it on first write), you can:
- Open the Parseable UI and select the
raymetricsstream. - Filter on recent timestamps to verify new data is flowing.
- Inspect a few records to see what the schema looks like for your OTLP metrics.
The Ray metrics dataset includes columns like:
| Column | Description |
|---|---|
metric_name | Metric identifier (e.g., ray_node_cpu_utilization) |
data_point_value | The metric value |
p_timestamp | Parseable ingestion timestamp |
time_unix_nano | Original metric timestamp |
metric_NodeAddress | Ray node IP address |
metric_JobId | Ray job identifier |
metric_State | Task/actor state |
metric_ObjectState | Object store state |
metric_SessionName | Ray cluster session name |
metric_WorkerId | Worker process identifier |
Core Ray Health Dashboards in Parseable
Once Ray metrics land in Parseable, you can start building Ray health views that go beyond the built-in dashboard.
1. Node CPU and Memory Utilization
You want a quick answer to:
"Which Ray nodes are under the heaviest CPU and memory load?"
Conceptually, you can:
- Filter
ray_node_cpu_utilizationby node. - Bucket in time (for example 1-minute windows).
- Plot average CPU over time per node.
SELECT
  DATE_TRUNC('minute', raymetrics.p_timestamp) AS minute,
  raymetrics."metric_NodeAddress" AS node,
  AVG(raymetrics.data_point_value) AS avg_cpu
FROM raymetrics
WHERE raymetrics."metric_name" = 'ray_node_cpu_utilization'
GROUP BY minute, node
ORDER BY minute, node;
Do the same for memory utilization metrics (for example ray_node_mem_used) to catch nodes that are close to OOM before they cause job failures.
2. Task Throughput and Failures
Ray emits metrics about tasks by state (running, queued, failed). You can:
- Track how many tasks enter a failed state over time.
- Group by job or task name to identify hotspots.
For example:
SELECT
  DATE_TRUNC('minute', p_timestamp)  AS window,
  metric_JobId                       AS job,
  metric_State                       AS state,
  SUM(data_point_value)              AS task_count
FROM raymetrics
WHERE metric_name = 'ray_tasks'
  AND metric_State = 'FAILED'
GROUP BY window, job, state
ORDER BY window, task_count DESC;
This helps you answer:
- Which jobs are most error-prone?
- Did a particular deployment spike task failures?
3. Object Store Pressure
Ray’s performance depends heavily on its object store. Metrics such as "object store memory used" and "spillover" are crucial.
You can:
- Monitor memory usage as a percentage of the object store.
- Alert when it exceeds a threshold (for example 80%).
SELECT
  DATE_TRUNC('minute', p_timestamp)  AS minute,
  metric_NodeAddress                 AS node,
  metric_ObjectState                 AS object_state,
  AVG(data_point_value)              AS avg_memory
FROM raymetrics
WHERE metric_name = 'ray_object_store_memory'
GROUP BY minute, node, object_state
ORDER BY minute, node;
If object store pressure correlates with spikes in failed tasks, you have just connected cluster health to application reliability.
Extending the Setup
Once the basics are in place, there are several easy extensions.
Add Ray Logs to Parseable
Use Fluent Bit tail or forward inputs to send Ray component logs into a raylogs stream. Now you can correlate metrics spikes with log error patterns.
Add Traces from Ray Workers (If Applicable)
If your Ray workers emit OpenTelemetry traces, point them at Parseable’s OTLP traces endpoint and tie task-level traces back to the node metrics.
Multi-Cluster or Anyscale Deployments
For Ray clusters running on Anyscale or across multiple environments, add cluster labels (for example cluster_id, env) to your metrics and logs. Then:
SELECT
  metric_SessionName        AS cluster,
  metric_NodeAddress        AS node,
  AVG(data_point_value)     AS avg_cpu
FROM raymetrics
WHERE metric_name = 'ray_node_cpu_utilization'
GROUP BY cluster, node;
This gives you a fleet-wide view of Ray health in one place.
Conclusion
You now have a complete monitoring path:
- Ray exposes Prometheus metrics on several ports.
- Fluent Bit scrapes those endpoints every 15 seconds using
prometheus_scrape. - Fluent Bit sends metrics in OpenTelemetry format to Parseable via the
opentelemetryoutput. - Parseable stores them in the
raymetricsstream, where you can query, visualize, and correlate them with other signals.
With this setup, monitoring Ray stops being an ad-hoc dashboard task and becomes part of your unified observability story:
- Node health, task reliability, and object store pressure in one place.
- Fluent Bit transport health along the same timeline.
- The ability to layer in logs, traces, and audit data as your system grows.

