

Introduction
You're routing LLM requests through OpenRouter. You want observability. But you don't want to instrument your application code, set up an OpenTelemetry Collector, or manage yet another piece of infrastructure.
OpenRouter's Broadcast feature solves this. It automatically sends OpenTelemetry traces for every LLM request to your configured destinations, without any changes to your application. Combined with Parseable's native OTLP ingestion, you get full LLM observability in under 5 minutes.
What is OpenRouter Broadcast?
OpenRouter is a unified API gateway for 200+ LLM models from OpenAI, Anthropic, Google, Meta, and others. Instead of managing multiple API keys and SDKs, you route all your LLM traffic through OpenRouter.
Broadcast is OpenRouter's built-in observability feature. When enabled, OpenRouter automatically generates and sends OpenTelemetry traces for every API request to your configured destinations. Each trace includes:
| Data | Description |
|---|---|
| Request metadata | Model, provider, timestamp, request ID |
| Token usage | Input tokens, output tokens, total tokens |
| Latency | Time to first token, total response time |
| Cost | Estimated cost based on model pricing |
| Messages | Prompts and completions (optional) |
| User context | User ID, session ID (if provided) |
The key insight: this happens at the gateway level. Your application code doesn't need to know about observability at all.
Why Parseable for LLM Traces?
Parseable is a lightweight, high-performance observability platform that natively ingests OpenTelemetry data. For LLM traces, this means:
- SQL queries: Analyze traces with familiar SQL syntax
- Cost-effective storage: Object storage backend (S3, MinIO) keeps costs low
- No vendor lock-in: Standard OTLP protocol, your data stays portable
- Real-time and historical: Query recent traces or analyze months of history
Unlike traditional APM tools that charge per span or per GB, Parseable's architecture makes it economical to store complete LLM traces, including full prompts and responses, for extended retention periods.
Architecture
The data flow is simple:
┌─────────────────┐     ┌─────────────────┐
│  Your App       │────▶│   OpenRouter    │
│  (LLM calls)    │     │   (Gateway)     │
└─────────────────┘     └────────┬────────┘
                                 │
                                 │ Broadcast
                                 │ (OTLP/HTTP)
                                 │
                                 ▼
                        ┌─────────────────┐
                        │   Parseable     │
                        │   (/v1/traces)  │
                        │   endpoint      │
                        └─────────────────┘
Your application makes LLM requests to OpenRouter as usual. OpenRouter processes the request, routes it to the appropriate model provider, and asynchronously sends trace data to Parseable via OTLP/HTTP. No additional latency is added to your API responses.
Setup Guide
Prerequisites
- An OpenRouter account with API access
- A Parseable instance (cloud or self-hosted)
- Admin access to configure OpenRouter Broadcast settings
Step 1: Get Your Parseable OTLP Endpoint
Parseable exposes an OTLP-compatible endpoint for trace ingestion at /v1/traces.
For Parseable Cloud, your endpoint will look like:
https://<your-instance>.parseable.com/v1/tracesFor self-hosted Parseable:
https://your-parseable-host:8000/v1/tracesStep 2: Prepare Authentication Headers
Parseable uses Basic authentication. You'll need to encode your credentials:
# Encode credentials
echo -n "username:password" | base64
You'll also need to specify the target stream and log source. The complete headers object:
{
  "Authorization": "Basic <base64-encoded-credentials>",
  "X-P-Stream": "openrouter-traces",
  "X-P-Log-Source": "otel-traces"
}| Header | Purpose |
|---|---|
Authorization | Basic auth with your Parseable credentials |
X-P-Stream | Target dataset/stream name in Parseable |
X-P-Log-Source | Must be otel-traces for trace data |
Step 3: Configure OpenRouter Broadcast
- Navigate to OpenRouter Broadcast Settings
- Click "Add Destination"
- Select "OpenTelemetry Collector" as the destination type
- Configure the connection:
Name: Give it a descriptive name (e.g., "Parseable Production")
Endpoint: Your Parseable OTLP endpoint
https://<your-instance>.parseable.com/v1/tracesHeaders: Your authentication and routing headers
{
  "Authorization": "Basic <your-base64-credentials>",
  "X-P-Stream": "openrouter-traces",
  "X-P-Log-Source": "otel-traces"
}- Click "Test Connection" to verify the setup
- Click "Save" to enable the destination
Step 4: Configure Sampling (Optional)
For high-volume applications, you may want to sample traces to control costs:
| Sampling Rate | Use Case |
|---|---|
| 1.0 (100%) | Development, debugging, low-volume production |
| 0.1 (10%) | Medium-volume production |
| 0.01 (1%) | High-volume production |
Sampling is deterministic when you provide a session_id, all traces within a session are consistently included or excluded together.
Step 5: Filter by API Key (Optional)
You can configure each destination to only receive traces from specific API keys. This is useful for:
- Separating development and production traces
- Routing different projects to different streams
- Applying different sampling rates per environment
Enriching Your Traces
OpenRouter traces are more useful when you include context from your application. Add these optional fields to your API requests:
User Identification
import openai

client = openai.OpenAI(
    base_url="https://openrouter.ai/api/v1",
    api_key="your-openrouter-key"
)

response = client.chat.completions.create(
    model="anthropic/claude-3.5-sonnet",
    messages=[{"role": "user", "content": "Hello!"}],
    extra_body={
        "user": "user_12345"  # Links traces to specific users
    }
)
Session Tracking
response = client.chat.completions.create(
    model="anthropic/claude-3.5-sonnet",
    messages=[{"role": "user", "content": "Hello!"}],
    extra_body={
        "user": "user_12345",
        "session_id": "session_abc123"  # Groups related requests
    }
)
Or via header:
response = client.chat.completions.create(
    model="anthropic/claude-3.5-sonnet",
    messages=[{"role": "user", "content": "Hello!"}],
    extra_headers={
        "x-session-id": "session_abc123"
    }
)
These fields appear in your Parseable traces, enabling queries like "show me all requests from user X" or "trace the full conversation in session Y".
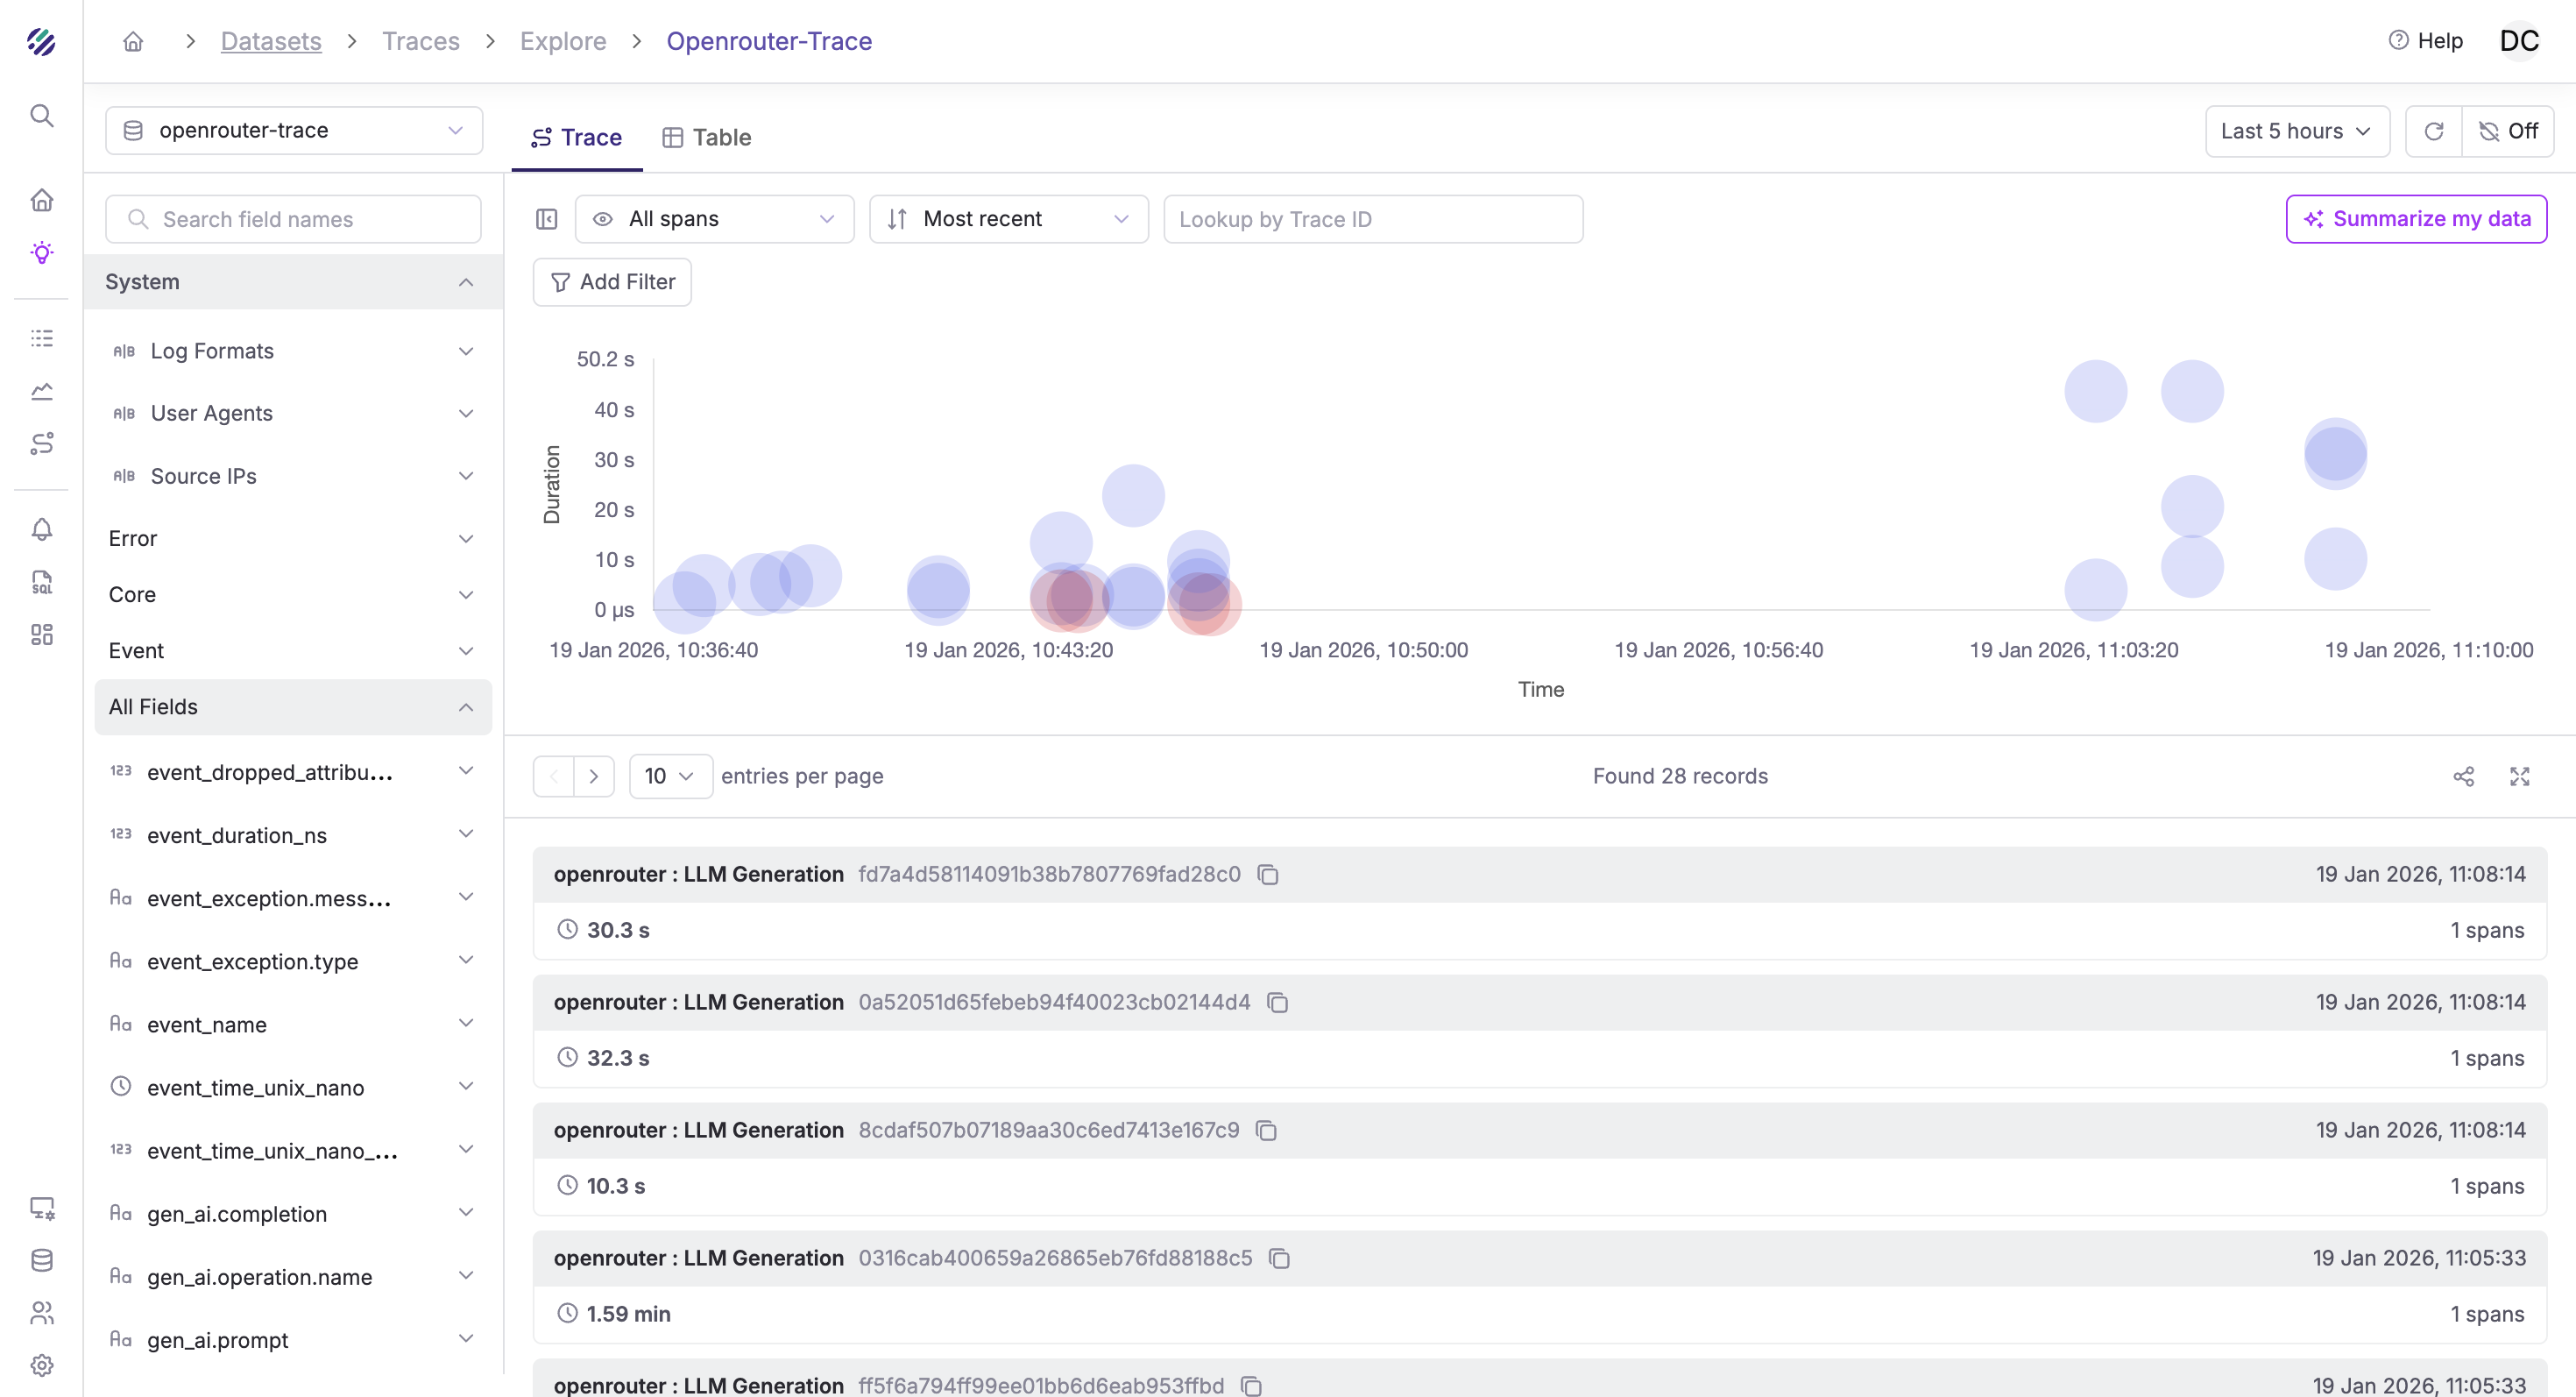
Viewing Traces in Parseable
Once configured, traces from OpenRouter will appear in your Parseable instance. The Traces Explorer provides a visual timeline of all LLM requests:
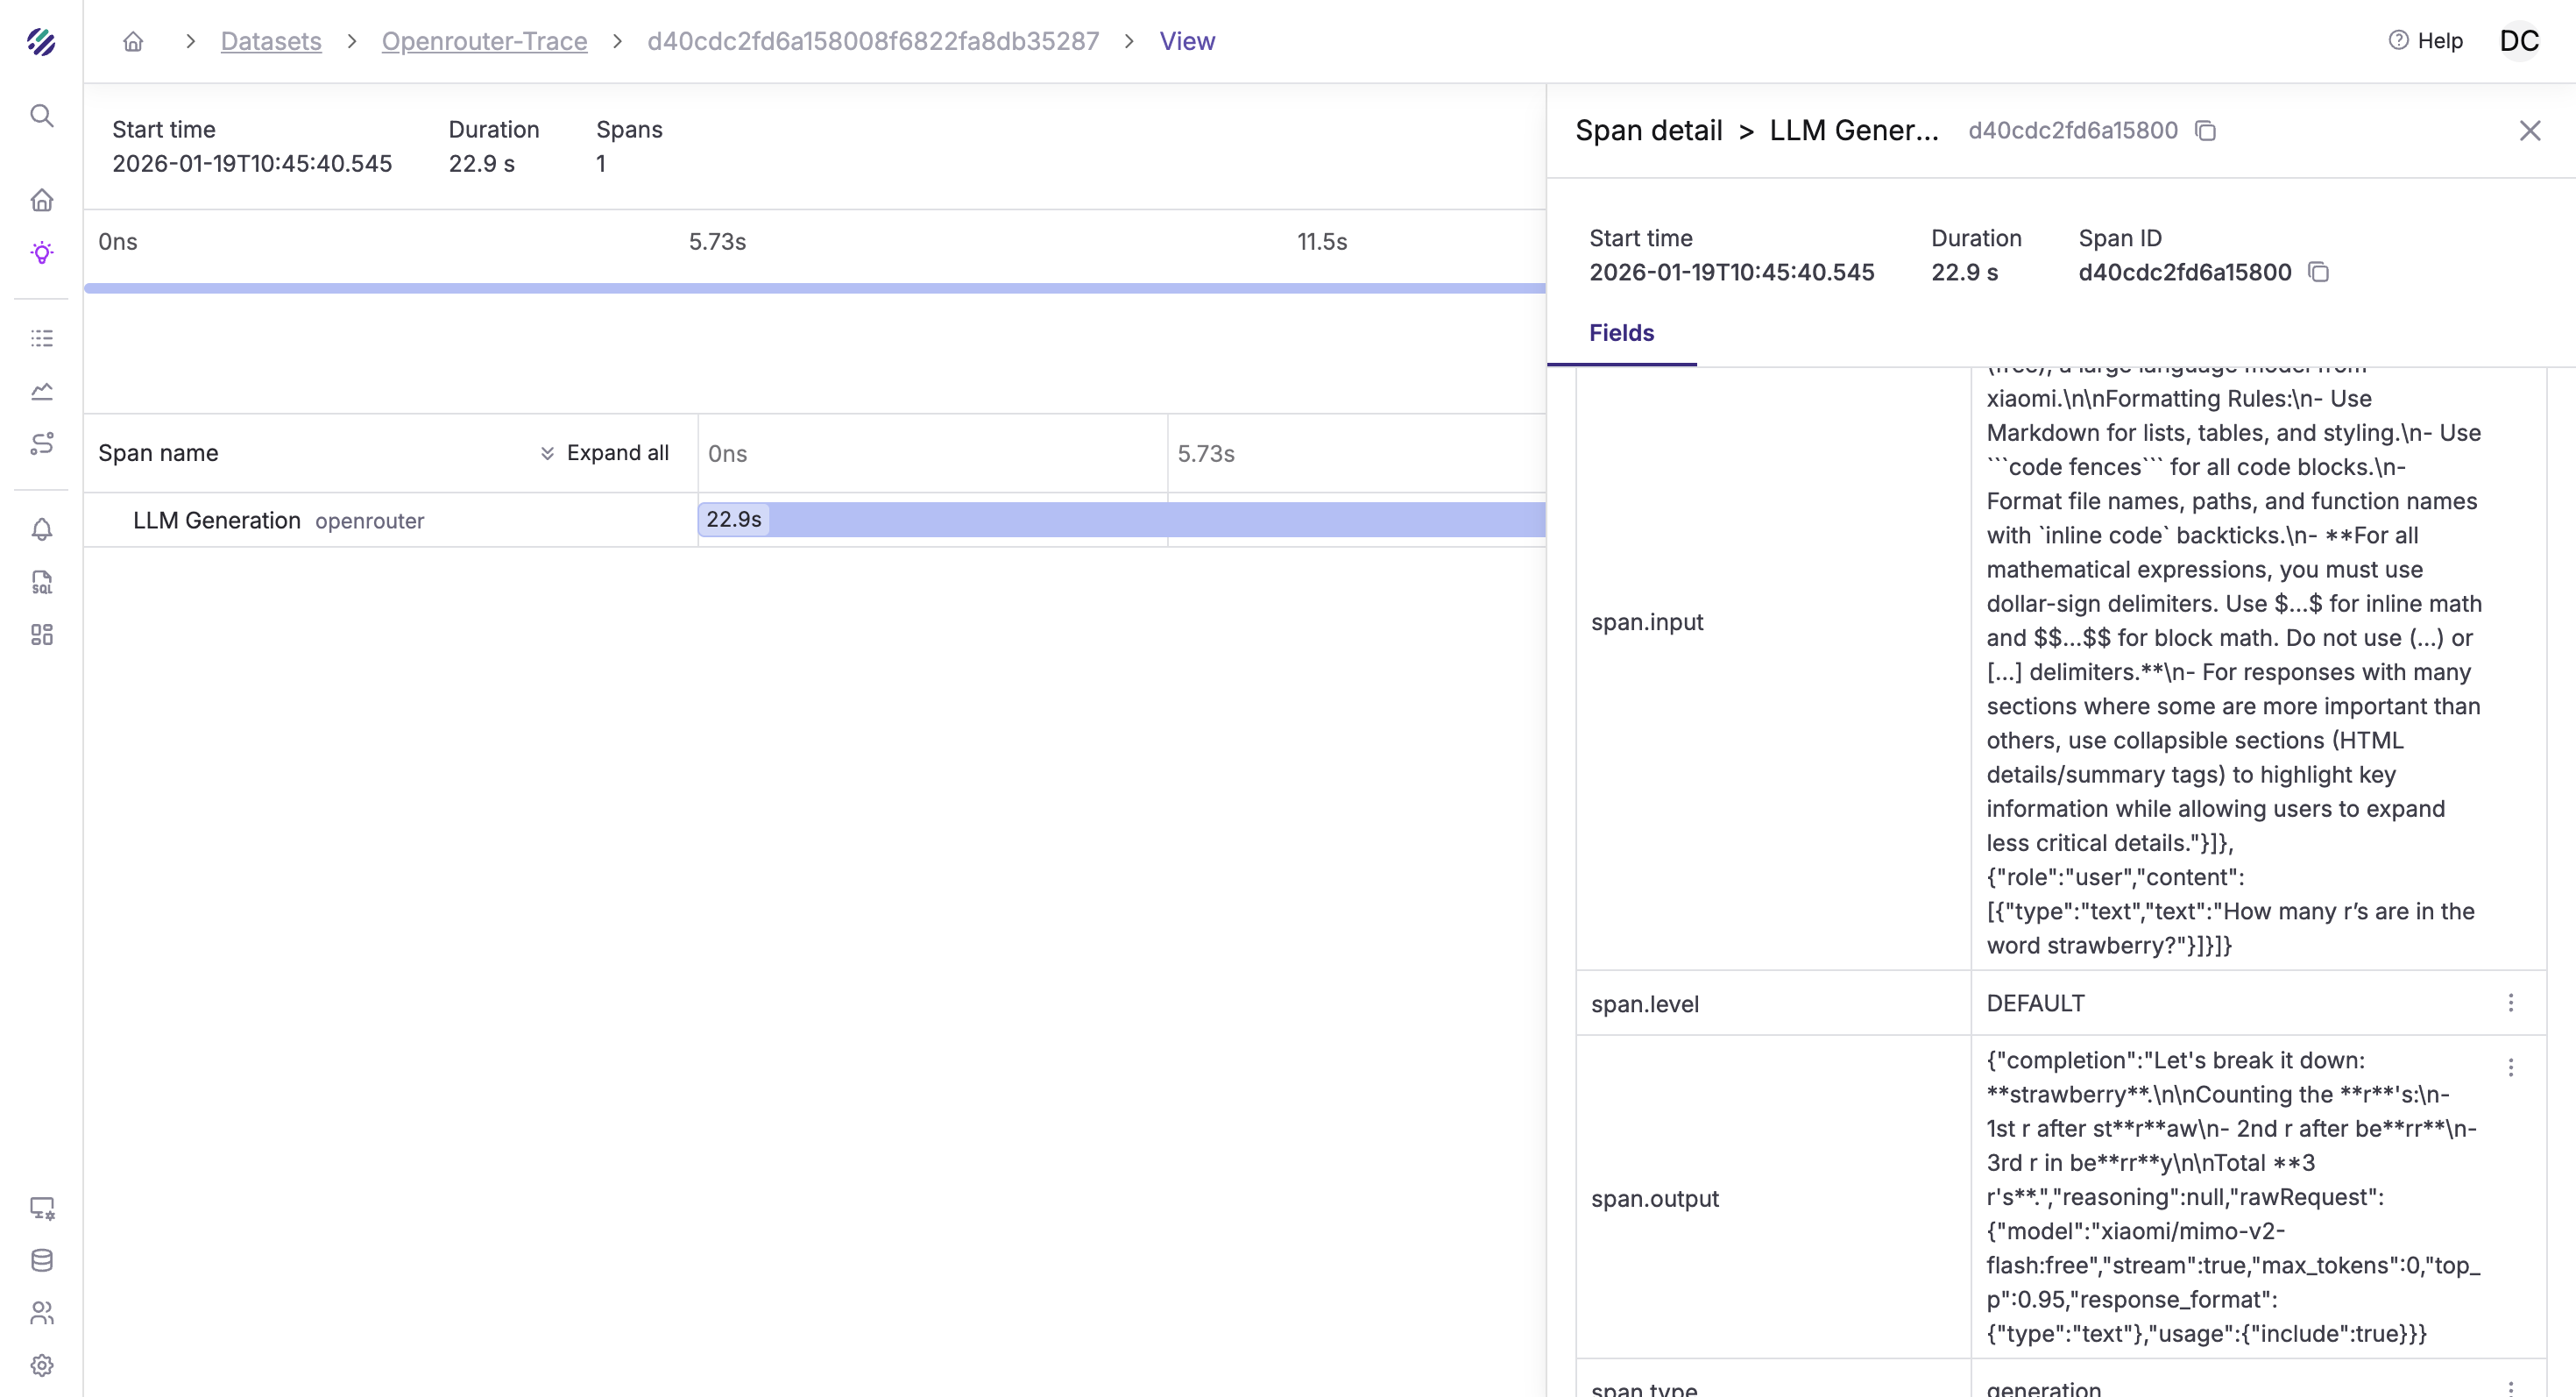
Click on any trace to see the full span details, including the prompt, completion, token usage, and timing information:
Querying Traces in Parseable
Once traces are flowing, you can analyze them with SQL in Parseable.
Trace Schema
OpenRouter traces include these key fields:
| Field | Description |
|---|---|
trace_id | Unique trace identifier |
span_id | Unique span identifier |
span_name | Operation name |
span_duration_ns | Duration in nanoseconds |
gen_ai.request.model | Requested model |
gen_ai.response.model | Actual model used |
gen_ai.usage.input_tokens | Input token count |
gen_ai.usage.output_tokens | Output token count |
gen_ai.usage.cost | Estimated cost |
user.id | User identifier (if provided) |
session.id | Session identifier (if provided) |
Example Queries
Token usage by model (last 24 hours):
SELECT
  "gen_ai.request.model" AS model,
  COUNT(*) AS requests,
  SUM(CAST("gen_ai.usage.input_tokens" AS BIGINT)) AS input_tokens,
  SUM(CAST("gen_ai.usage.output_tokens" AS BIGINT)) AS output_tokens,
  SUM(CAST("gen_ai.usage.input_tokens" AS BIGINT) +
      CAST("gen_ai.usage.output_tokens" AS BIGINT)) AS total_tokens
FROM "openrouter-traces"
WHERE p_timestamp > NOW() - INTERVAL '24 hours'
GROUP BY model
ORDER BY total_tokens DESC;
Average latency by model:
SELECT
  "gen_ai.request.model" AS model,
  COUNT(*) AS requests,
  AVG(span_duration_ns / 1e6) AS avg_latency_ms,
  PERCENTILE_CONT(0.95) WITHIN GROUP (ORDER BY span_duration_ns / 1e6) AS p95_latency_ms
FROM "openrouter-traces"
WHERE p_timestamp > NOW() - INTERVAL '24 hours'
GROUP BY model
ORDER BY avg_latency_ms DESC;
Cost breakdown by user:
SELECT
  "user.id" AS user_id,
  COUNT(*) AS requests,
  SUM(CAST("gen_ai.usage.cost" AS DOUBLE)) AS total_cost_usd
FROM "openrouter-traces"
WHERE p_timestamp > NOW() - INTERVAL '7 days'
  AND "user.id" IS NOT NULL
GROUP BY user_id
ORDER BY total_cost_usd DESC
LIMIT 20;
Requests per session:
SELECT
  "session.id" AS session_id,
  COUNT(*) AS request_count,
  SUM(CAST("gen_ai.usage.input_tokens" AS BIGINT)) AS total_input_tokens,
  MIN(p_timestamp) AS session_start,
  MAX(p_timestamp) AS session_end
FROM "openrouter-traces"
WHERE "session.id" IS NOT NULL
  AND p_timestamp > NOW() - INTERVAL '24 hours'
GROUP BY session_id
ORDER BY request_count DESC
LIMIT 20;
Error rate by model:
SELECT
  "gen_ai.request.model" AS model,
  COUNT(*) AS total_requests,
  SUM(CASE WHEN span_status_code = 2 THEN 1 ELSE 0 END) AS errors,
  ROUND(100.0 * SUM(CASE WHEN span_status_code = 2 THEN 1 ELSE 0 END) / COUNT(*), 2) AS error_rate
FROM "openrouter-traces"
WHERE p_timestamp > NOW() - INTERVAL '24 hours'
GROUP BY model
ORDER BY error_rate DESC;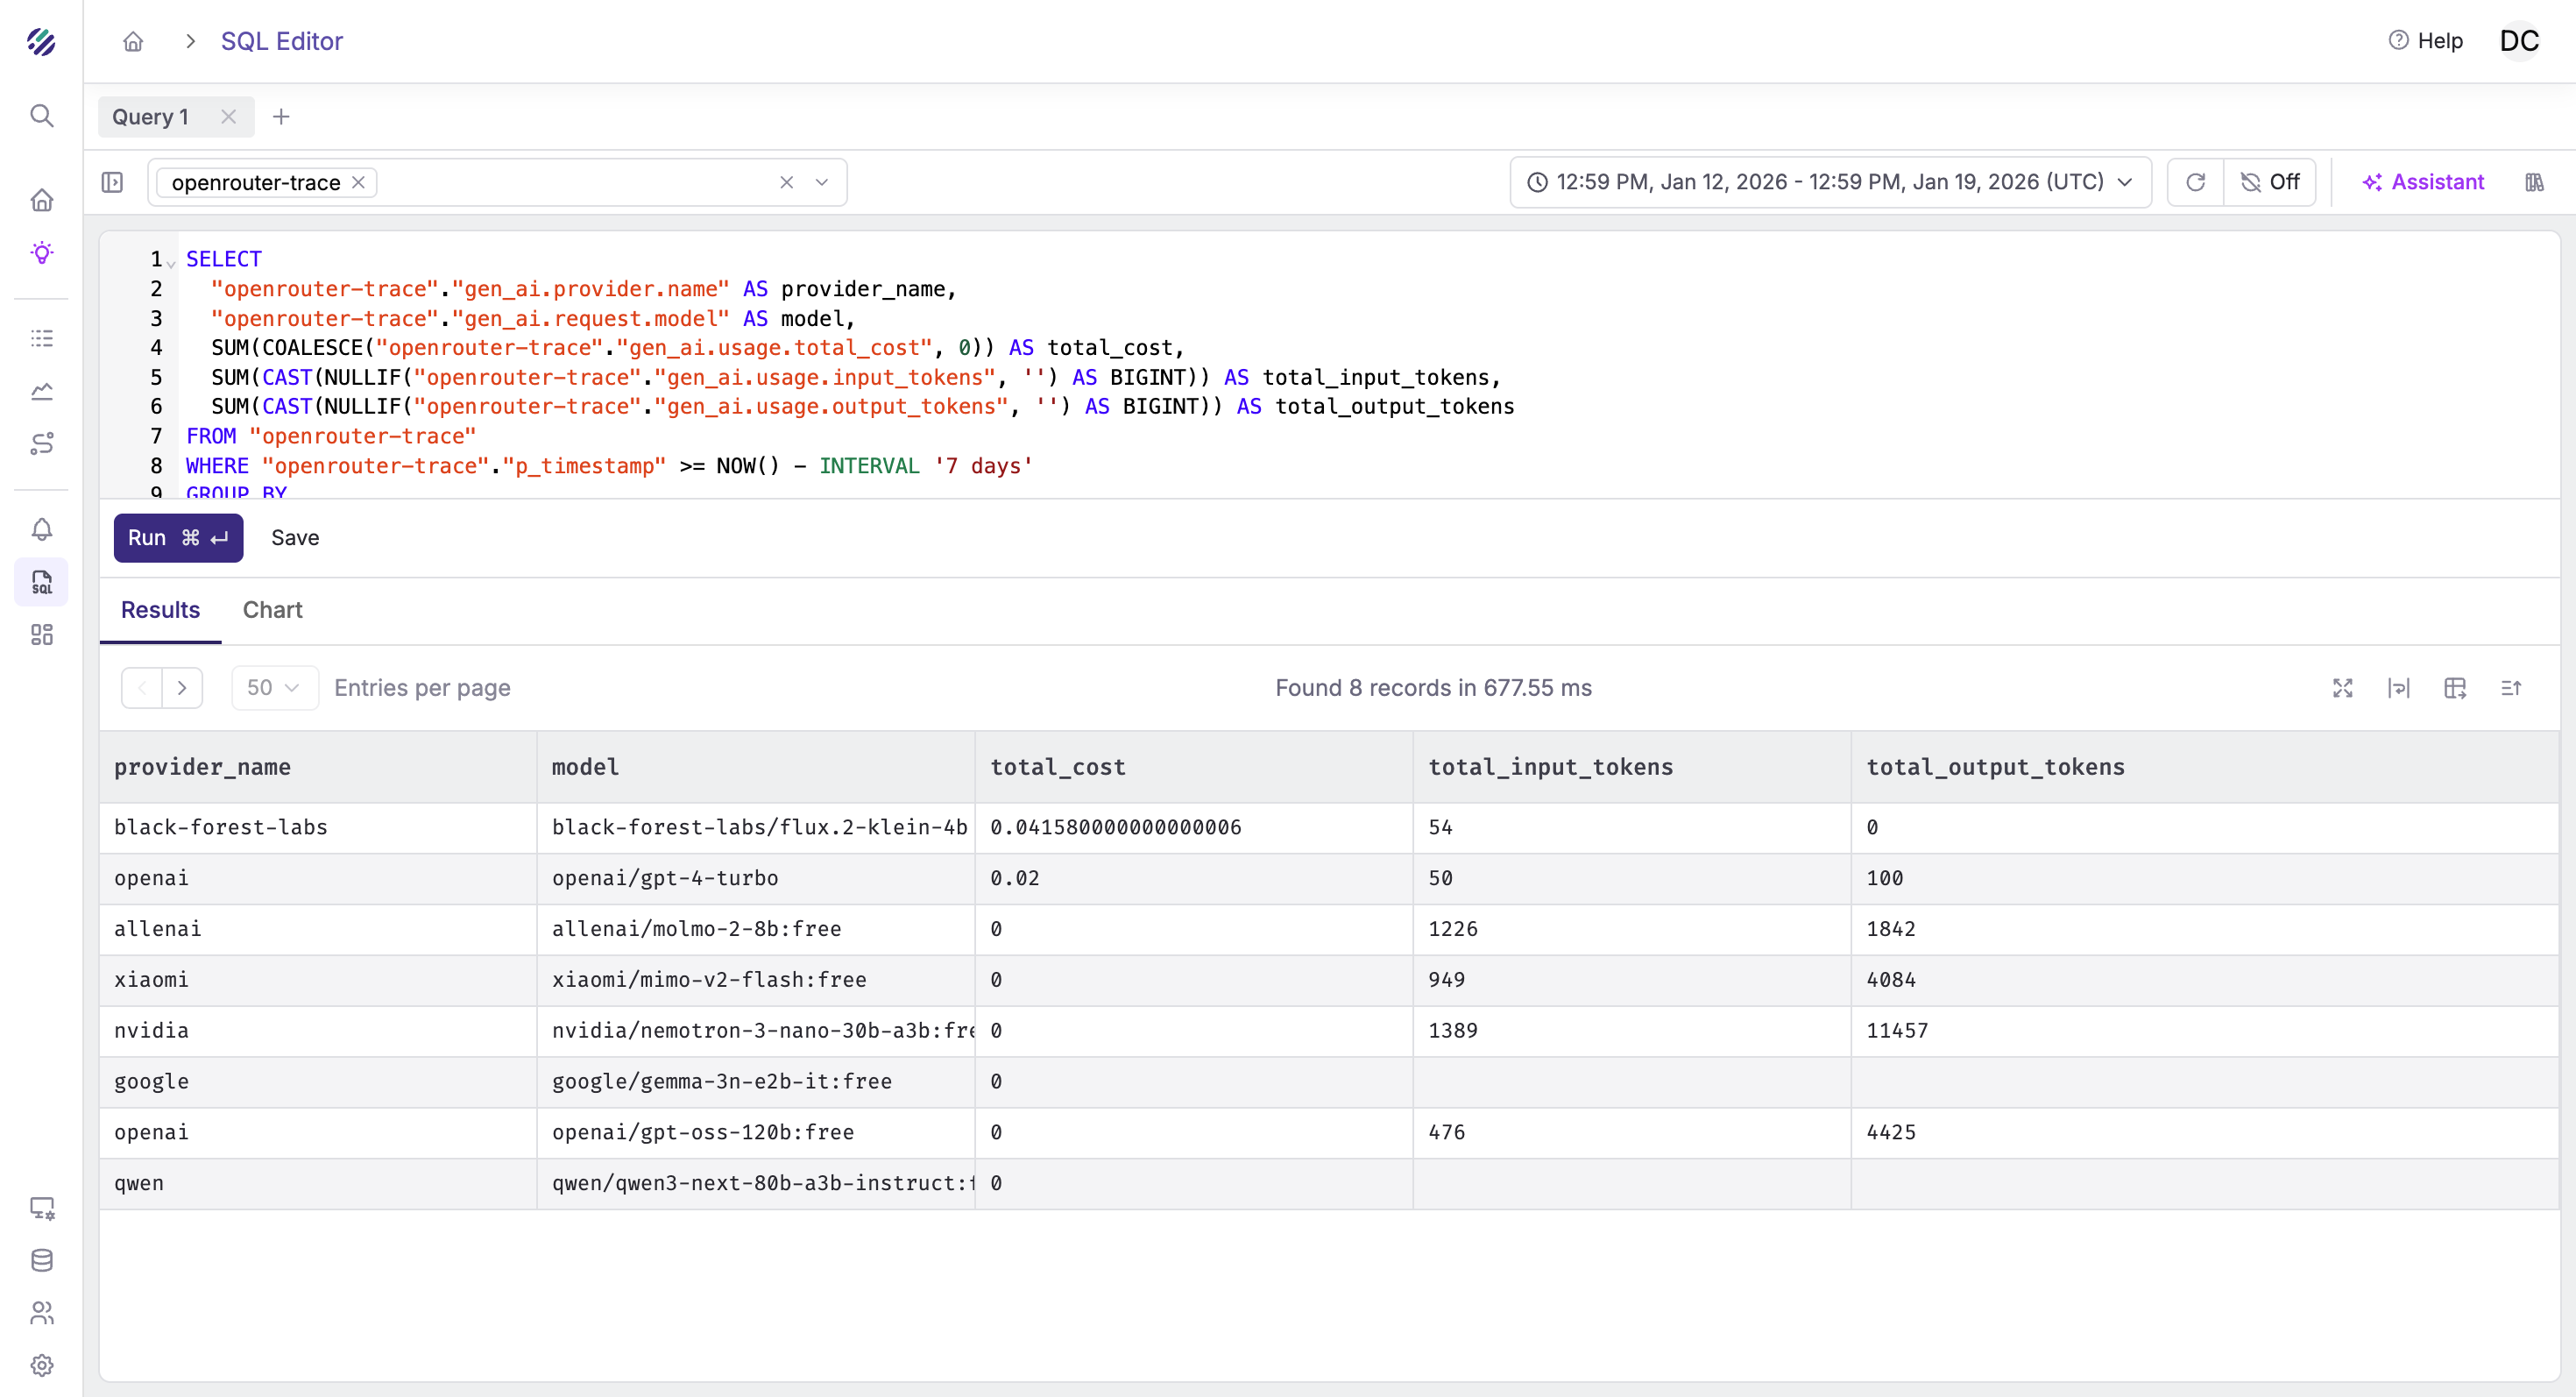
Setting Up Alerts
Parseable's alerting system helps you catch issues proactively.
High Cost Alert
Monitor when daily LLM spend exceeds budget:
- Navigate to Alerts → Create Alert
- Configure:
- Dataset:
openrouter-traces - Monitor Field:
gen_ai.usage.cost - Aggregation:
SUM - Alert Type: Threshold
- Condition: Greater than your daily budget (e.g.,
100for $100) - Evaluation Window: 24 hours
- Dataset:
Latency Spike Alert
Detect when response times degrade:
- Create a new alert
- Configure:
- Dataset:
openrouter-traces - Monitor Field:
span_duration_ns - Aggregation:
AVG - Alert Type: Anomaly Detection
- Sensitivity: Medium
- Historical Window: 7 days
- Dataset:
Error Rate Alert
Get notified when error rates increase:
- Create a new alert
- Configure:
- Dataset:
openrouter-traces - Filter:
span_status_code = 2 - Monitor Field: Count of matching rows
- Alert Type: Threshold
- Condition: Greater than your acceptable error count
- Dataset:
Building Dashboards
Create a comprehensive LLM observability dashboard in Parseable:
Recommended Panels
- Request Volume: Time series of requests per hour
- Token Usage: Stacked bar chart of input vs output tokens by model
- Cost Tracking: Running total of daily/weekly/monthly spend
- Latency Distribution: Histogram of response times
- Model Breakdown: Pie chart of requests by model
- Top Users: Table of highest-volume users
- Error Timeline: Time series of errors with model breakdown
Dashboard Query Examples
Hourly request volume:
SELECT
  DATE_TRUNC('hour', p_timestamp) AS hour,
  COUNT(*) AS requests
FROM "openrouter-traces"
WHERE p_timestamp > NOW() - INTERVAL '7 days'
GROUP BY hour
ORDER BY hour;
Daily cost trend:
SELECT
  DATE_TRUNC('day', p_timestamp) AS day,
  SUM(CAST("gen_ai.usage.cost" AS DOUBLE)) AS daily_cost
FROM "openrouter-traces"
WHERE p_timestamp > NOW() - INTERVAL '30 days'
GROUP BY day
ORDER BY day;
Multiple Destinations
OpenRouter supports up to 5 destinations of the same type. Use this for:
- Environment separation: Production traces to one stream, development to another
- Different retention policies: High-fidelity short-term storage + sampled long-term archive
- Team isolation: Different teams get their own trace streams
Example setup:
| Destination | Stream | Sampling | API Keys |
|---|---|---|---|
| Production | openrouter-prod | 10% | prod-* keys |
| Development | openrouter-dev | 100% | dev-* keys |
| Debugging | openrouter-debug | 100% | Specific key for debugging |
Conclusion
OpenRouter Broadcast + Parseable gives you production-grade LLM observability without touching your application code:
- Zero instrumentation: No SDK, no collector, no code changes
- Complete visibility: Every request traced with full metadata
- SQL-powered analysis: Query your LLM usage like a database
- Cost-effective: Object storage pricing, not per-span fees
- 5-minute setup: Configuration only, no deployment
The combination is particularly powerful for teams that:
- Use multiple LLM providers through OpenRouter
- Want observability without infrastructure overhead
- Need to track costs and usage across users/sessions
- Require long-term trace retention for compliance or analysis
Start with 100% sampling in development, dial it down for production, and let the traces flow. Your future self debugging a production issue will thank you.

