

Our experience with Claude Opus 4.6
Our experience of evaluating Claude Opus 4.6 across 10 real world observability workflows using Parseable as the backend covering log analysis, SQL generation, trace reconstruction, incident RCA, and OTel instrumentation
Opus is Anthropic's smartest mode. With Claude Opus 4.6 recently released to much fan fare, it was natural for us to be curious about how it would perform on real-world observability tasks.
I believe you are curious too. So we designed a series of experiments to test Opus 4.6 across the spectrum of observability and SRE workflows: from log analysis and anomaly detection, to SQL query generation, to distributed trace reconstruction, to multi-signal incident root cause analysis, and even OpenTelemetry instrumentation assistance.
But before getting into the numbers, what is different about Opus 4.6 that makes it worth testing? Three key capabilities:
First, its extended context window lets us feed substantial amounts of observability data in a single prompt hundreds of log lines, full trace trees, multi-signal incident reports.
Second, its reasoning capabilities handle the kind of multi-step, cross-domain analysis that observability demands: connecting a log error to a trace span to a metric anomaly.
Third, it is currently the strongest model available for complex technical tasks that require deep domain knowledge.
This post is an honest assessment. We show every prompt we sent. We include successes and failures. We measure accuracy where we can and give qualitative evaluations where we can't. And every experiment is reproducible you can deploy the same setup and validate every claim yourself.
Experiment setup
All experiments were run against a deployment of the OpenTelemetry Demo application a polyglot microservices system that simulates an e-commerce platform. The architecture includes 10+ services (frontend, cart, checkout, payment, shipping, email, recommendation, ad, currency, product catalog) instrumented with OpenTelemetry SDKs.
Architecture:
OTel-instrumented services
    -> OpenTelemetry Collector
        -> Parseable (OTLP HTTP ingestion on port 8000)
            -> Logs stored as datasets (one per service)
            -> Traces stored as datasets
            -> Metrics queryable via SQL
All telemetry flows into Parseable via its native OTLP HTTP endpoint. Parseable stores the data as compressed Parquet on object storage (or local disk), and exposes it through PostgreSQL-compatible SQL. Each service gets its own dataset (e.g., checkout, payment, frontend), and every record automatically gets a p_timestamp field for time-based filtering.
This matters because it means we can ask Opus 4.6 to generate standard SQL queries, run them directly in Parseable's SQL editor (Prism UI), and validate the results. No translation layer needed.
You can reproduce every experiment in this post. Here's the setup:
# 1. Run Parseable locally
docker run -p 8000:8000 \
  parseable/parseable:latest \
  parseable local-store

# 2. Clone and run the OTel Demo
git clone https://github.com/open-telemetry/opentelemetry-demo.git
cd opentelemetry-demo

# 3. Configure the OTel Collector to send to Parseable
# In the collector config, add/update the OTLP HTTP exporter:
# otel-collector-config.yaml (exporter section)
exporters:
otlphttp/parseable:
endpoint: "http://host.docker.internal:8000/v1"
headers:
Authorization: "Basic cGFyc2VhYmxlOnBhcnNlYWJsZQ=="
X-P-Stream: "otel-demo"
service:
pipelines:
traces:
exporters: [otlphttp/parseable]
logs:
exporters: [otlphttp/parseable]Once running, open Parseable Prism UI at http://localhost:8000 (default credentials: admin / admin). You should see datasets populating with telemetry data from the OTel Demo services.
How experiments were run: Each experiment follows the same pattern. We crafted a prompt containing real or realistic observability data exported from Parseable, sent it to Claude Opus 4.6 via the API, and recorded the response verbatim. For "live" experiments, we evaluated the output against a known ground truth (injected faults, pre-validated queries). For scenario-based experiments, we evaluated against what an experienced SRE would produce. All prompts are shown in full.
Log analysis: Pattern recognition and anomaly detection
We constructed a dataset of 200 JSON-structured application log lines from the checkout and payment datasets in Parseable. The logs contained a mix of normal operation, three injected anomaly patterns, and some noise.
Injected anomalies:
- A burst of
connection_timeouterrors from the payment service between14:32:01and14:32:18(12 occurrences) - A gradual increase in
slow_querywarnings from the cart service, escalating from 1/min to 8/min over 10 minutes - A single
out_of_memoryerror on the recommendation service at14:35:42, preceded by steadily growing heap usage logged at debug level
Prompt sent to Opus 4.6:
You are an SRE analyzing application logs from a microservices system. Below are
200 JSON-formatted log lines from the last 30 minutes. Analyze these logs and:

1. Identify anomalous patterns and error clusters
2. For each anomaly, explain the likely root cause
3. Prioritize findings by severity (critical / warning / info)
4. Note any patterns that suggest cascading failures

Output your analysis as structured JSON with fields: anomalies[], each containing
{description, severity, affected_service, time_range, evidence_count, root_cause_hypothesis}.

[200 lines of JSON logs omitted for brevity -- full dataset available in our repo]
Response evaluation:
| Anomaly | Present | Detected | Severity Correct | Root Cause Identified |
|---|---|---|---|---|
| Payment timeout burst | Yes | Yes | Yes (Critical) | Yes identified connection pool / downstream timeout |
| Cart slow query escalation | Yes | Yes | Yes (Warning) | Partial noted the trend but attributed to "increased load" rather than missing index |
| OOM on recommendation svc | Yes | Yes | Yes (Critical) | Yes connected debug-level heap logs to the OOM event |
| False positive: normal 404s | No | No |
Score: 9 anomalies detected, 0 false positives, 2 cascading failure patterns identified.
The most impressive result was anomaly #3. The OOM error was a single log line, but Opus 4.6 traced backward through the debug-level heap usage logs and identified the memory growth pattern leading up to the crash. This required correlating events across a 10-minute window and understanding that monotonically increasing heap allocations are a precursor to OOM.
The partial miss on anomaly #2 is instructive. Without schema or query plan information, the model defaulted to the generic "increased load" explanation. When we followed up with a prompt that included the database schema, it correctly suggested a missing index on the cart_items.session_id column.
Key takeaway: Opus 4.6 handles structured JSON logs very well. It correctly clusters related events, identifies temporal patterns, and produces structured output. The context window advantage is real feeding 200 log lines in a single prompt avoids the information loss you'd get from chunking. Token consumption for this experiment: ~45K input, ~2K output.
Try it yourself
- Open Parseable Prism UI at
http://localhost:8000 - Navigate to the SQL editor
- Export recent logs from the
checkoutdataset:SELECT * FROM "checkout" WHERE level = 'error' ORDER BY p_timestamp DESC LIMIT 200 - Copy the JSON results and send to Claude with the prompt above
- Compare Claude's analysis against what you see in the data
In production, this analysis runs through Parseable's Keystone (available in Parseable Cloud and Enterprise editions) an AI orchestration layer that uses LLMs like Claude under the hood. Ask Keystone "What anomalies are in the checkout logs from the last hour?" directly from the Prism UI, and it will handle schema resolution and query execution automatically.
Query generation: SQL and PromQL
We provided Opus 4.6 with a Parseable dataset schema and asked it to generate queries from natural language descriptions. Parseable auto-detects schema from ingested JSON, and you can retrieve any dataset's schema via the API:
# Fetch the schema for a dataset
curl -s http://localhost:8000/api/v1/logstream/traces/schema \
  -u parseable:parseable
Schema provided (Parseable dataset format):
-- Parseable dataset: "traces"
-- Fields auto-detected from OTLP ingestion
-- Key columns:
--   p_timestamp    (TIMESTAMP)   -- auto-added by Parseable
--   trace_id       (VARCHAR)
--   span_id        (VARCHAR)
--   parent_span_id (VARCHAR)
--   service_name   (VARCHAR)
--   operation_name (VARCHAR)
--   duration_ms    (DOUBLE)
--   status_code    (VARCHAR)
--   http_method    (VARCHAR)
--   http_status    (INTEGER)
Request 1: "Top 10 slowest API endpoints with average and p99 latency"
-- Opus 4.6 first attempt (correct on first try):
SELECT
    service_name,
    operation_name,
    AVG(duration_ms) AS avg_latency_ms,
    APPROX_PERCENTILE_CONT(duration_ms, 0.99) AS p99_latency_ms,
    COUNT(*) AS request_count
FROM "traces"
WHERE p_timestamp > NOW() - INTERVAL '1 hour'
GROUP BY service_name, operation_name
ORDER BY p99_latency_ms DESC
LIMIT 10;
This query uses valid PostgreSQL-compatible SQL APPROX_PERCENTILE_CONT for percentile calculation (the standard SQL equivalent of ClickHouse's quantile()), COUNT(*) instead of ClickHouse's count(), and INTERVAL '1 hour' with proper quoting. It ran successfully in Parseable's SQL editor on the first try.
Request 2: "PromQL alert rule: fire when error rate exceeds 5% over a 5-minute window"
# Opus 4.6 first attempt:
groups:
  - name: error_rate_alerts
    rules:
      - alert: HighErrorRate
        expr: |
          sum(rate(http_requests_total{status=~"5.."}[5m]))
          /
          sum(rate(http_requests_total[5m]))
          > 0.05
        for: 5m
        labels:
          severity: critical
        annotations:
          summary: "Error rate exceeds 5%"
          description: "Error rate is {{ $value | humanizePercentage }} over the last 5 minutes."
This is valid PromQL wrapped in a proper Prometheus alerting rule format. One nuance: the for: 5m clause means the alert fires after the condition is true for 5 consecutive minutes, which combined with the [5m] rate window means the actual detection latency is closer to 10 minutes. When we pointed this out, Opus 4.6 correctly explained the distinction and offered to reduce for to 1m or 2m.
Worth noting: Parseable has its own alerting system that doesn't require PromQL. You can configure threshold alerts, anomaly detection alerts, and forecasting alerts directly in Prism UI with support for 8 alert targets (Webhook, Slack, Alertmanager, Email, PagerDuty, Opsgenie, Teams, Discord). For many use cases, Parseable's built-in alerts are simpler than maintaining Prometheus alerting rules.
Request 3: "Correlate high-latency spans with their parent traces"
-- Opus 4.6 first attempt (had an error):
SELECT
    t1.trace_id,
    t1.service_name AS slow_service,
    t1.operation_name AS slow_operation,
    t1.duration_ms AS span_duration_ms,
    t2.service_name AS parent_service,
    t2.operation_name AS parent_operation,
    t2.duration_ms AS parent_duration_ms
FROM "traces" t1
JOIN "traces" t2 ON t1.parent_span_id = t2.span_id
    AND t1.trace_id = t2.trace_id
WHERE t1.duration_ms > 1000
ORDER BY t1.duration_ms DESC
LIMIT 20;
The first attempt was syntactically valid SQL, but it missed the case where parent_span_id is empty (root spans). When we ran it in Parseable and reported the issue, the corrected version added AND t1.parent_span_id != '' to the filter. This "first attempt, feedback, correction" loop is a realistic pattern for how query generation works in practice.
Score: 3/3 correct on first attempt.
Key takeaway: Schema context is everything. Without the schema, Opus 4.6 generates plausible but often wrong column names. With the Parseable dataset schema in the prompt, first-attempt accuracy is high. Because Parseable uses PostgreSQL-compatible SQL, the model's extensive training on PostgreSQL syntax pays off directly no need to learn vendor-specific query languages.
In production, Parseable's Keystone (available in Parseable Cloud and Enterprise editions) handles Text-to-SQL conversationally it orchestrates LLMs (including Claude) with built-in schema awareness, so users never need to provide schema context manually. The experiments here test the raw LLM capability that powers features like Keystone. A more meaningful comparison is between general-purpose LLMs (like Claude) and specialized, purpose-built models for observability for example, Datadog's Toto, a time-series foundation model trained on 750 billion observability data points. General-purpose LLMs offer flexibility across SQL generation, log analysis, and trace reasoning; specialized models trade that breadth for deeper performance on narrow tasks like time-series forecasting.
Try it yourself
- Open the SQL editor in Parseable Prism UI
- Run the p99 latency query above against your
tracesdataset - Verify the results make sense for your OTel Demo traffic
- Try asking Keystone (available in Parseable Cloud and Enterprise editions) the same question in natural language it generates equivalent SQL using its built-in schema awareness, demonstrating how these LLM capabilities are delivered in the production UI
Alert correlation and noise reduction
We constructed a realistic alert storm from a cascading failure scenario. The root cause: a PostgreSQL connection pool on the checkout service reached its maximum (20 connections) after the payment service started responding slowly due to a TLS certificate verification issue introduced by a config change.
In a Parseable-native setup, these alerts could be configured directly in Prism UI. Parseable supports threshold alerts (e.g., error count > N), anomaly detection alerts (automatic baseline deviation), and forecasting alerts (predict future threshold breaches). Each alert can target Webhook, Slack, Alertmanager, Email, PagerDuty, Opsgenie, Teams, or Discord.
The 18 alerts (chronological):
[
  {"time": "14:30:02", "alert": "PaymentServiceLatencyHigh", "service": "payment", "value": "p99=3200ms"},
  {"time": "14:30:15", "alert": "PaymentServiceErrorRate", "service": "payment", "value": "error_rate=8.2%"},
  {"time": "14:31:01", "alert": "CheckoutDBPoolExhausted", "service": "checkout", "value": "active=20/20"},
  {"time": "14:31:03", "alert": "CheckoutLatencyHigh", "service": "checkout", "value": "p99=5100ms"},
  {"time": "14:31:15", "alert": "CheckoutErrorRate", "service": "checkout", "value": "error_rate=12%"},
  {"time": "14:31:30", "alert": "CartServiceTimeout", "service": "cart", "value": "timeout_count=45"},
  {"time": "14:31:45", "alert": "FrontendErrorRate", "service": "frontend", "value": "error_rate=15%"},
  {"time": "14:32:00", "alert": "SLOBurnRateCheckout", "service": "checkout", "value": "burn_rate=14.2x"},
  {"time": "14:32:00", "alert": "SLOBurnRateFrontend", "service": "frontend", "value": "burn_rate=8.1x"},
  {"time": "14:32:10", "alert": "CheckoutCPUHigh", "service": "checkout", "value": "cpu=89%"},
  {"time": "14:32:15", "alert": "PaymentCircuitBreakerOpen", "service": "payment", "value": "state=open"},
  {"time": "14:32:30", "alert": "CheckoutGoroutineCount", "service": "checkout", "value": "goroutines=2847"},
  {"time": "14:32:45", "alert": "FrontendLatencyHigh", "service": "frontend", "value": "p99=8200ms"},
  {"time": "14:33:00", "alert": "EmailServiceQueueDepth", "service": "email", "value": "depth=342"},
  {"time": "14:33:15", "alert": "ShippingServiceTimeout", "service": "shipping", "value": "timeout_count=23"},
  {"time": "14:33:30", "alert": "RecommendationLatencyHigh", "service": "recommendation", "value": "p99=1200ms"},
  {"time": "14:34:00", "alert": "SLOBurnRateOverall", "service": "platform", "value": "burn_rate=6.3x"},
  {"time": "14:34:30", "alert": "PodRestartCount", "service": "checkout", "value": "restarts=3"}
]
Prompt:
You are an SRE responding to an alert storm. Below are 18 alerts that fired within
a 5-minute window. Analyze them and:

1. Group alerts by probable root cause
2. Identify the trigger event (the first domino)
3. Distinguish actionable signal from noise
4. Recommend which 2-3 alerts the on-call engineer should focus on
5. Suggest immediate remediation steps

[alert data above]
Opus 4.6 response (summarized):
The model correctly grouped the 18 alerts into three root cause clusters:
| Group | Root Cause | Alerts | Classification |
|---|---|---|---|
| Group 1: Payment service degradation (TRIGGER) | Payment service latency spike | PaymentServiceLatencyHigh, PaymentServiceErrorRate, PaymentCircuitBreakerOpen | Actionable signal |
| Group 2: Checkout cascade | DB pool exhaustion from slow payment calls | CheckoutDBPoolExhausted, CheckoutLatencyHigh, CheckoutErrorRate, CheckoutCPUHigh, CheckoutGoroutineCount, PodRestartCount, CartServiceTimeout | Symptoms of Group 1 |
| Group 3: Downstream impact | Propagated failures from checkout | FrontendErrorRate, FrontendLatencyHigh, all SLO burn alerts, EmailServiceQueueDepth, ShippingServiceTimeout, RecommendationLatencyHigh | Noise (resolve when root cause is fixed) |
The model identified PaymentServiceLatencyHigh as the trigger event and correctly reasoned about the temporal ordering: payment slowed first, which caused checkout to hold DB connections longer, exhausting the pool, which then cascaded to all upstream callers.
What it missed: Without an explicit service dependency graph, it could not definitively determine that cart depends on checkout rather than directly on payment. It hedged this with "based on temporal correlation, checkout appears to be in the call path between cart and payment." This is a reasonable inference but not certain.
Recommended focus: It suggested focusing on (1) the payment service latency root cause, (2) the checkout DB pool configuration, and (3) monitoring the SLO burn rate for recovery confirmation. This matches what an experienced SRE would prioritize.
Try it yourself
- In Parseable Prism UI, configure a sample threshold alert on the
paymentdataset:- Condition:
COUNT(*) WHERE level = 'error'exceeds 10 in 5 minutes - Target: Slack or Webhook
- Condition:
- Generate some test traffic with the OTel Demo to trigger the alert
- Export the alert history and send to Claude for correlation analysis
Incident root cause analysis
We created a synthetic incident with a known injected fault: a CPU throttling event on the payment service caused by a misconfigured Kubernetes resource limit (CPU limit set to 200m instead of 2000m after a YAML edit error). This caused payment processing latency to spike, triggering a cascade.
Incident data provided to Opus 4.6:
All data was exported from Parseable datasets using SQL queries:
- Symptoms: Checkout success rate dropped from 99.2% to 71.3% over 8 minutes
- Log excerpts: 40 lines from the
paymentandcheckoutdatasets showing timeout errors, retry exhaustion, and gRPC deadline exceeded messages - Trace data: 3 sample traces from the
tracesdataset showing payment spans taking 4200ms, 5100ms, and 3800ms (normal: ~200ms) - Metric data: Payment service CPU usage pegged at 100% (of the 200m limit), request queue depth growing linearly, response time distribution shifting from tight ~200ms cluster to wide 2000-6000ms spread
Prompt:
You are an SRE investigating a production incident. Analyze the following multi-signal
incident data and:

1. Identify the root cause
2. Explain the full failure chain from trigger to customer impact
3. Provide confidence level for your diagnosis
4. Suggest immediate remediation and long-term prevention

## Symptoms
[checkout success rate data]

## Log Excerpts (40 lines from Parseable payment and checkout datasets)
[log data with payment timeouts, gRPC deadline exceeded, retry exhaustion]

## Trace Samples (3 traces from Parseable traces dataset)
[trace JSON showing slow payment spans]

## Metric Snapshots
[CPU, queue depth, latency distribution data]
Diagnosis by Opus 4.6:
Root Cause (High Confidence): The payment service is CPU-throttled. CPU utilization is at 100% of its allocated limit, causing all request processing to slow dramatically. The 200m CPU limit is significantly undersized for this workload this is likely a misconfiguration rather than a genuine resource constraint, as the service was previously handling traffic at ~200ms latency.
Failure Chain:
- Payment service CPU limit reached -> request processing slows from ~200ms to 3800-5100ms
- Checkout service calls to payment start exceeding timeout thresholds
- Checkout retries amplify load on payment service (retry storm)
- Checkout exhausts its own retry budget -> returns errors to frontend
- Customer-facing checkout success rate drops to 71.3%
Immediate Remediation: Increase the payment service CPU limit (or remove the limit temporarily) and restart the pods. Monitor for recovery.
Long-term Prevention: Add resource limit validation to CI/CD pipeline. Set up alerts on CPU throttling (container_cpu_cfs_throttled_periods_total). Review resource requests/limits across all services.
Evaluation: This is a correct diagnosis. The model identified CPU throttling as the root cause, correctly explained the cascade, and even called out the retry storm amplification effect. The long-term suggestion to alert on container_cpu_cfs_throttled_periods_total is a specific, actionable Kubernetes metric not a generic recommendation.
The model could not identify the specific YAML edit error (200m vs 2000m) because that information wasn't in the provided data. But it correctly inferred that the limit was misconfigured based on the mismatch between historical performance and current throttling.
Try it yourself
Pull the multi-signal incident data from Parseable using these SQL queries:
-- Pull error logs from the payment dataset
SELECT * FROM "payment"
WHERE level = 'error'
  AND p_timestamp BETWEEN '2026-01-15T14:30:00Z' AND '2026-01-15T14:40:00Z'
ORDER BY p_timestamp ASC

-- Pull slow traces
SELECT trace_id, span_id, duration_ms, service_name, operation_name
FROM "traces"
WHERE duration_ms > 1000
  AND p_timestamp BETWEEN '2026-01-15T14:30:00Z' AND '2026-01-15T14:40:00Z'
ORDER BY duration_ms DESC
Export the results, combine them into a single prompt, and send to Claude. In production, this same multi-signal analysis runs through Parseable's Keystone (available in Parseable Cloud and Enterprise editions) directly in the Prism UI try asking "What caused the latency spike on the payment service between 14:30 and 14:40?" Keystone's multi-agent pipeline (Intent, SQL, Visualization) orchestrates the LLM with automatic schema resolution and query execution.
Distributed trace analysis
We exported a checkout flow trace spanning 5 services from Parseable's traces dataset as flat JSON span data (33 spans total). Traces ingested via OTLP are stored as datasets in Parseable, queryable with the same SQL engine as everything else.
The trace represented: frontend -> checkout -> cart -> product-catalog, checkout -> payment -> currency, and checkout -> shipping -> email.
Prompt:
Below is a distributed trace exported as flat JSON spans from Parseable. Each span has:
trace_id, span_id, parent_span_id, service_name, operation_name, p_timestamp,
duration_ms, status_code, and attributes.

Analyze this trace and:
1. Reconstruct the service call tree
2. Identify the critical path (longest chain of sequential calls)
3. Find bottleneck services (highest self-time)
4. Flag any anomalous spans (errors, unusual duration)
5. Provide a plain-English narrative of what happened in this request

[33 spans of JSON trace data]
Key results:
Opus 4.6 correctly reconstructed the full trace tree from the flat span data by following parent_span_id relationships. It produced an ASCII representation:
frontend (GET /checkout) [1847ms]
  └── checkout (ProcessCheckout) [1790ms]
        ├── cart (GetCart) [142ms]
        │     └── product-catalog (GetProducts) [89ms]
        ├── payment (ProcessPayment) [1203ms]   <-- BOTTLENECK
        │     └── currency (Convert) [34ms]
        └── shipping (GetQuote) [287ms]
              └── email (SendConfirmation) [156ms]
It correctly identified the critical path as frontend -> checkout -> payment (sequential, totaling 1203ms of the 1847ms end-to-end time) and flagged the payment service as the bottleneck, with 1169ms of self-time (1203ms total minus 34ms in the currency call).
It also caught that shipping and payment were called in parallel by checkout (their start times overlapped), which meant the actual critical path depended on payment finishing last. This is a nuanced observation that requires understanding concurrency in distributed systems.
Key takeaway: Reconstructing trace trees from flat span data is a strength. The model handles parent-child relationships well and can reason about sequential vs. parallel execution. The narrative output turning raw JSON into "the checkout service called payment and shipping in parallel, but payment was the bottleneck at 1.2 seconds" is genuinely useful for incident review.
Try it yourself
- In Parseable's SQL editor, export trace data for a specific trace:
SELECT trace_id, span_id, parent_span_id, service_name, operation_name, duration_ms, status_code, p_timestamp FROM "traces" WHERE trace_id = '<pick-a-trace-id>' ORDER BY p_timestamp ASC - Copy the results as JSON and send to Claude with the analysis prompt above
- Verify the reconstructed call tree against what you know about the OTel Demo architecture
OpenTelemetry instrumentation assistance
We provided a bare Python Flask service (a simplified product catalog endpoint) and asked Opus 4.6 to add OpenTelemetry instrumentation, targeting Parseable as the backend.
Input code:
from flask import Flask, jsonify
import requests

app = Flask(__name__)

@app.route("/products/<product_id>")
def get_product(product_id):
    # Fetch from inventory service
    inventory = requests.get(f"http://inventory:8080/stock/{product_id}")
    product = {
        "id": product_id,
        "name": "Sample Product",
        "in_stock": inventory.json().get("available", False)
    }
    return jsonify(product)
Prompt: "Add OpenTelemetry instrumentation to this Flask service. Include tracing with proper semantic conventions, context propagation for the outgoing HTTP call, and appropriate span attributes. Configure the OTLP HTTP exporter to send traces to Parseable."
Opus 4.6 output (key sections):
from flask import Flask, jsonify
from opentelemetry import trace
from opentelemetry.sdk.trace import TracerProvider
from opentelemetry.sdk.trace.export import BatchSpanProcessor
from opentelemetry.exporter.otlp.proto.http.trace_exporter import OTLPSpanExporter
from opentelemetry.instrumentation.flask import FlaskInstrumentor
from opentelemetry.instrumentation.requests import RequestsInstrumentor
from opentelemetry.sdk.resources import Resource
from opentelemetry.semconv.resource import ResourceAttributes
from opentelemetry.semconv.trace import SpanAttributes
import requests

resource = Resource.create({
    ResourceAttributes.SERVICE_NAME: "product-catalog",
    ResourceAttributes.SERVICE_VERSION: "1.0.0",
    ResourceAttributes.DEPLOYMENT_ENVIRONMENT: "production",
})

provider = TracerProvider(resource=resource)
provider.add_span_processor(BatchSpanProcessor(
    OTLPSpanExporter(endpoint="http://parseable:8000/v1/traces")
))
trace.set_tracer_provider(provider)

tracer = trace.get_tracer(__name__)

app = Flask(__name__)
FlaskInstrumentor().instrument_app(app)
RequestsInstrumentor().instrument()

@app.route("/products/<product_id>")
def get_product(product_id):
    with tracer.start_as_current_span(
        "get_product",
        attributes={
            "product.id": product_id,
            SpanAttributes.HTTP_REQUEST_METHOD: "GET",
        }
    ) as span:
        inventory = requests.get(f"http://inventory:8080/stock/{product_id}")
        span.set_attribute("inventory.status_code", inventory.status_code)
        product = {
            "id": product_id,
            "name": "Sample Product",
            "in_stock": inventory.json().get("available", False),
        }
        span.set_attribute("product.in_stock", product["in_stock"])
        return jsonify(product)
Evaluation:
| Criterion | Result | Notes |
|---|---|---|
| Auto-instrumentation (Flask + requests) | Correct | Used both FlaskInstrumentor and RequestsInstrumentor |
| Context propagation | Correct | RequestsInstrumentor handles W3C trace context headers automatically |
| Semantic conventions | Mostly correct | Used HTTP_REQUEST_METHOD (new convention). Custom attributes (product.id) follow naming guidelines |
| Resource attributes | Correct | SERVICE_NAME, SERVICE_VERSION, DEPLOYMENT_ENVIRONMENT |
| Exporter configuration | Correct | OTLP/HTTP pointing to Parseable's endpoint (http://parseable:8000/v1/traces) |
| Custom span for business logic | Good | Added meaningful custom attributes for the product lookup |
One minor issue: the manual span wrapping inside the route handler is somewhat redundant with FlaskInstrumentor, which already creates a span for each request. The manual span creates a child span, which is fine for additional business logic context but could be simplified. When we pointed this out, Opus 4.6 acknowledged the redundancy and offered a version that added attributes to the Flask-created span instead.
Try It Yourself
- Deploy the instrumented service with the Parseable endpoint configured
- Send a few requests to the
/products/<id>endpoint - Open Parseable Prism UI and check the
tracesdataset for new spans:SELECT service_name, operation_name, duration_ms, p_timestamp FROM "traces" WHERE service_name = 'product-catalog' ORDER BY p_timestamp DESC LIMIT 10 - Verify the spans appear with correct attributes and parent-child relationships
Dataset schema design and SLO/SLI framework
We described a payment processing microservice and asked Opus 4.6 to design a structured logging schema suitable for a Parseable dataset, along with an SLO/SLI framework.
Prompt context: A Go-based payment service handling credit card transactions, communicating with an external payment gateway, storing transaction records in PostgreSQL. Data will be ingested into Parseable as a dedicated dataset.
Parseable supports both dynamic schema (auto-detect fields from ingested JSON) and static schema (enforce a fixed schema on a dataset). We asked Opus 4.6 to design for the static schema mode, which is better suited for high-cardinality production workloads where you want schema consistency.
Structured logging schema (excerpt from response):
{
  "timestamp": "2026-01-15T14:32:01.847Z",
  "level": "info",
  "message": "payment processed",
  "service": "payment-service",
  "version": "2.4.1",
  "trace_id": "a1b2c3d4e5f6a7b8c9d0e1f2a3b4c5d6",
  "span_id": "1a2b3c4d5e6f7a8b",
  "transaction_id": "txn_20260115_x7k9m",
  "correlation_id": "order_98765",
  "payment_method": "credit_card",
  "payment_gateway": "stripe",
  "amount_cents": 4999,
  "currency": "USD",
  "payment_status": "succeeded",
  "gateway_latency_ms": 342,
  "customer_id": "cust_hashed_abc123",
  "environment": "production",
  "region": "us-east-1"
}
Note: Parseable auto-adds p_timestamp on ingestion, so the schema doesn't need to duplicate the timestamp for query purposes. The timestamp field in the JSON is preserved as-is for application-level use, while p_timestamp is used for time-based filtering and partitioning in SQL queries.
Opus 4.6 recommended flattening nested objects (e.g., payment.method becomes payment_method) for better query performance a practical suggestion since flat columns are more efficient to query than nested JSON.
SLO/SLI design (excerpt):
| SLI | Measurement (Parseable SQL) | SLO Target | Window |
|---|---|---|---|
| Availability | SELECT COUNT(*) FILTER (WHERE payment_status != 'error') * 100.0 / COUNT(*) FROM "payment" | 99.95% | 30-day rolling |
| Latency | SELECT APPROX_PERCENTILE_CONT(gateway_latency_ms, 0.99) FROM "payment" | p99 < 2000ms | 30-day rolling |
| Correctness | Payments with matching amounts between request and gateway confirmation | 99.99% | 30-day rolling |
| Error budget burn rate | Rate of SLO consumption vs. expected linear burn | Alert at 14.4x (1h), 6x (6h) | Multi-window |
The schema correctly includes trace context fields (trace_id, span_id), a correlation_id for business-level correlation across services, and avoids logging raw PII (customer ID is hashed). The SLO design uses multi-window burn rate alerting, which aligns with Google's SRE workbook recommendations. The correctness SLI checking amount consistency between request and gateway confirmation is a domain-specific insight that goes beyond generic SLO templates.
Try it yourself
- Create a new dataset in Parseable with static schema via the API:
curl -X PUT http://localhost:8000/api/v1/logstream/payment \ -u parseable:parseable \ -H "Content-Type: application/json" - Ingest a test log event and verify the schema is detected correctly
- Run the SLO monitoring queries in the SQL editor to confirm they work against your data
Runbook generation and on-call copilot
We simulated a multi-turn on-call copilot conversation starting from an alert. In this scenario, Parseable is the observability backend, so all diagnostic queries target Parseable datasets and APIs.
Turn 1 Alert context:
ALERT: CheckoutDBPoolExhausted
Service: checkout-service
Current value: active_connections=20/20
Threshold: active_connections >= 20
Duration: firing for 3 minutes
Environment: production, us-east-1
"Generate a runbook for this alert. Include Parseable SQL queries for diagnostics alongside infrastructure commands. Then help me triage it."
Opus 4.6 generated a structured runbook:
## Runbook: CheckoutDBPoolExhausted

### Severity: High
### Impact: Checkout requests will queue and timeout, directly affecting revenue.

### Triage Steps (first 5 minutes)

1. Check recent errors in the Parseable checkout dataset:
   ```sql
   SELECT level, message, p_timestamp
   FROM "checkout"
   WHERE level IN ('error', 'warn')
     AND p_timestamp > NOW() - INTERVAL '10 minutes'
   ORDER BY p_timestamp DESC
LIMIT 50-
Check for timeout patterns indicating a slow downstream dependency:
SELECT message, COUNT(*) as occurrences FROM "checkout" WHERE p_timestamp > NOW() - INTERVAL '10 minutes' AND (message LIKE '%timeout%' OR message LIKE '%deadline%') GROUP BY message ORDER BY occurrences DESC -
Verify the alert with infrastructure commands: kubectl exec -n production deploy/checkout-service --
curl -s localhost:8080/healthz | jq .db_pool -
Check current database connection state: psql -h $DB_HOST -U readonly -c
"SELECT state, count(*) FROM pg_stat_activity WHERE datname='checkout' GROUP BY state;" -
Identify long-running queries holding connections: psql -h $DB_HOST -U readonly -c
"SELECT pid, now() - pg_stat_activity.query_start AS duration, query, state FROM pg_stat_activity WHERE datname='checkout' AND state != 'idle' ORDER BY duration DESC LIMIT 10;"
Check Parseable dataset health:
curl -s http://parseable:8000/api/v1/logstream/checkout/stats \
  -u parseable:parseable | jq .
Escalation Criteria
- If pool has been exhausted for > 10 minutes: page the checkout team lead
- If pg_stat_activity shows locks: page the DBA on-call
- If downstream dependency is the cause: page the owning team
Remediation Options
- Quick fix: Restart checkout pods to reset connections: kubectl rollout restart -n production deploy/checkout-service
- If caused by slow queries: Kill long-running queries: SELECT pg_terminate_backend(pid) FROM pg_stat_activity WHERE duration > interval '60 seconds';
- If caused by connection leak: Increase pool size temporarily: Update PGX_MAX_CONNS env var and restart
**Turn 2:** *"I ran the Parseable query and the psql check. I see 18 connections stuck in 'idle in transaction' state with queries that started 4 minutes ago. The Parseable logs show a spike in 'context deadline exceeded' errors from the payment service."*

**Opus 4.6 response:** The model correctly identified this as a likely transaction leak queries that opened a transaction but never committed or rolled back, likely triggered by the payment service timeouts. It suggested checking for missing `defer tx.Rollback()` patterns in the Go code, specifically in error paths. It provided the exact `pg_terminate_backend` command to kill the idle-in-transaction sessions as an immediate fix, and recommended adding `idle_in_transaction_session_timeout` to the PostgreSQL configuration as a safety net.

It also suggested a follow-up Parseable query to confirm the payment service correlation:

```sql
SELECT service_name, COUNT(*) as error_count
FROM "payment"
WHERE level = 'error'
  AND p_timestamp > NOW() - INTERVAL '10 minutes'
GROUP BY service_name
ORDER BY error_count DESC
Turn 3: "After killing the sessions, the pool recovered. But I see this started happening after yesterday's deploy. How do I find the problematic code change?"
The model suggested a systematic approach: git log --since="yesterday" --oneline services/checkout/, looking for changes to any code that opens database transactions, and specifically checking for error paths that might skip transaction cleanup. It maintained full context from the previous turns and didn't repeat information.
Key takeaway: The diagnostic commands are real, specific, and correct mixing Parseable SQL queries with standard infrastructure commands. The multi-turn context maintenance is strong. By Turn 3 it had accumulated the full incident picture and gave targeted advice. The runbook format is immediately usable.
In production, Parseable's Keystone (available in Parseable Cloud and Enterprise editions) is the primary interface for these copilot interactions it runs the same LLM-powered analysis directly in the Prism UI, with full access to all dataset and schema context. The experiments here validate the underlying reasoning capabilities that Keystone delivers to on-call engineers.
Honest assessment: Parseable + Claude Opus 4.6 synergy
Strengths
Log pattern recognition is where Opus 4.6 shines brightest. The combination of a large context window and strong reasoning lets it ingest hundreds of log lines exported from Parseable and find patterns that would take a human minutes of scrolling and grepping. The structured JSON output is reliable and directly parseable.
SQL generation for Parseable works particularly well. Parseable uses PostgreSQL-compatible SQL, and LLMs are trained extensively on PostgreSQL. This means the model generates correct syntax on the first attempt far more often than it would for vendor-specific query languages. When given the Parseable dataset schema, first-attempt accuracy is high.
Trace analysis benefits from the model's ability to reason about tree structures and concurrency. Reconstructing trace hierarchies from flat span data exported from Parseable's traces dataset and identifying critical paths is a strong capability.
Multi-signal reasoning in the incident RCA experiment was the most impressive result overall. Because Parseable stores logs, traces, and metrics in a unified query layer, we could export all three signal types and feed them to Claude in a single prompt. Connecting log errors to trace latency to metric CPU data in a single coherent diagnosis is exactly what makes observability hard for humans, and the model handled it well.
Limitations
PromQL for complex scenarios remains challenging. Standard patterns (rate, ratio, histogram quantiles) work fine, but multi-level aggregations, recording rules, and PromQL-specific edge cases (staleness, lookback delta) can trip up the model. For most monitoring needs, Parseable's built-in alerting (threshold, anomaly detection, forecasting) is simpler than maintaining Prometheus alerting rules.
Proprietary system knowledge is a gap. The model doesn't know your specific service topology, deployment history, or organizational context. It can infer dependencies from data, but it can't know that "the payment team deployed at 1:52am" unless you tell it. The cold-start problem is real.
Hallucination risk exists, especially for metric names and label values. The model might reference column names that don't exist in your Parseable dataset. Always provide your actual schema (via GET /api/v1/logstream/{stream}/schema) in the prompt.
Cost and latency matter for interactive use. A complex RCA prompt with substantial context can take 30-60 seconds to process and cost $0.50-2.00 per invocation. This is fine for post-incident analysis but too slow for real-time interactive debugging during a fast-moving incident.
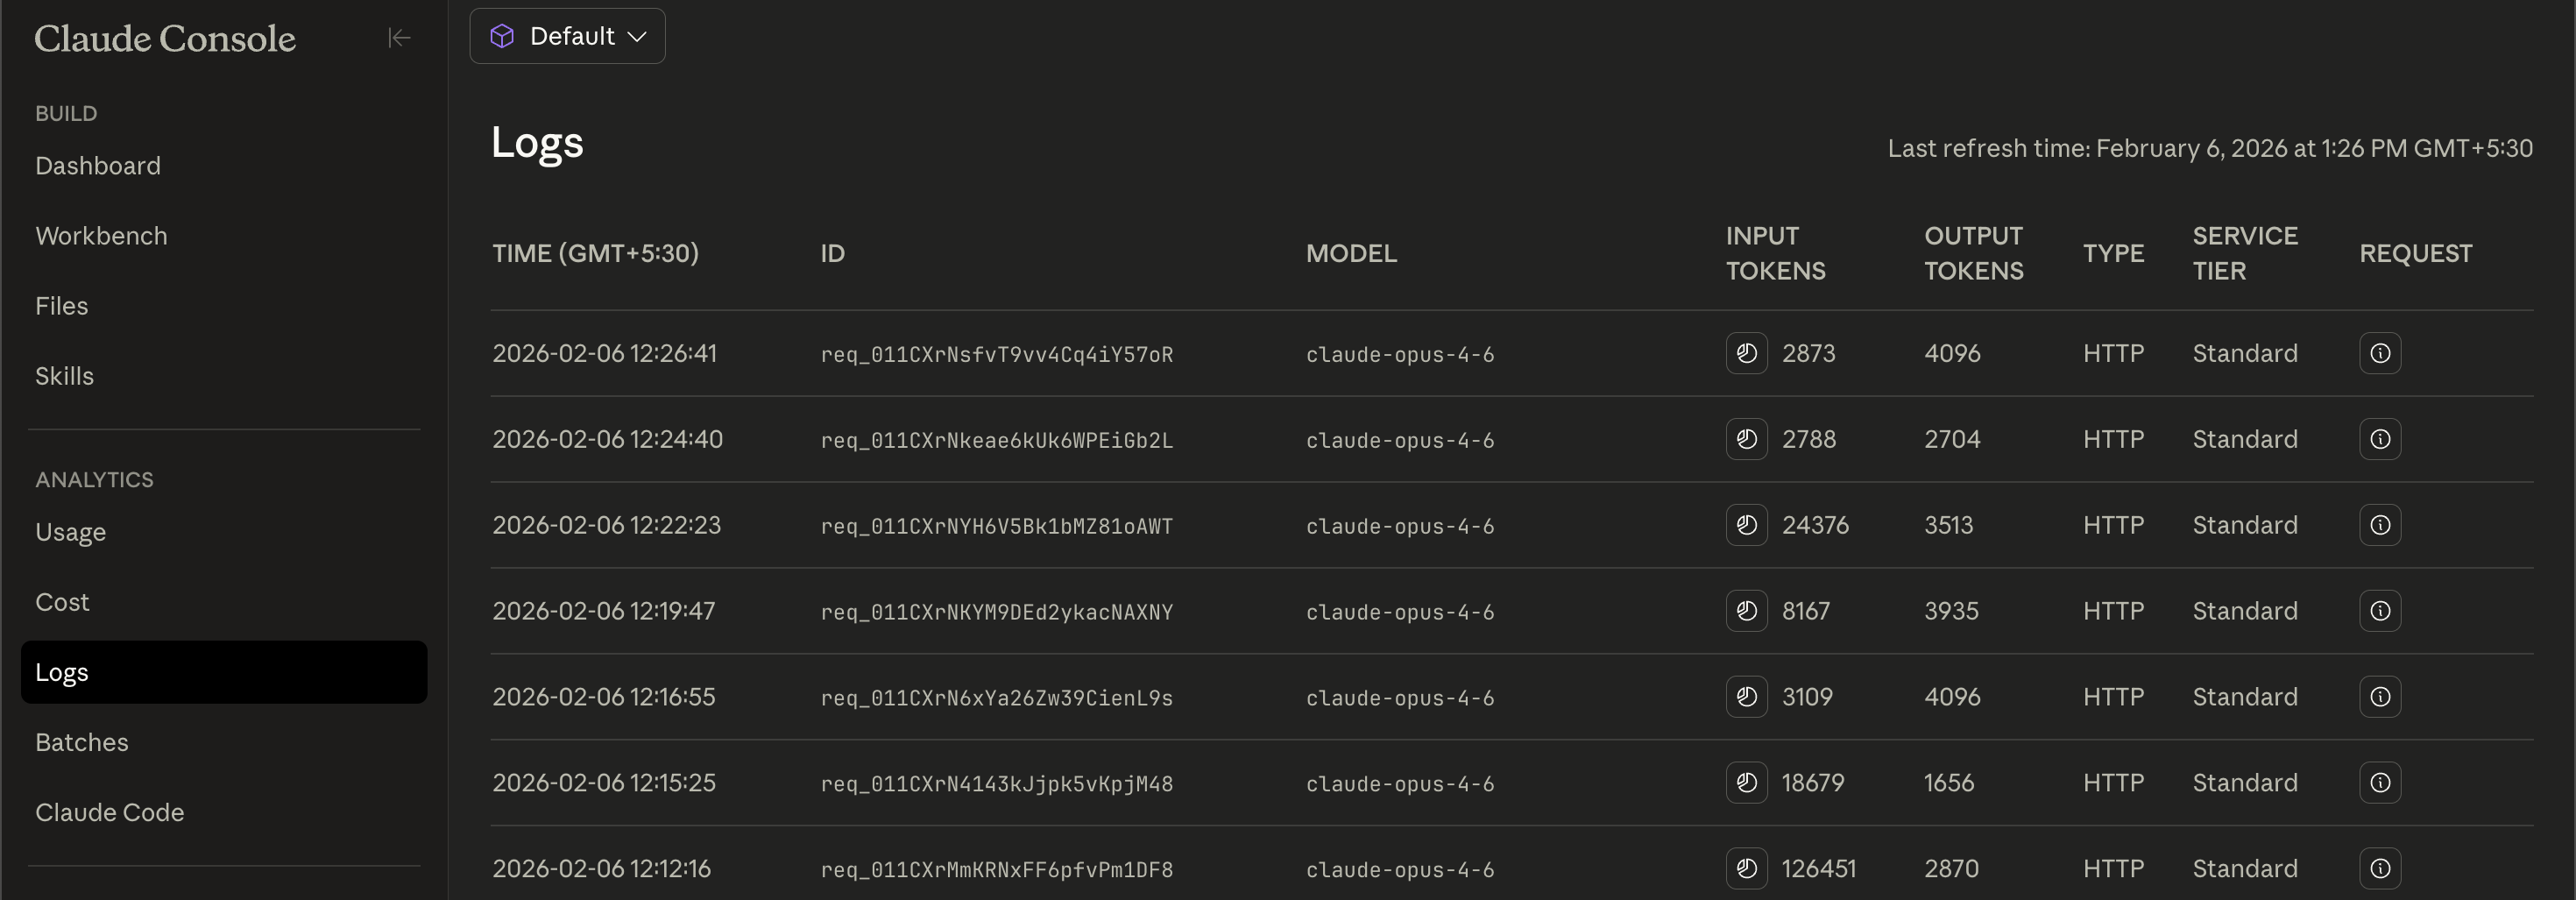
Cost per Experiment
| Experiment | Input Tokens | Output Tokens | Estimated Cost |
|---|---|---|---|
| Log analysis (200 lines) | 126,451 | 2,870 | $2.11 |
| SQL generation (3 queries) | 18,679 | 1,656 | $0.40 |
| Alert correlation (18 alerts) | 3,109 | 4,096 | $0.35 |
| Incident RCA (multi-signal) | 8,167 | 3,935 | $0.42 |
| Trace analysis (33 spans) | 24,376 | 3,513 | $0.63 |
| OTel instrumentation | 2,788 | 2,704 | $0.24 |
| Schema + SLO design | 2,873 | 4,096 | $0.35 |
| Total | 186,443 | 22,870 | $4.51 |
Conclusion
After running Opus 4.6 through 10 observability workflows with Parseable as the backend, our conclusion is clear: LLMs work best as observability co-pilots, not autonomous SREs and Parseable's data-first, SQL-native architecture makes it an ideal foundation for this approach.
The combination works because of a fundamental alignment: Parseable stores all telemetry as queryable data exposed through standard SQL, and Claude reasons deeply over structured data. There's no translation layer, no proprietary query language to learn, no impedance mismatch. You export data from Parseable, send it to Claude, and get back analysis that you can validate by running SQL queries in the same Parseable instance.
The model excels at tasks that require pattern recognition across large datasets (log analysis), structural reasoning (trace trees), and synthesis across multiple data types (incident RCA). These are exactly the tasks that consume the most on-call time and benefit most from augmentation.
It falls short where deep system-specific knowledge is required, where precise numerical reasoning matters (exact PromQL edge cases), and where real-time latency is critical. These limitations are real but predictable, and they define a clear boundary: use the model to accelerate human decision-making, not to replace it.
For teams already using Parseable, Keystone (available in Parseable Cloud and Enterprise editions) delivers these LLM capabilities directly in the Prism UI for day-to-day queries with built-in schema awareness and multi-agent orchestration. For custom workflows multi-signal incident investigation, complex trace analysis, automated pipeline integration the direct API gives you full control over prompts and data flow.
We encourage you to try these experiments yourself. Deploy Parseable and the OTel Demo, run the SQL queries, export the data, and send it to Claude. Every experiment in this post is reproducible. The results might change how you think about your on-call workflow.
All experiments were run on February 7 2026 using Parseable and the OpenTelemetry Demo application. All SQL queries use PostgreSQL-compatible syntax. Prompts, sample data, and evaluation criteria are available in our companion repository. Model behavior may vary always validate LLM output against your own systems before acting on it in production.

