

The Black Box Problem
Your coding agent just spent 3 minutes and $2.40 to add a print statement. Or worse, it confidently submitted a patch that broke production. You check the logs: "Task completed successfully."
This is the reality of running AI agents in production. They're powerful, autonomous, and completely opaque. Traditional logging tells you that something happened. Distributed tracing tells you why.
Consider what happens when a coding agent tackles a bug fix:
- It reads the issue description
- It explores the codebase (5-10 file reads)
- It forms a hypothesis
- It writes a fix
- It tests the fix
- It iterates (maybe 3-4 times)
- It submits
Each step involves LLM calls, tool executions, and decisions. Without tracing, you see the input and output. With tracing, you see the reasoning chain, the dead ends, the token burn rate, and exactly where things went wrong.
Why Agents Are Different
Tracing a traditional web service is straightforward: request comes in, database gets queried, response goes out. Agents are fundamentally different:
Non-deterministic execution paths. The same task might take 3 iterations or 15, depending on how the LLM interprets the problem.
Recursive tool use. An agent might call a tool, realize it needs more context, call another tool, then return to the first tool with new information.
Accumulating context. Each LLM call builds on previous calls. A bug in iteration 2 might not manifest until iteration 7 when the context window overflows.
Cost proportional to complexity. Unlike fixed-cost API calls, agent costs scale with task difficulty in unpredictable ways.
This is why OpenTelemetry's GenAI semantic conventions matter. They provide a standard vocabulary for capturing AI-specific telemetry that traditional tracing frameworks weren't designed for.
What We're Capturing
A complete agent trace includes:
| Signal | What It Captures |
|---|---|
| Agent invocation | Task description, agent name, conversation ID |
| LLM calls | Model, temperature, max_tokens, system prompt |
| Input messages | User prompts, conversation history |
| Output messages | Assistant responses, tool call requests |
| Tool executions | Tool name, arguments, results, duration |
| Token usage | Input tokens, output tokens, total cost |
| Errors | Exception types, error messages, stack traces |
OpenTelemetry GenAI Semantic Conventions
OpenTelemetry defines semantic conventions for GenAI that standardize how AI telemetry is captured. Key attributes include:
Agent Attributes
| Attribute | Description | Example |
|---|---|---|
gen_ai.operation.name | Operation type | invoke_agent, chat, execute_tool |
gen_ai.agent.name | Agent identifier | CodingAgent |
gen_ai.agent.id | Unique agent instance ID | agent_abc123 |
gen_ai.agent.description | What the agent does | Writes and debugs code |
gen_ai.conversation.id | Session/conversation ID | conv_xyz789 |
LLM Call Attributes
| Attribute | Description | Example |
|---|---|---|
gen_ai.provider.name | LLM provider | openai, anthropic |
gen_ai.request.model | Requested model | gpt-4o |
gen_ai.response.model | Actual model used | gpt-4o-2024-08-06 |
gen_ai.request.temperature | Temperature setting | 0.0 |
gen_ai.request.max_tokens | Max output tokens | 4096 |
gen_ai.response.finish_reasons | Why generation stopped | ["stop"], ["tool_calls"] |
Token Usage Attributes
| Attribute | Description | Example |
|---|---|---|
gen_ai.usage.input_tokens | Prompt tokens | 1250 |
gen_ai.usage.output_tokens | Completion tokens | 380 |
Tool Execution Attributes
| Attribute | Description | Example |
|---|---|---|
gen_ai.tool.name | Tool identifier | read_file, execute_command |
gen_ai.tool.type | Tool category | function, extension |
gen_ai.tool.call.id | Unique call ID | call_abc123 |
gen_ai.tool.call.arguments | Input arguments (JSON) | {"path": "/src/main.py"} |
gen_ai.tool.call.result | Output result (JSON) | {"content": "..."} |
gen_ai.tool.description | What the tool does | Read file contents |
Content Attributes (Opt-In)
| Attribute | Description |
|---|---|
gen_ai.system_instructions | System prompt |
gen_ai.input.messages | Full input message array |
gen_ai.output.messages | Full output message array |
Architecture
┌─────────────────────────────────────────────────────────────┐
│                      Coding Agent                           │
│  ┌─────────────┐  ┌─────────────┐  ┌─────────────────────┐  │
│  │   Planner   │──│  Executor   │──│   Tool Runtime      │  │
│  │   (LLM)     │  │   (Loop)    │  │ (read/write/exec)   │  │
│  └──────┬──────┘  └──────┬──────┘  └──────────┬──────────┘  │
│         │                │                    │              │
│         └────────────────┼────────────────────┘              │
│                          │                                   │
│                   OpenTelemetry SDK                          │
│                          │                                   │
└──────────────────────────┼───────────────────────────────────┘
                           │
                           ▼
                 ┌─────────────────────┐
                 │  OTel Collector     │
                 │  (OTLP Receiver)    │
                 └──────────┬──────────┘
                            │
                            ▼
                 ┌─────────────────────┐
                 │     Parseable       │
                 │   /v1/traces        │
                 └─────────────────────┘
The Instrumented SWE-agent
We've instrumented SWE-agent, a real-world coding agent from Princeton NLP that achieves state-of-the-art results on software engineering benchmarks. SWE-agent can autonomously fix GitHub issues, navigate complex codebases, and submit pull requests.
Why SWE-agent? Because it represents the complexity of production agents:
- Multi-step reasoning: It doesn't just generate code; it explores, hypothesizes, tests, and iterates
- Rich tool ecosystem: File operations, shell commands, git operations, code search
- Real-world benchmarks: Tested against SWE-bench, a dataset of real GitHub issues
- LiteLLM integration: Works with any LLM provider (OpenAI, Anthropic, local models)
The instrumentation adds OpenTelemetry tracing to three key files:
| File | What It Traces |
|---|---|
sweagent/telemetry.py | OTel setup, span utilities, conversation tracking |
sweagent/agent/models.py | LLM calls with token usage, model parameters, response metadata |
sweagent/agent/agents.py | Agent runs, tool executions, iteration tracking |
See the full TRACING.md documentation for setup instructions.
Quick Start
git clone https://github.com/Debanitrkl/SWE-agent
cd SWE-agent
pip install -e .
pip install opentelemetry-api opentelemetry-sdk opentelemetry-exporter-otlp-proto-http

export SWE_AGENT_ENABLE_TRACING=true
export OTEL_EXPORTER_OTLP_ENDPOINT=http://localhost:4318
export OPENAI_API_KEY="your-key"

# Run against a GitHub issue
python -m sweagent run \
  --config config/default.yaml \
  --agent.model.name "gpt-4o" \
  --env.repo.github_url=https://github.com/your-org/your-repo \
  --problem_statement.github_url=https://github.com/your-org/your-repo/issues/123
What Happens Under the Hood
When you run SWE-agent with tracing enabled, here's the telemetry flow:
- Agent starts → Root span created with
gen_ai.operation.name = "invoke_agent" - Problem loaded →
agent.problem_idattribute set with the GitHub issue URL - First LLM call → Child span with model, temperature, and token counts
- Tool execution → Child span for each
cat,edit,pythoncommand - Iteration loop → More LLM calls, more tool spans, all nested under the root
- Completion → Root span closed with total tokens, success status, and duration
The result is a complete trace that shows exactly how the agent reasoned through the problem.
Key Instrumentation Patterns
The agent uses three span types following GenAI semantic conventions:
1. Agent Invocation Span
The root span wraps the entire agent run:
with tracer.start_as_current_span("invoke_agent CodingAgent") as span:
    span.set_attribute("gen_ai.operation.name", "invoke_agent")
    span.set_attribute("gen_ai.agent.name", "CodingAgent")
    span.set_attribute("gen_ai.conversation.id", conversation_id)
    # ... agent loop runs here
    span.set_attribute("gen_ai.usage.input_tokens", total_tokens)
2. LLM Call Spans
Each model call gets its own span:
with tracer.start_as_current_span(f"chat {model}") as span:
    span.set_attribute("gen_ai.operation.name", "chat")
    span.set_attribute("gen_ai.request.model", model)
    span.set_attribute("gen_ai.request.temperature", 0.0)

    response = client.chat.completions.create(...)

    span.set_attribute("gen_ai.usage.input_tokens", response.usage.prompt_tokens)
    span.set_attribute("gen_ai.usage.output_tokens", response.usage.completion_tokens)
3. Tool Execution Spans
Each tool call is traced with arguments and results:
with tracer.start_as_current_span(f"execute_tool {tool_name}") as span:
    span.set_attribute("gen_ai.operation.name", "execute_tool")
    span.set_attribute("gen_ai.tool.name", tool_name)
    span.set_attribute("gen_ai.tool.call.id", tool_call_id)
    span.set_attribute("gen_ai.tool.call.arguments", json.dumps(args))

    result = execute(tool_name, args)

    span.set_attribute("gen_ai.tool.call.result", json.dumps(result))
OpenTelemetry Collector Configuration
Configure the collector to forward traces to Parseable:
receivers:
otlp:
protocols:
http:
endpoint: 0.0.0.0:4318
exporters:
otlphttp:
endpoint: http://localhost:8000
headers:
Authorization: Basic YWRtaW46YWRtaW4=
X-P-Stream: coding-agent-traces
X-P-Log-Source: otel-traces
service:
pipelines:
traces:
receivers: [otlp]
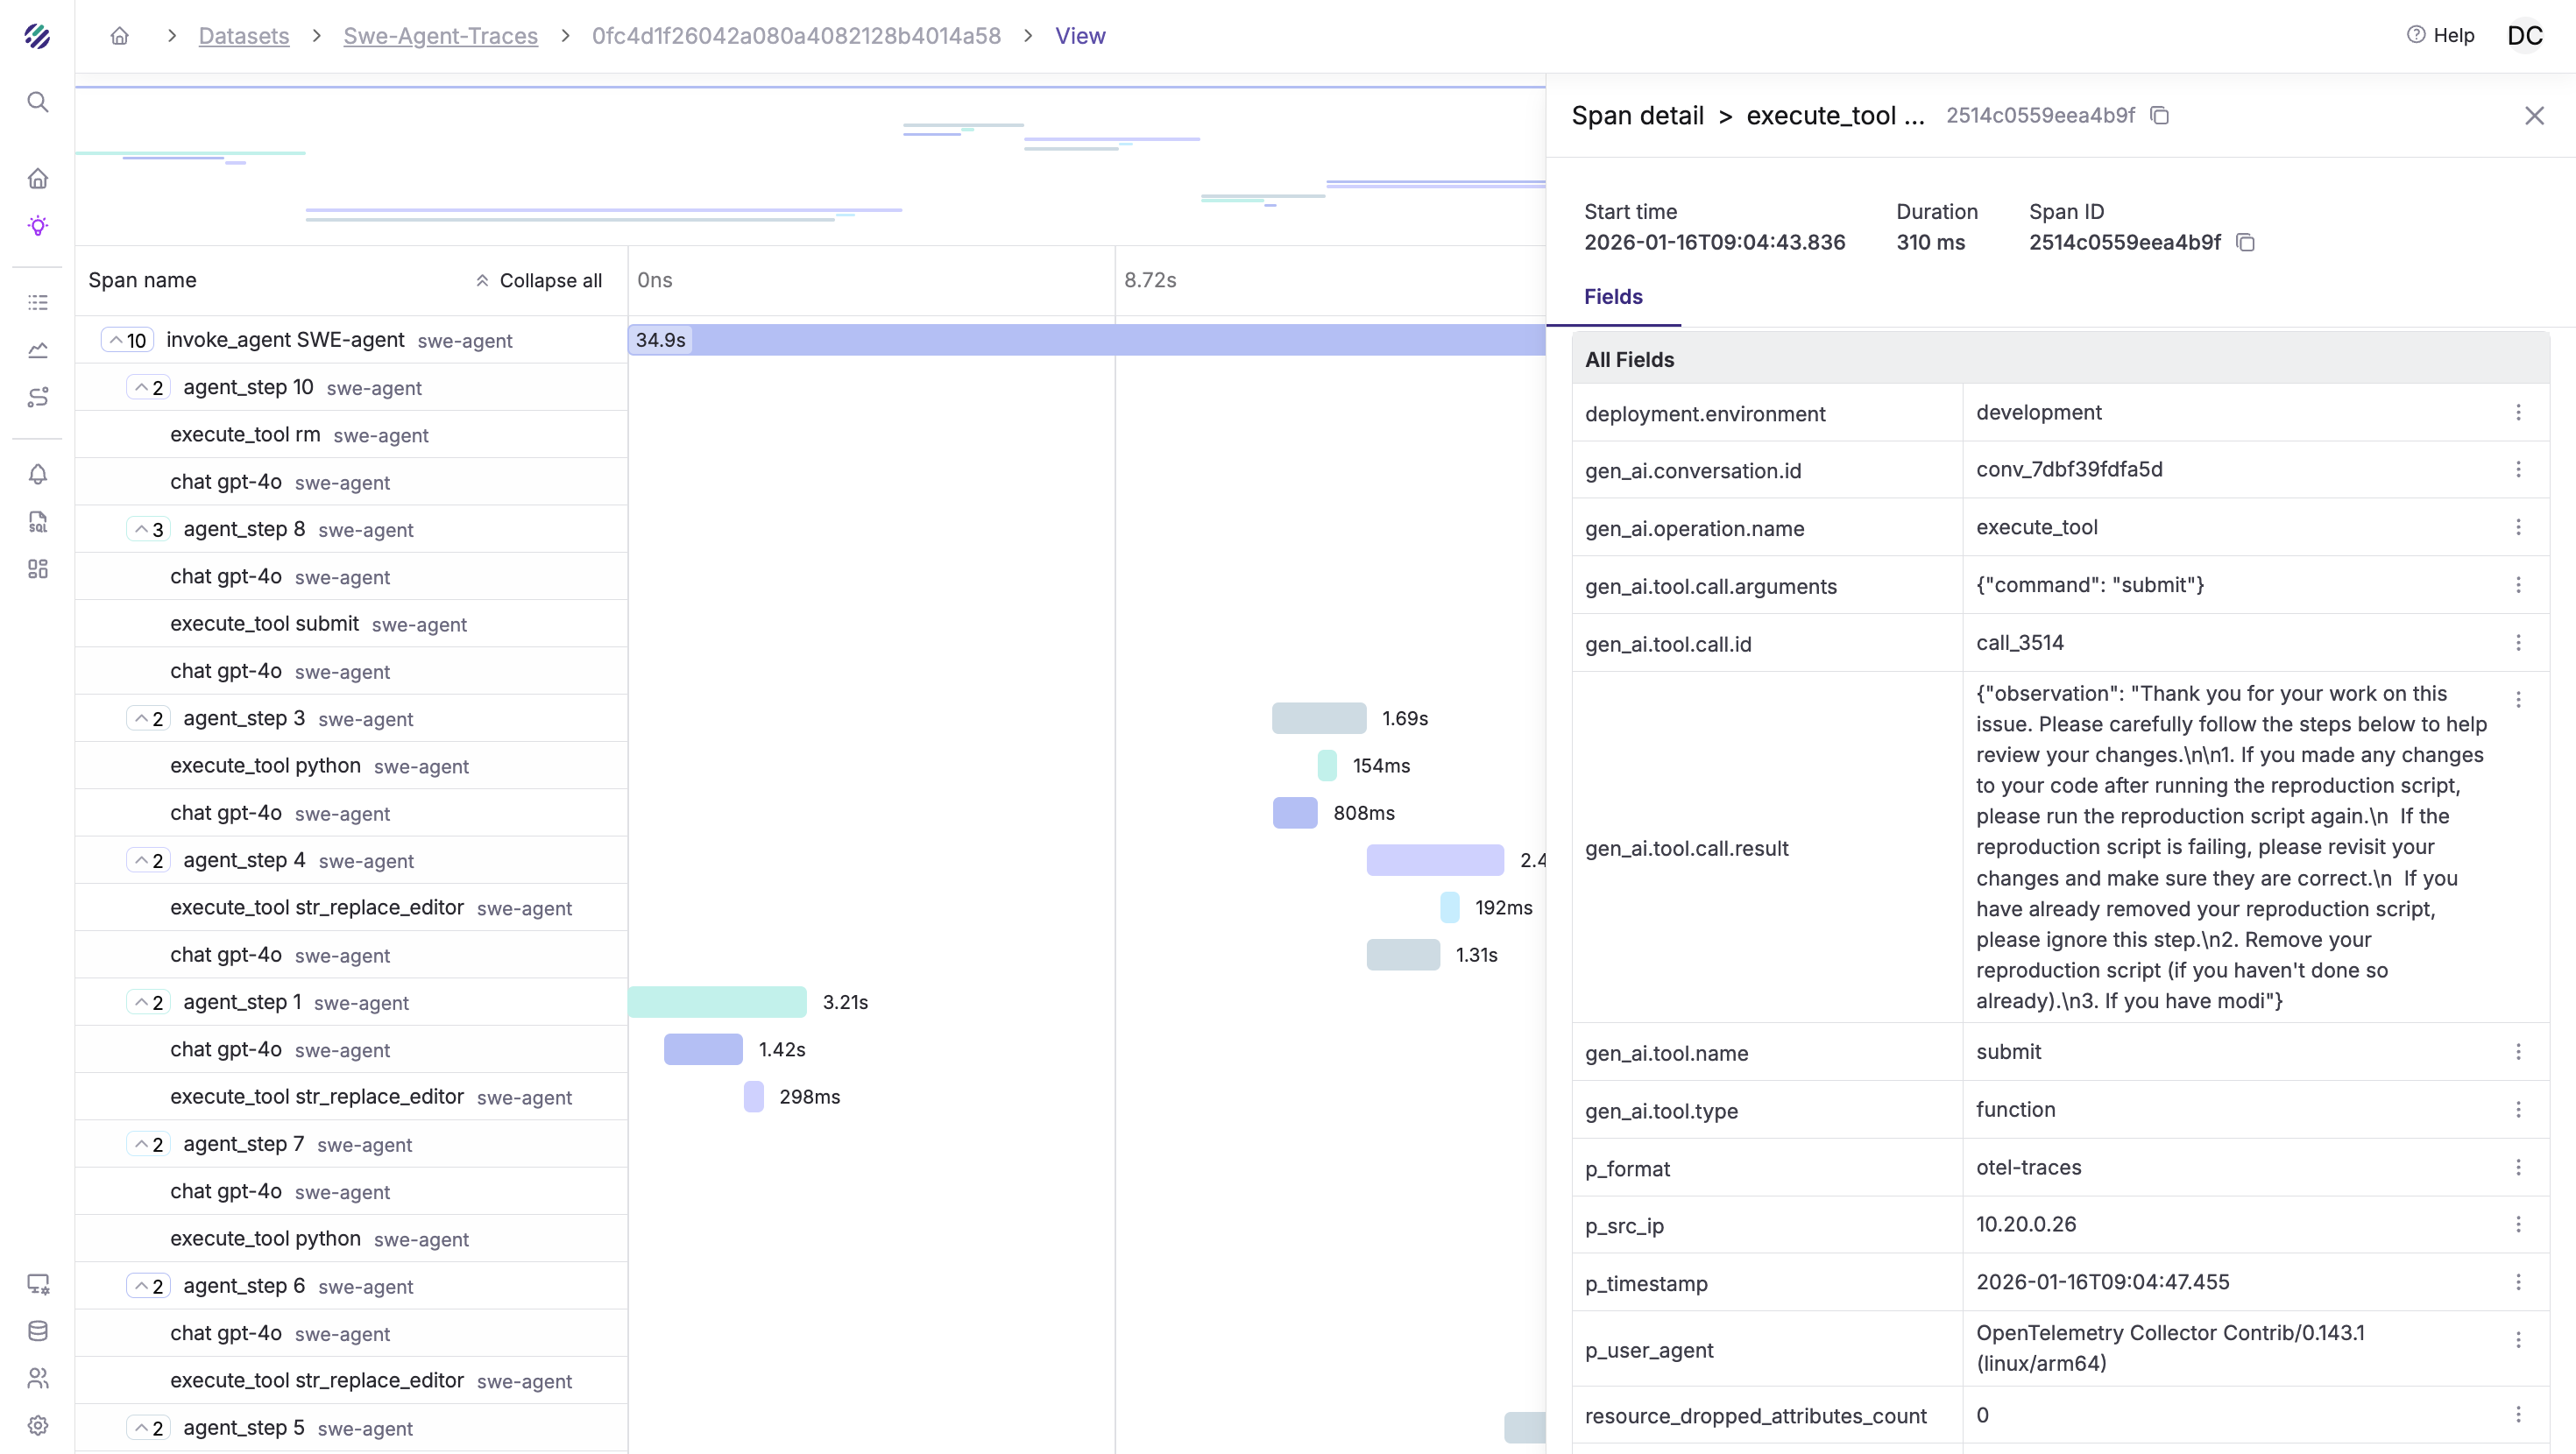
exporters: [otlphttp]Trace Hierarchy: Reading the Agent's Mind
A typical agent trace looks like this:
invoke_agent SWE-agent (45.2s) [problem: django/django#12345]
├── chat gpt-4o (3.1s) [iteration 1]
│   └── [tokens: 2100 in, 450 out] "Let me explore the codebase..."
├── execute_tool find_file (0.8s)
│   └── [args: {"file_name": "models.py"}]
├── execute_tool cat (0.1s)
│   └── [args: {"path": "django/db/models/base.py", "lines": "1-50"}]
├── chat gpt-4o (2.8s) [iteration 2]
│   └── [tokens: 3200 in, 380 out] "I see the issue is in the save() method..."
├── execute_tool cat (0.1s)
│   └── [args: {"path": "django/db/models/base.py", "lines": "700-800"}]
├── chat gpt-4o (4.2s) [iteration 3]
│   └── [tokens: 4100 in, 520 out] "I'll create a fix..."
├── execute_tool edit (0.2s)
│   └── [args: {"path": "django/db/models/base.py", "start": 745, "end": 752}]
├── execute_tool python (2.1s)
│   └── [args: {"command": "python -m pytest tests/model_tests.py -x"}]
├── chat gpt-4o (2.1s) [iteration 4]
│   └── [tokens: 4800 in, 180 out] "Tests pass. Submitting..."
└── execute_tool submit (0.1s)
    └── [result: "Patch submitted successfully"]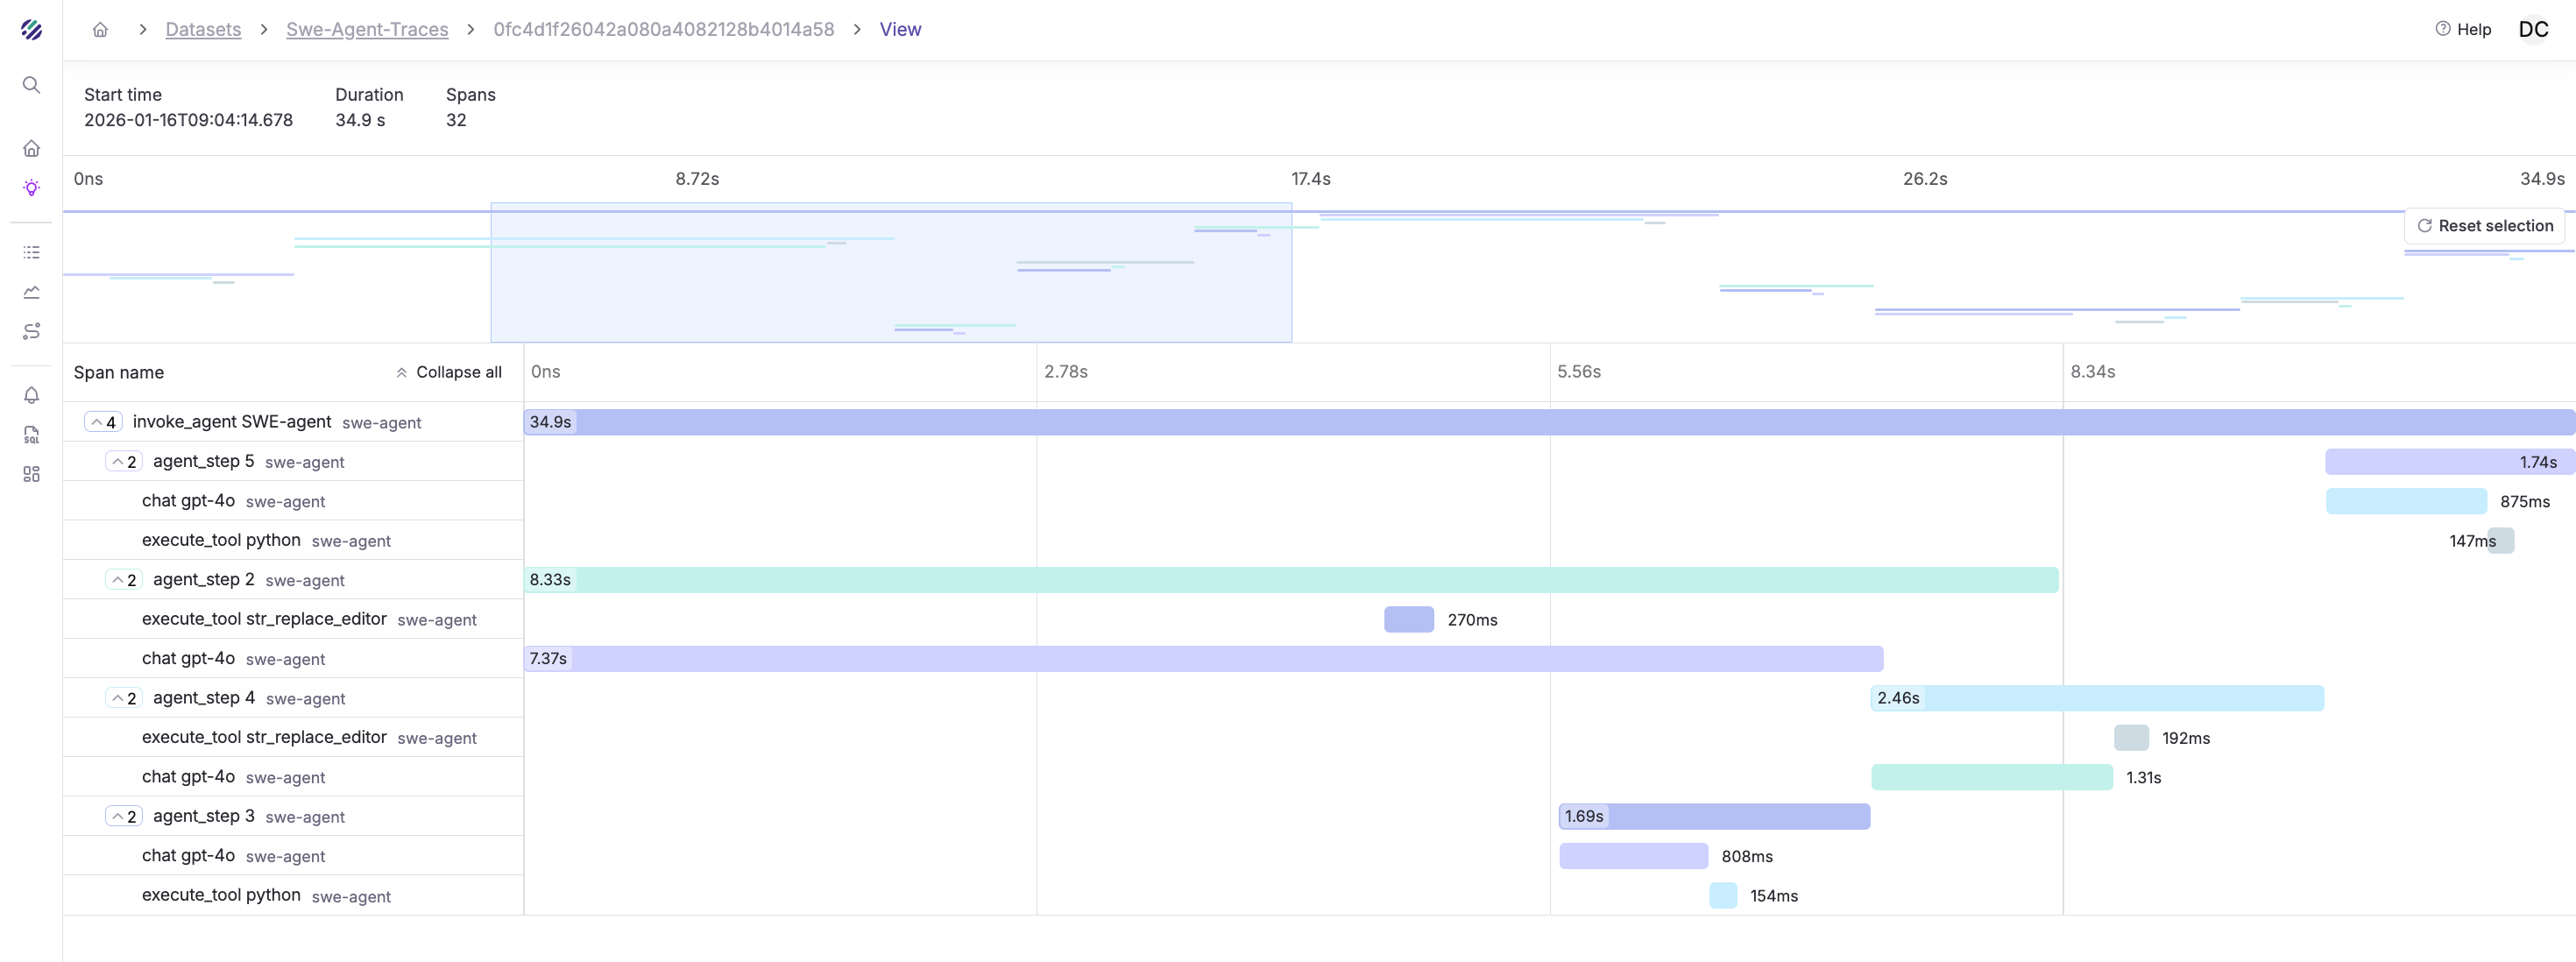
This trace tells a story. You can see:
- The exploration phase (iterations 1-2): The agent is reading files, building context
- The hypothesis (iteration 3): Token output spikes as it generates the fix
- The validation (iteration 4): It runs tests before submitting
- The cost breakdown: 14,200 input tokens, 1,530 output tokens ≈ $0.05
Now imagine this trace for an agent that took 15 iterations and $2.40. You'd immediately see where it got stuck, which files it kept re-reading, and whether it was spinning on a syntax error.
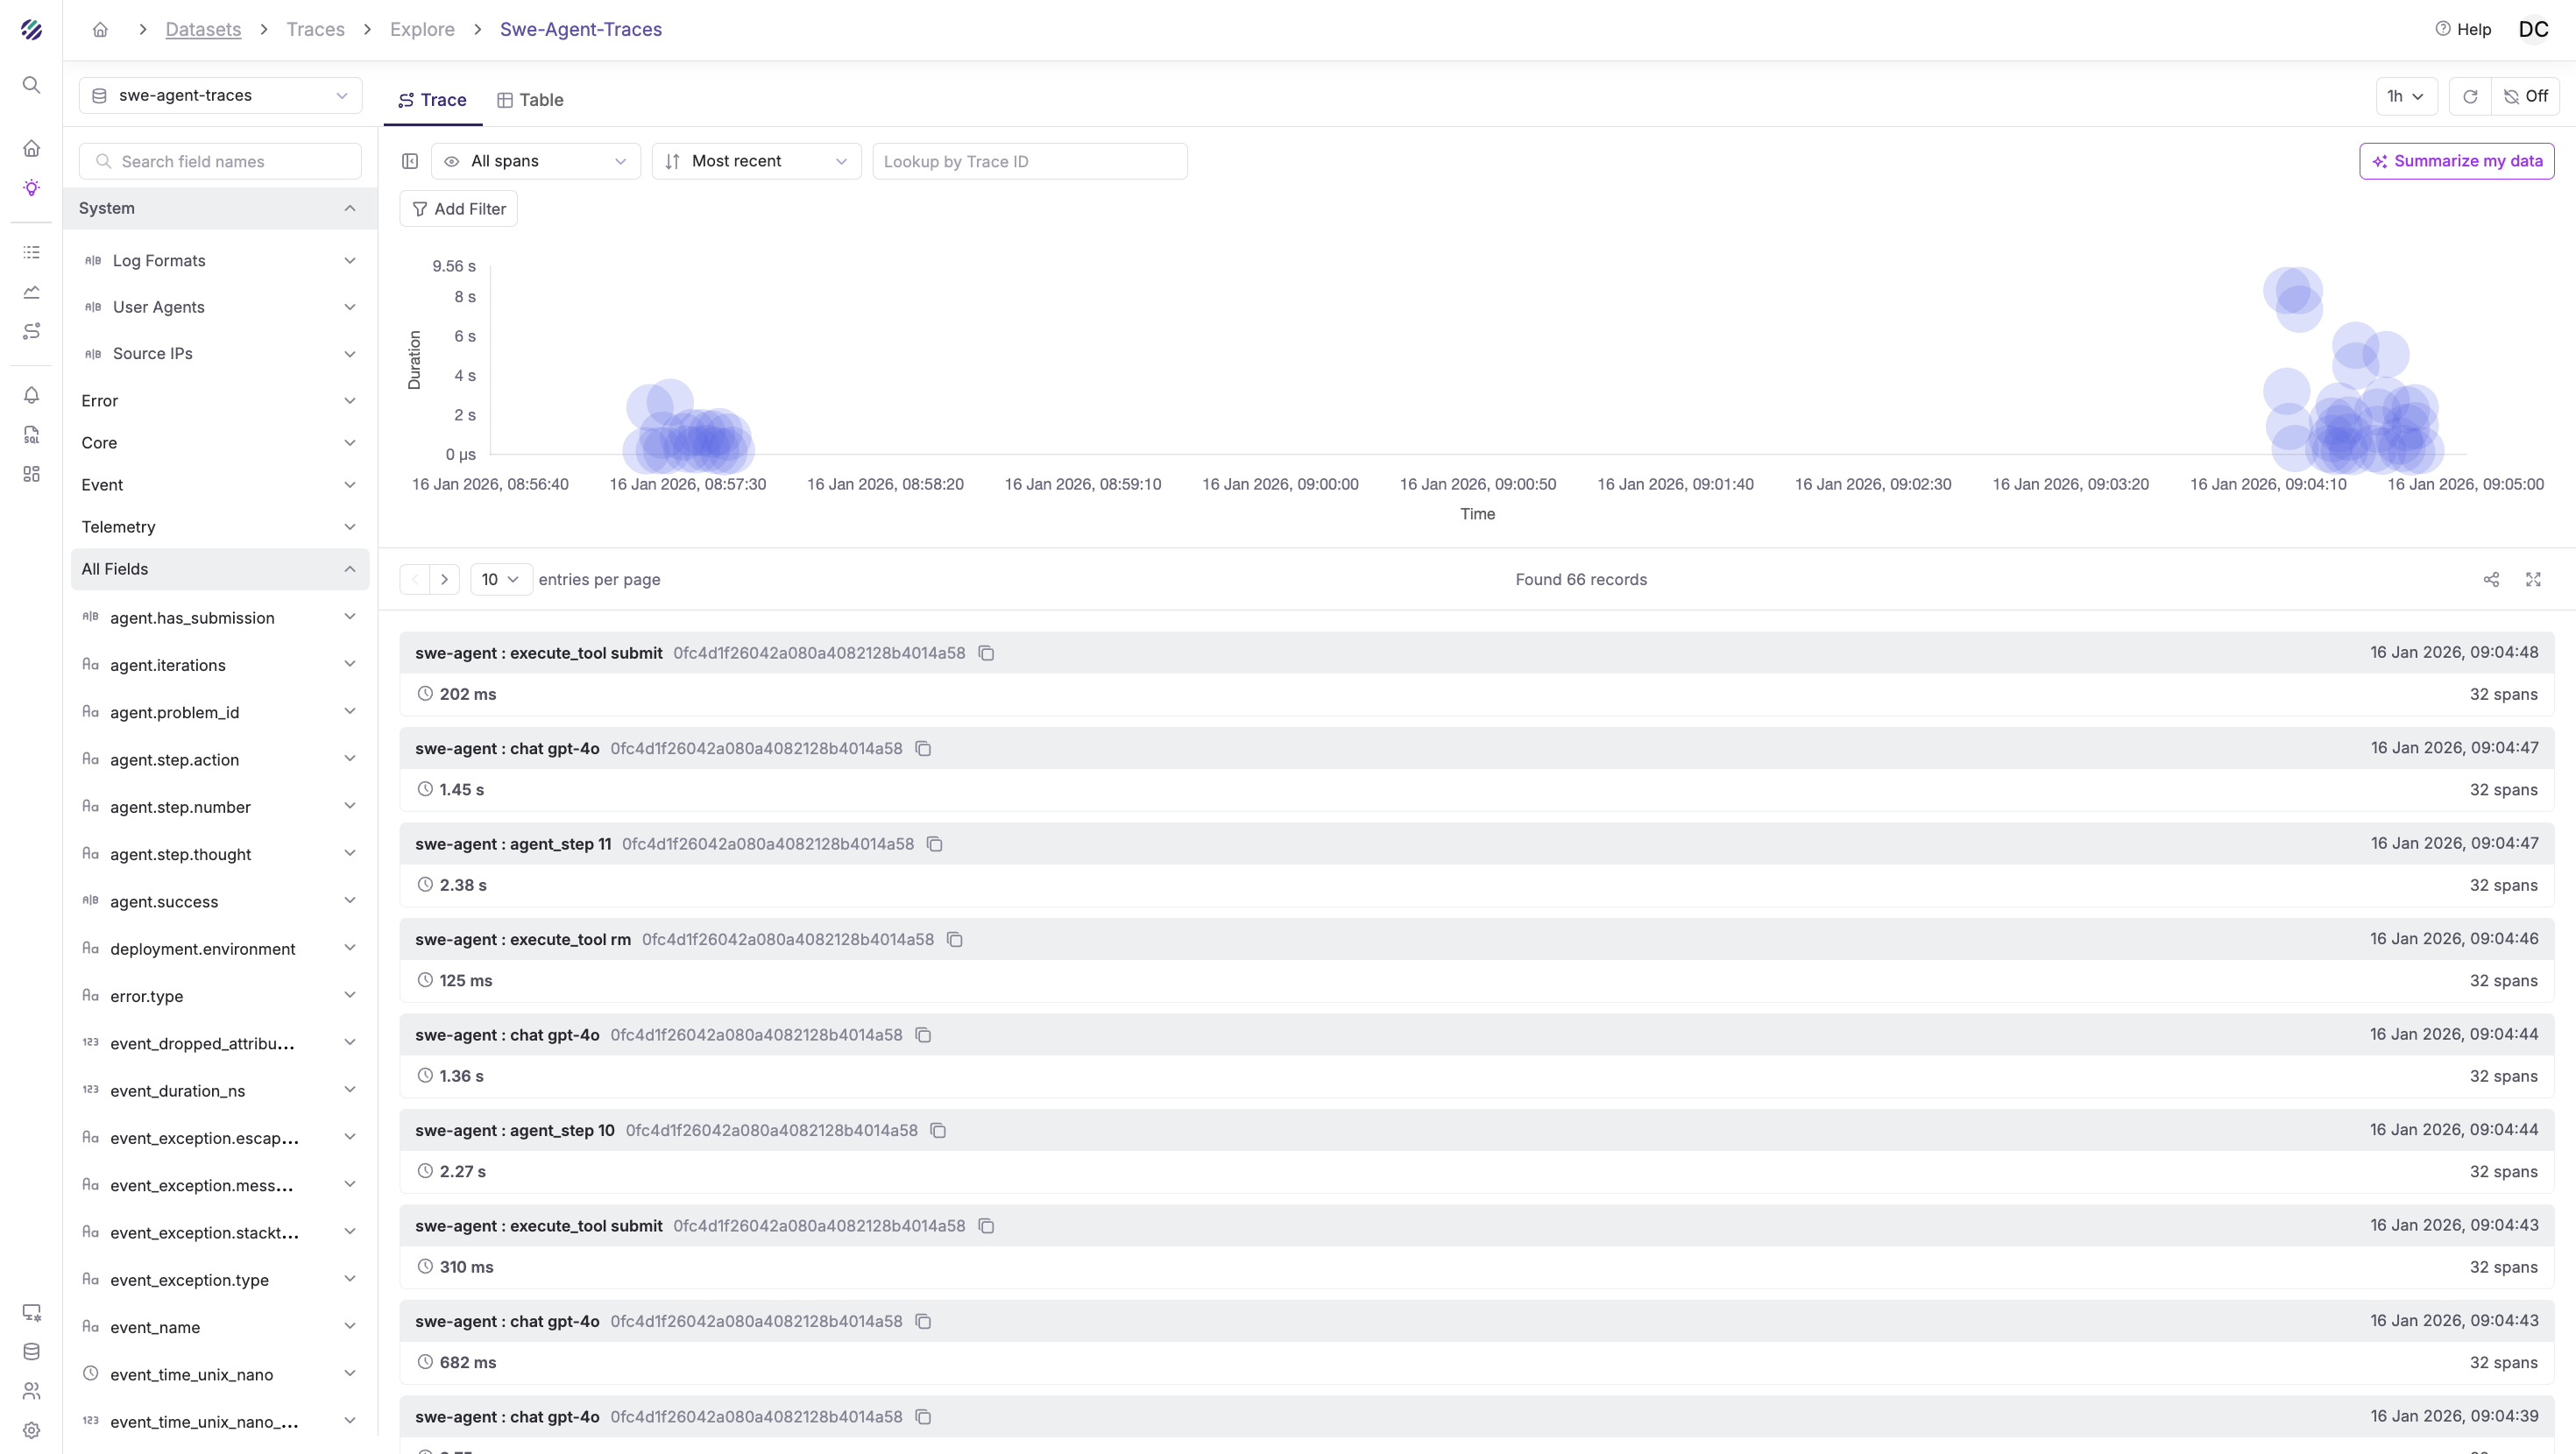
Query Traces in Parseable
Once traces flow into Parseable, you have SQL to query them. This is where observability becomes actionable.
Trace Schema
After ingestion, your traces will have fields like:
| Field | Description |
|---|---|
trace_id | Unique trace identifier |
span_id | Unique span identifier |
parent_span_id | Parent span (for hierarchy) |
span_name | Operation name |
span_kind | INTERNAL, CLIENT |
span_duration_ms | Duration in milliseconds |
gen_ai.operation.name | invoke_agent, chat, execute_tool |
gen_ai.agent.name | Agent identifier |
gen_ai.request.model | Model requested |
gen_ai.usage.input_tokens | Input token count |
gen_ai.usage.output_tokens | Output token count |
gen_ai.tool.name | Tool that was executed |
gen_ai.tool.call.arguments | Tool input (JSON) |
gen_ai.tool.call.result | Tool output (JSON) |
Example Queries
Agent runs with token usage:
SELECT
  "span_trace_id" AS trace_id,
  "gen_ai.conversation.id" AS conversation_id,
  "agent.problem_id" AS task,
  "gen_ai.usage.input_tokens" AS input_tokens,
  "gen_ai.usage.output_tokens" AS output_tokens,
  "agent.iterations" AS iterations,
  "agent.has_submission" AS completed,
  ("span_duration_ns" / 1000000000.0) AS duration_seconds,
  "p_timestamp"
FROM "swe-agent-traces"
WHERE "gen_ai.operation.name" = 'invoke_agent'
ORDER BY "p_timestamp" DESC
LIMIT 20;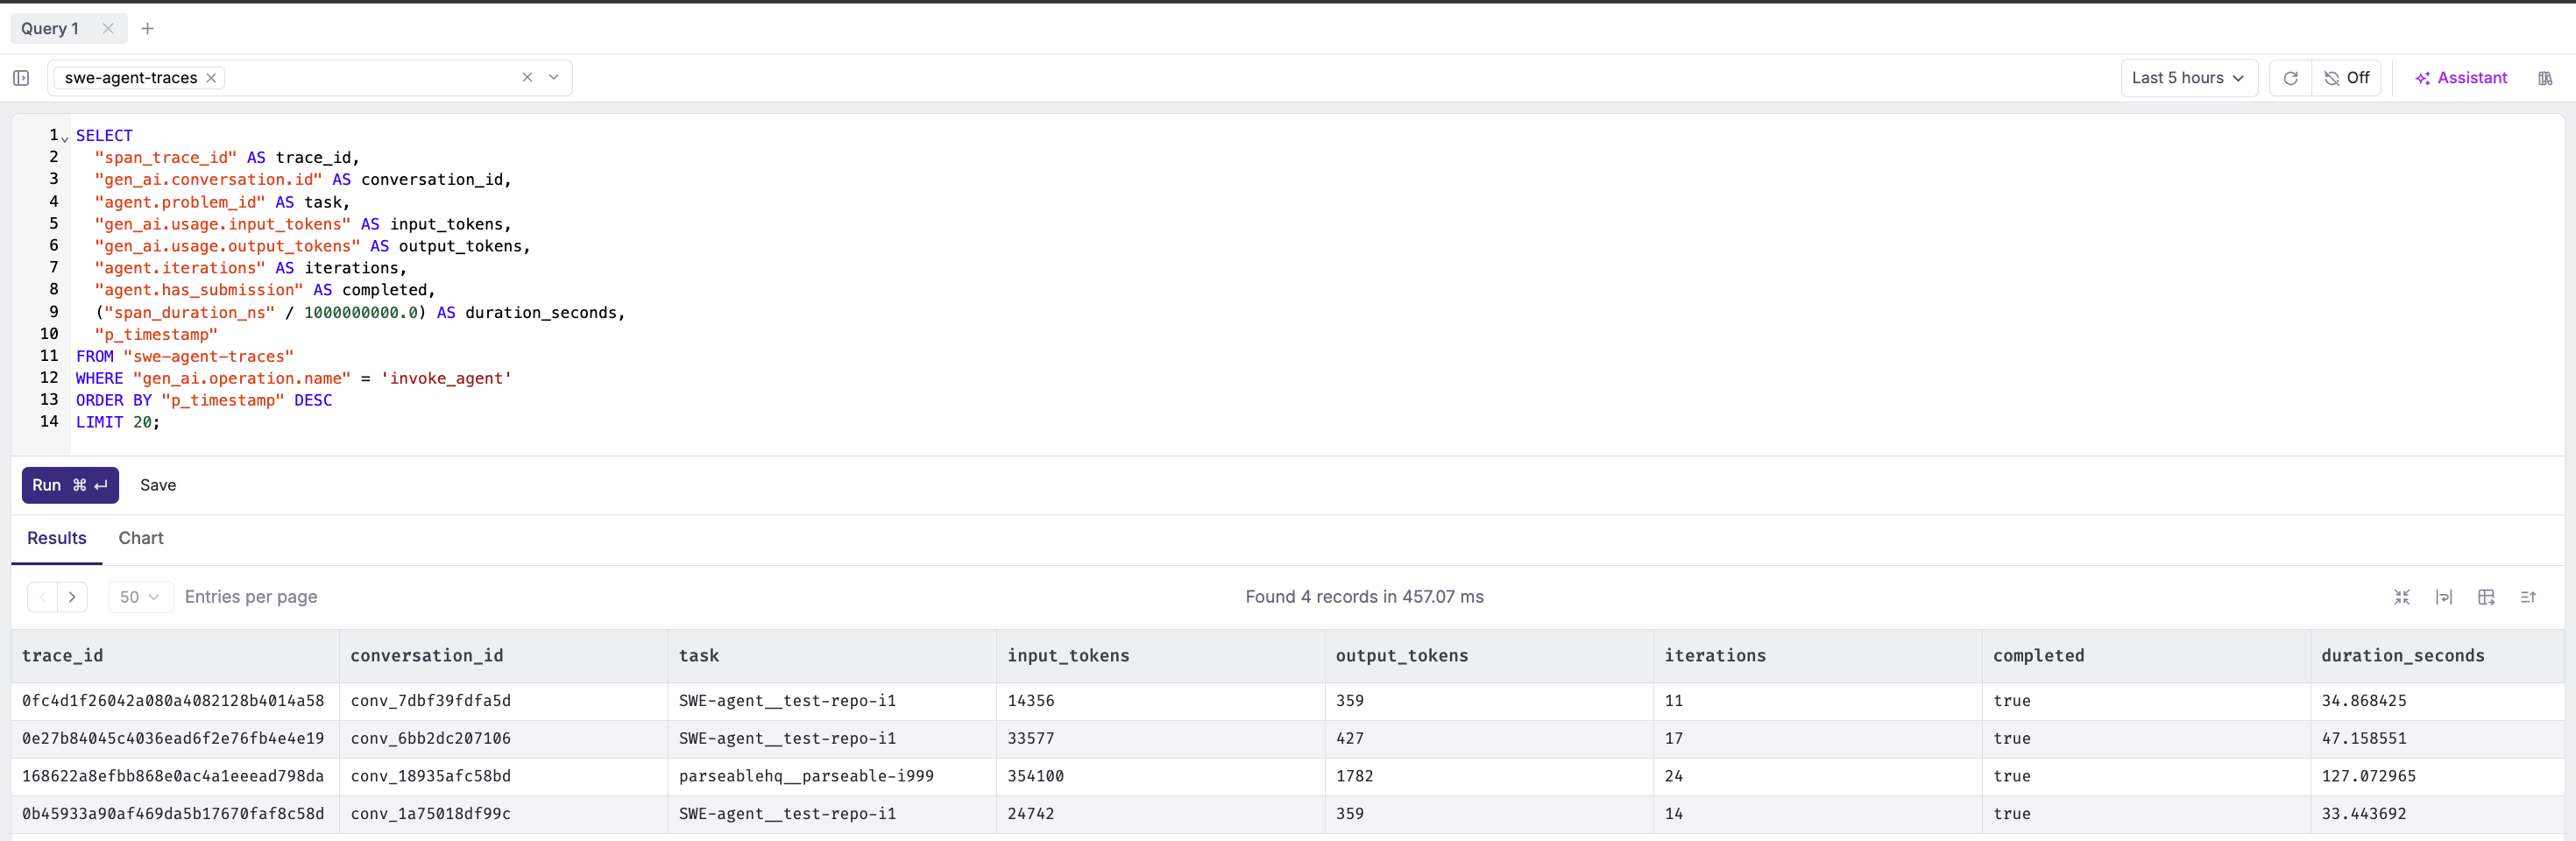
LLM calls per agent run:
SELECT
  "span_trace_id" AS trace_id,
  COUNT(*) AS llm_calls,
  SUM(CAST("gen_ai.usage.input_tokens" AS DOUBLE)) AS total_input_tokens,
  SUM(CAST("gen_ai.usage.output_tokens" AS DOUBLE)) AS total_output_tokens,
  AVG("span_duration_ns" / 1e6) AS avg_latency_ms
FROM "swe-agent-traces"
WHERE "gen_ai.operation.name" = 'chat'
GROUP BY "span_trace_id"
ORDER BY total_output_tokens DESC;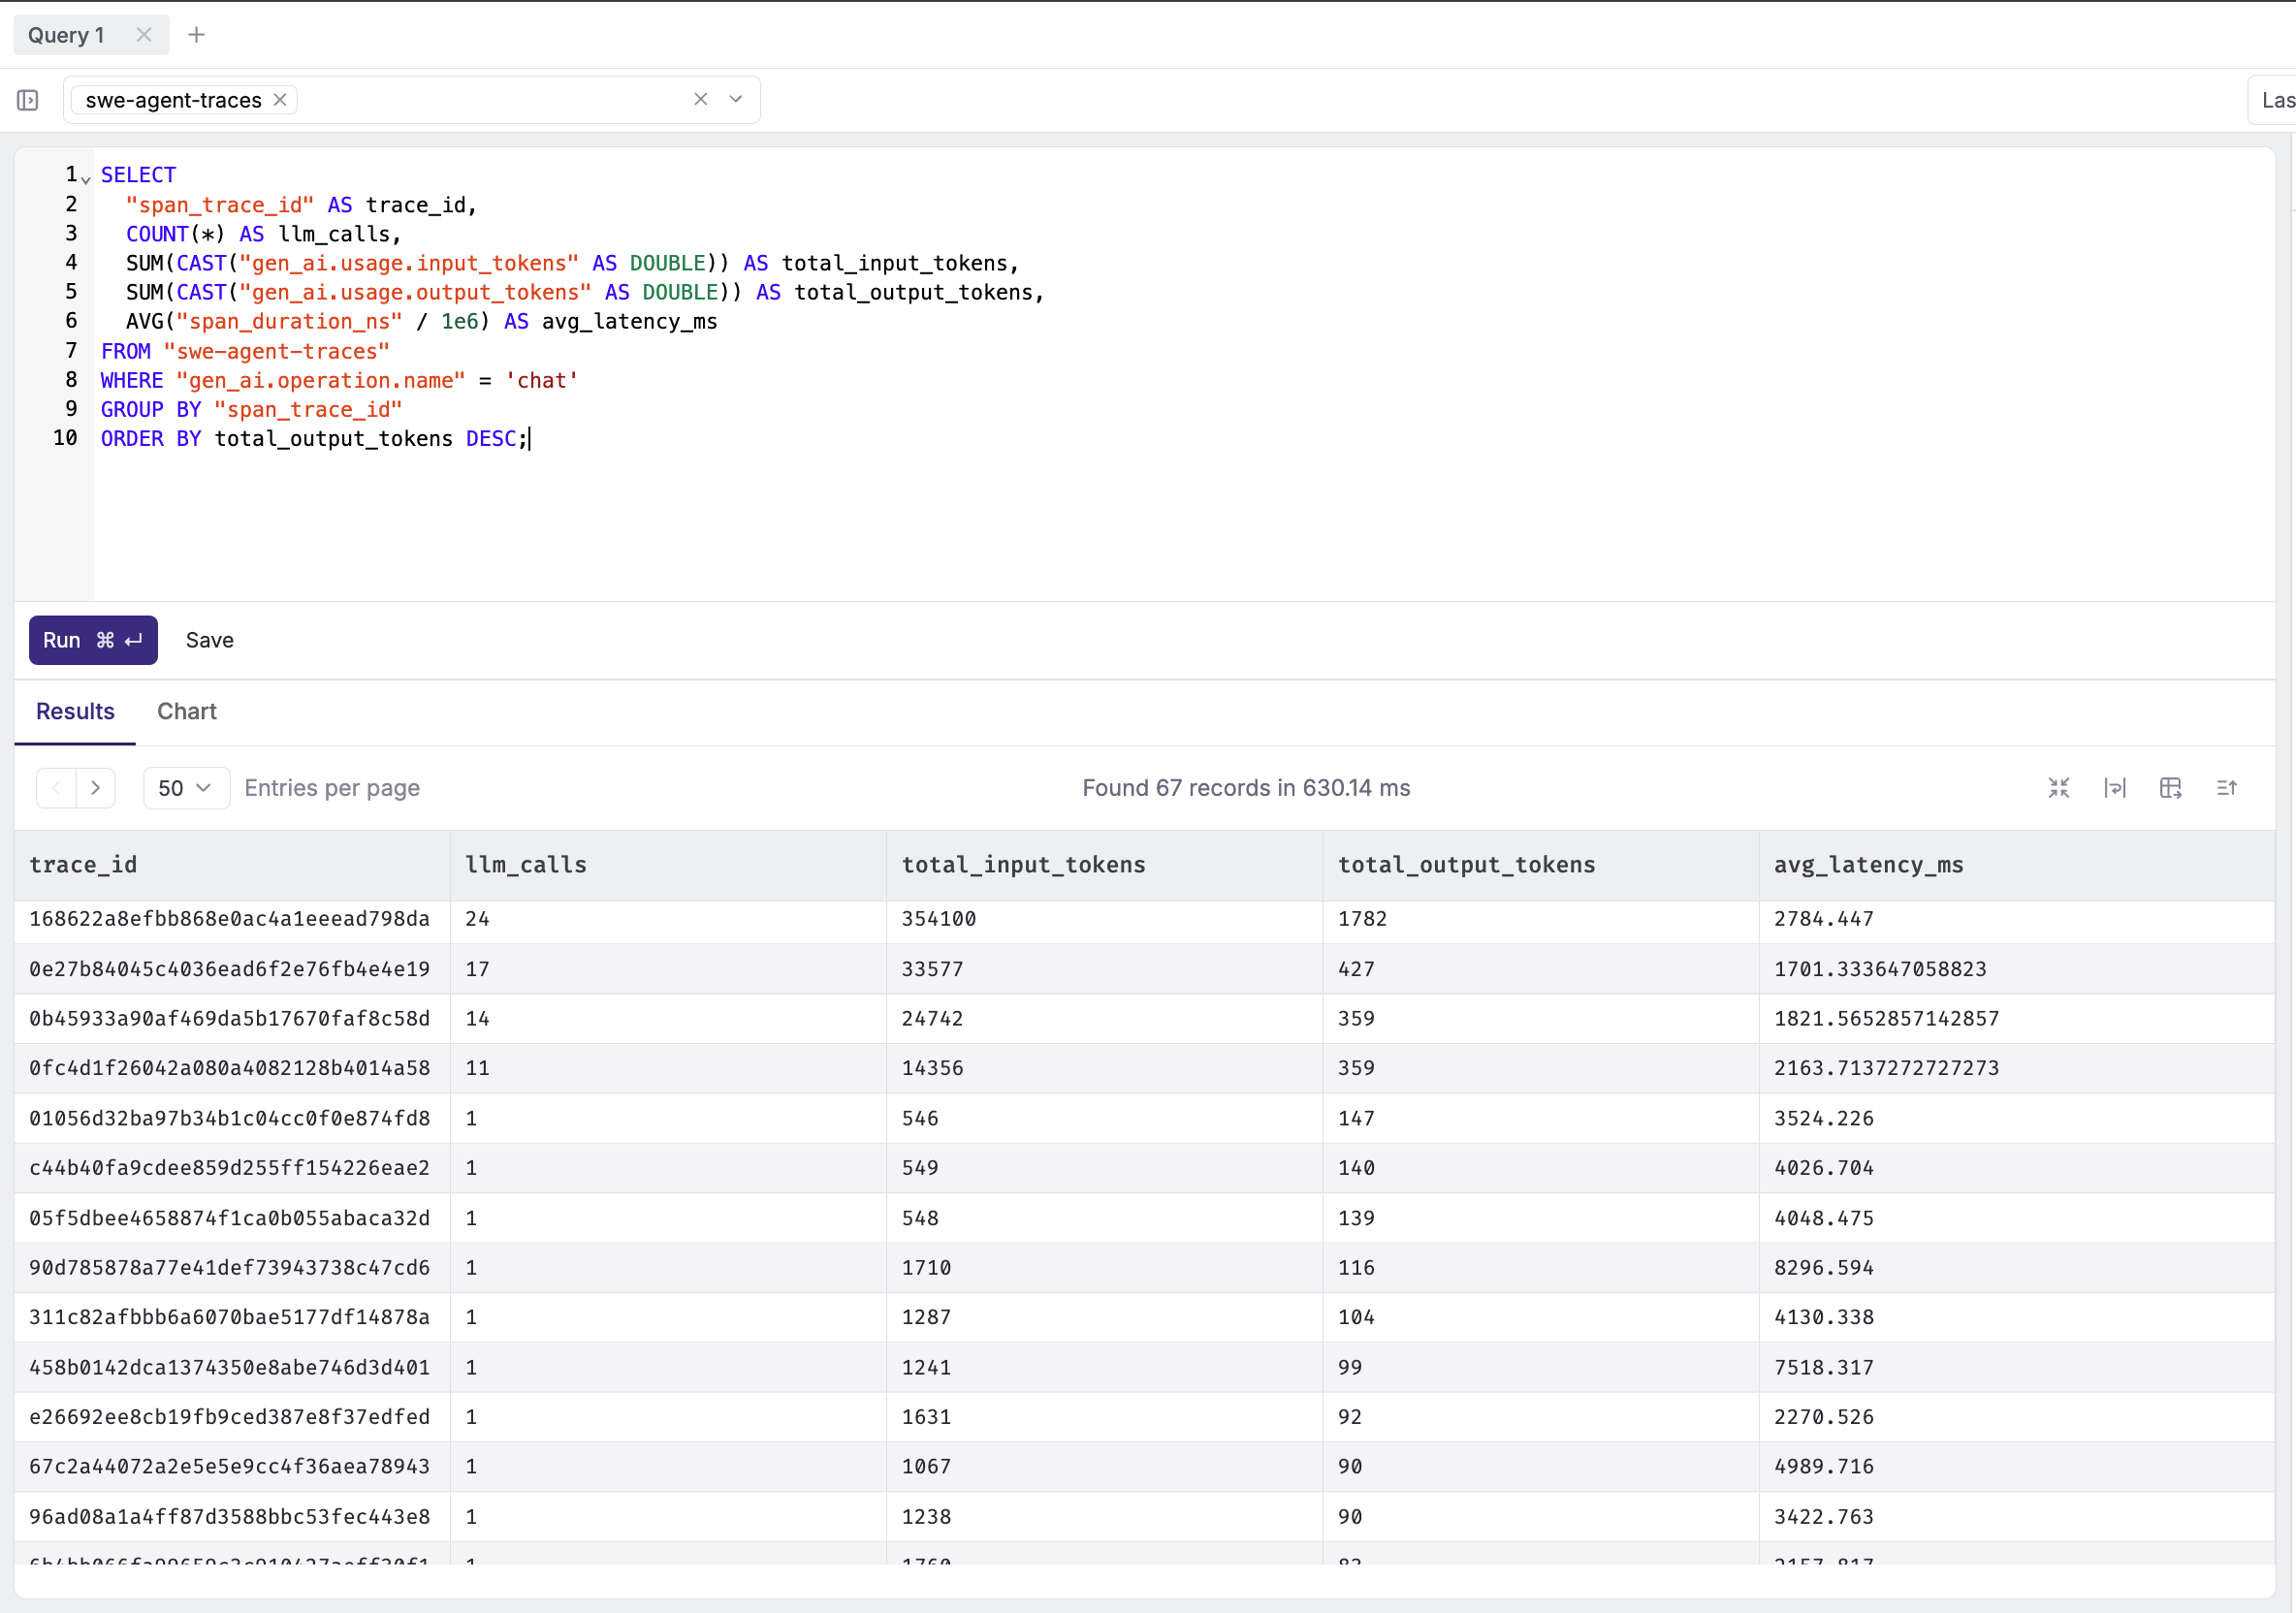
Tool usage breakdown:
SELECT
  "swe-agent-traces"."gen_ai.tool.name" AS tool,
  COUNT(*) AS call_count,
  AVG("swe-agent-traces"."span_duration_ns") / 1e6 AS avg_duration_ms,
  SUM(CASE WHEN "swe-agent-traces"."error.type" IS NOT NULL THEN 1 ELSE 0 END) AS errors
FROM "swe-agent-traces"
WHERE "swe-agent-traces"."gen_ai.operation.name" = 'execute_tool'
GROUP BY tool
ORDER BY call_count DESC;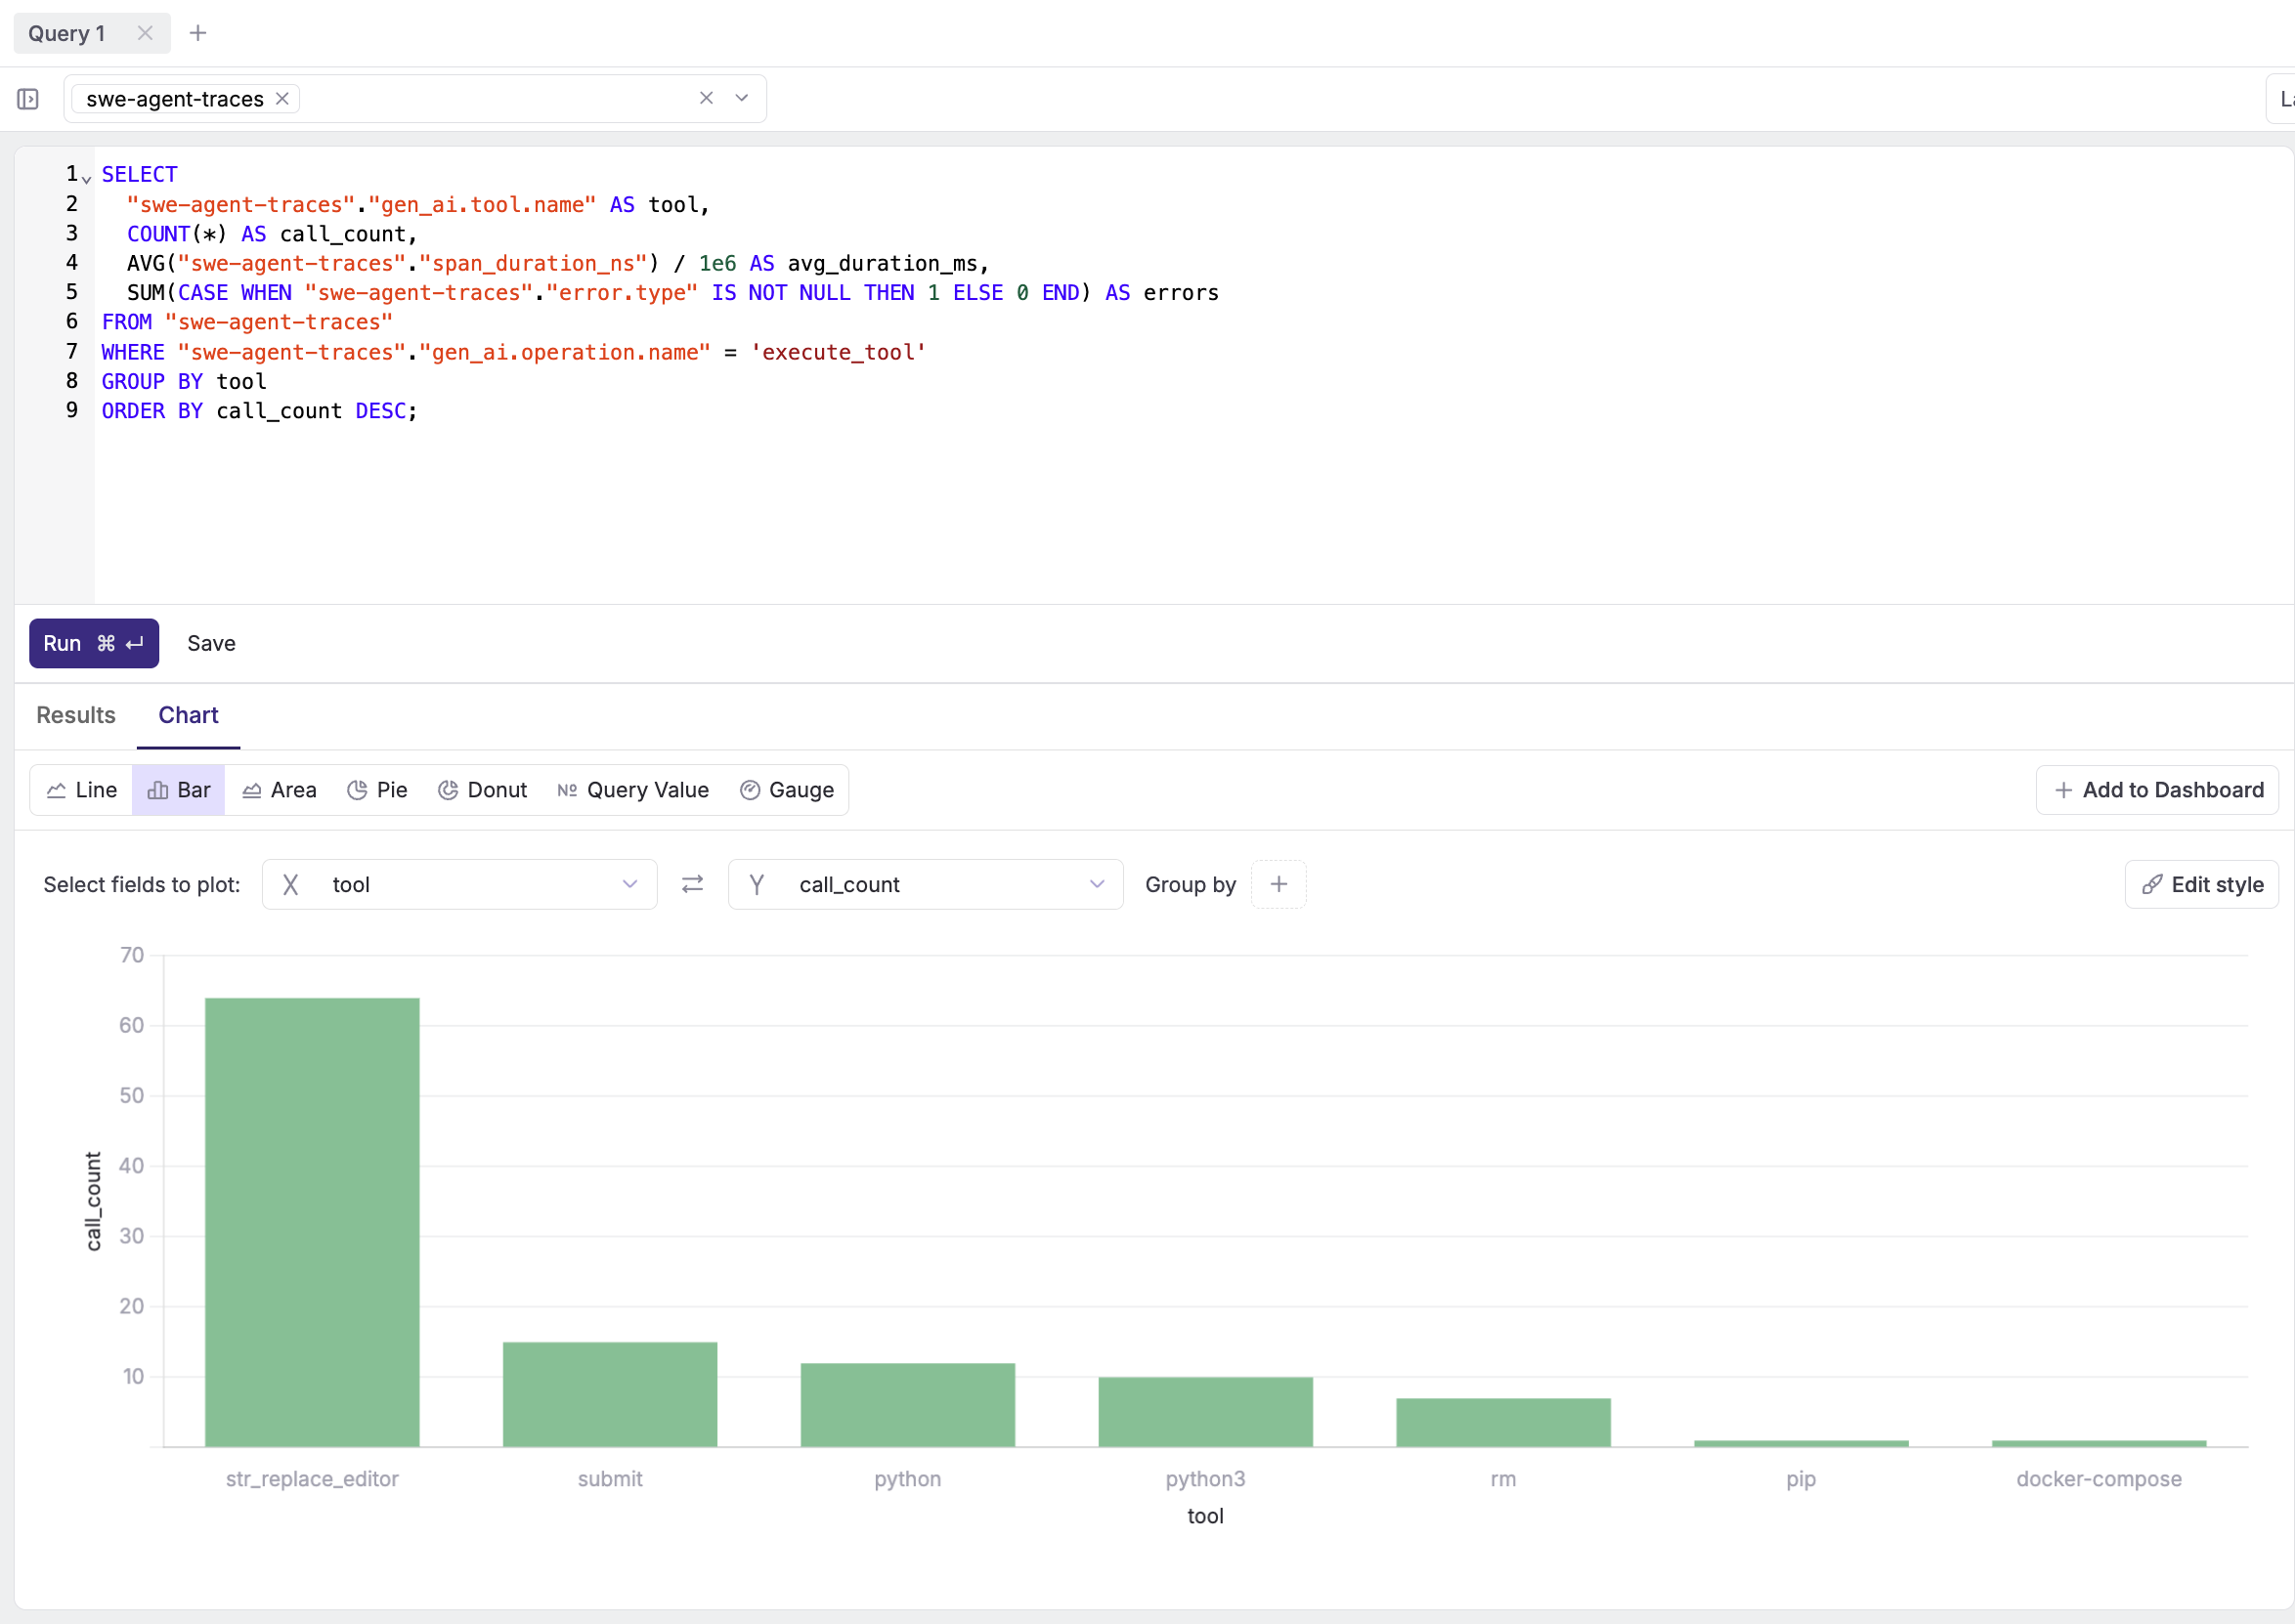
Failed tool executions:
SELECT
  "span_trace_id" AS trace_id,
  "gen_ai.tool.name" AS tool,
  "gen_ai.tool.call.arguments" AS arguments,
  "gen_ai.tool.call.result" AS result,
  "error.type" AS error_type,
  p_timestamp
FROM "swe-agent-traces"
WHERE "gen_ai.operation.name" = 'execute_tool'
  AND "error.type" IS NOT NULL
ORDER BY p_timestamp DESC;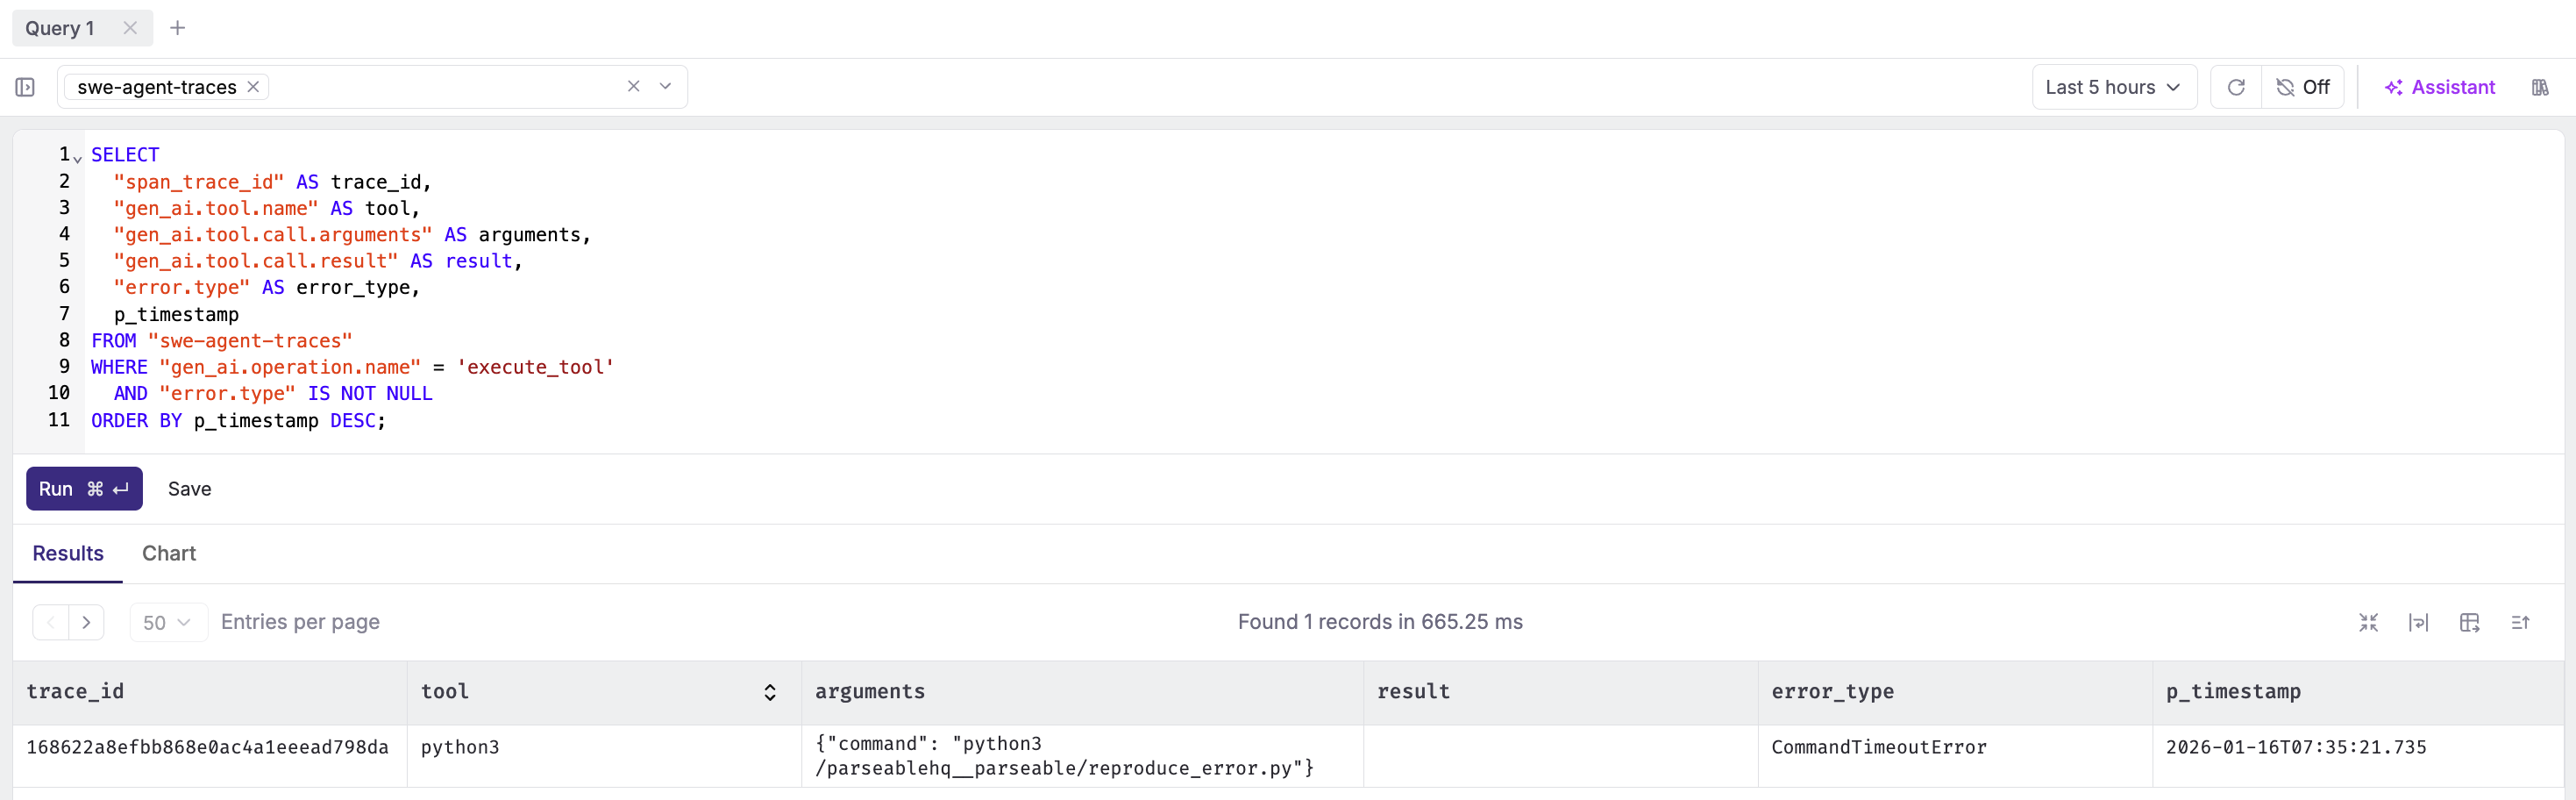
Cost estimation (GPT-4o pricing):
SELECT
  DATE_TRUNC('day', "swe-agent-traces".p_timestamp) AS day,
  COUNT(DISTINCT "swe-agent-traces".span_trace_id) AS agent_runs,
  SUM(CAST("swe-agent-traces"."gen_ai.usage.input_tokens" AS DOUBLE)) AS input_tokens,
  SUM(CAST("swe-agent-traces"."gen_ai.usage.output_tokens" AS DOUBLE)) AS output_tokens,
  ROUND(
    SUM(CAST("swe-agent-traces"."gen_ai.usage.input_tokens" AS DOUBLE)) * 0.0000025 +
    SUM(CAST("swe-agent-traces"."gen_ai.usage.output_tokens" AS DOUBLE)) * 0.00001,
    4
  ) AS estimated_cost_usd
FROM "swe-agent-traces"
WHERE "swe-agent-traces"."gen_ai.operation.name" = 'chat'
GROUP BY day
ORDER BY day DESC;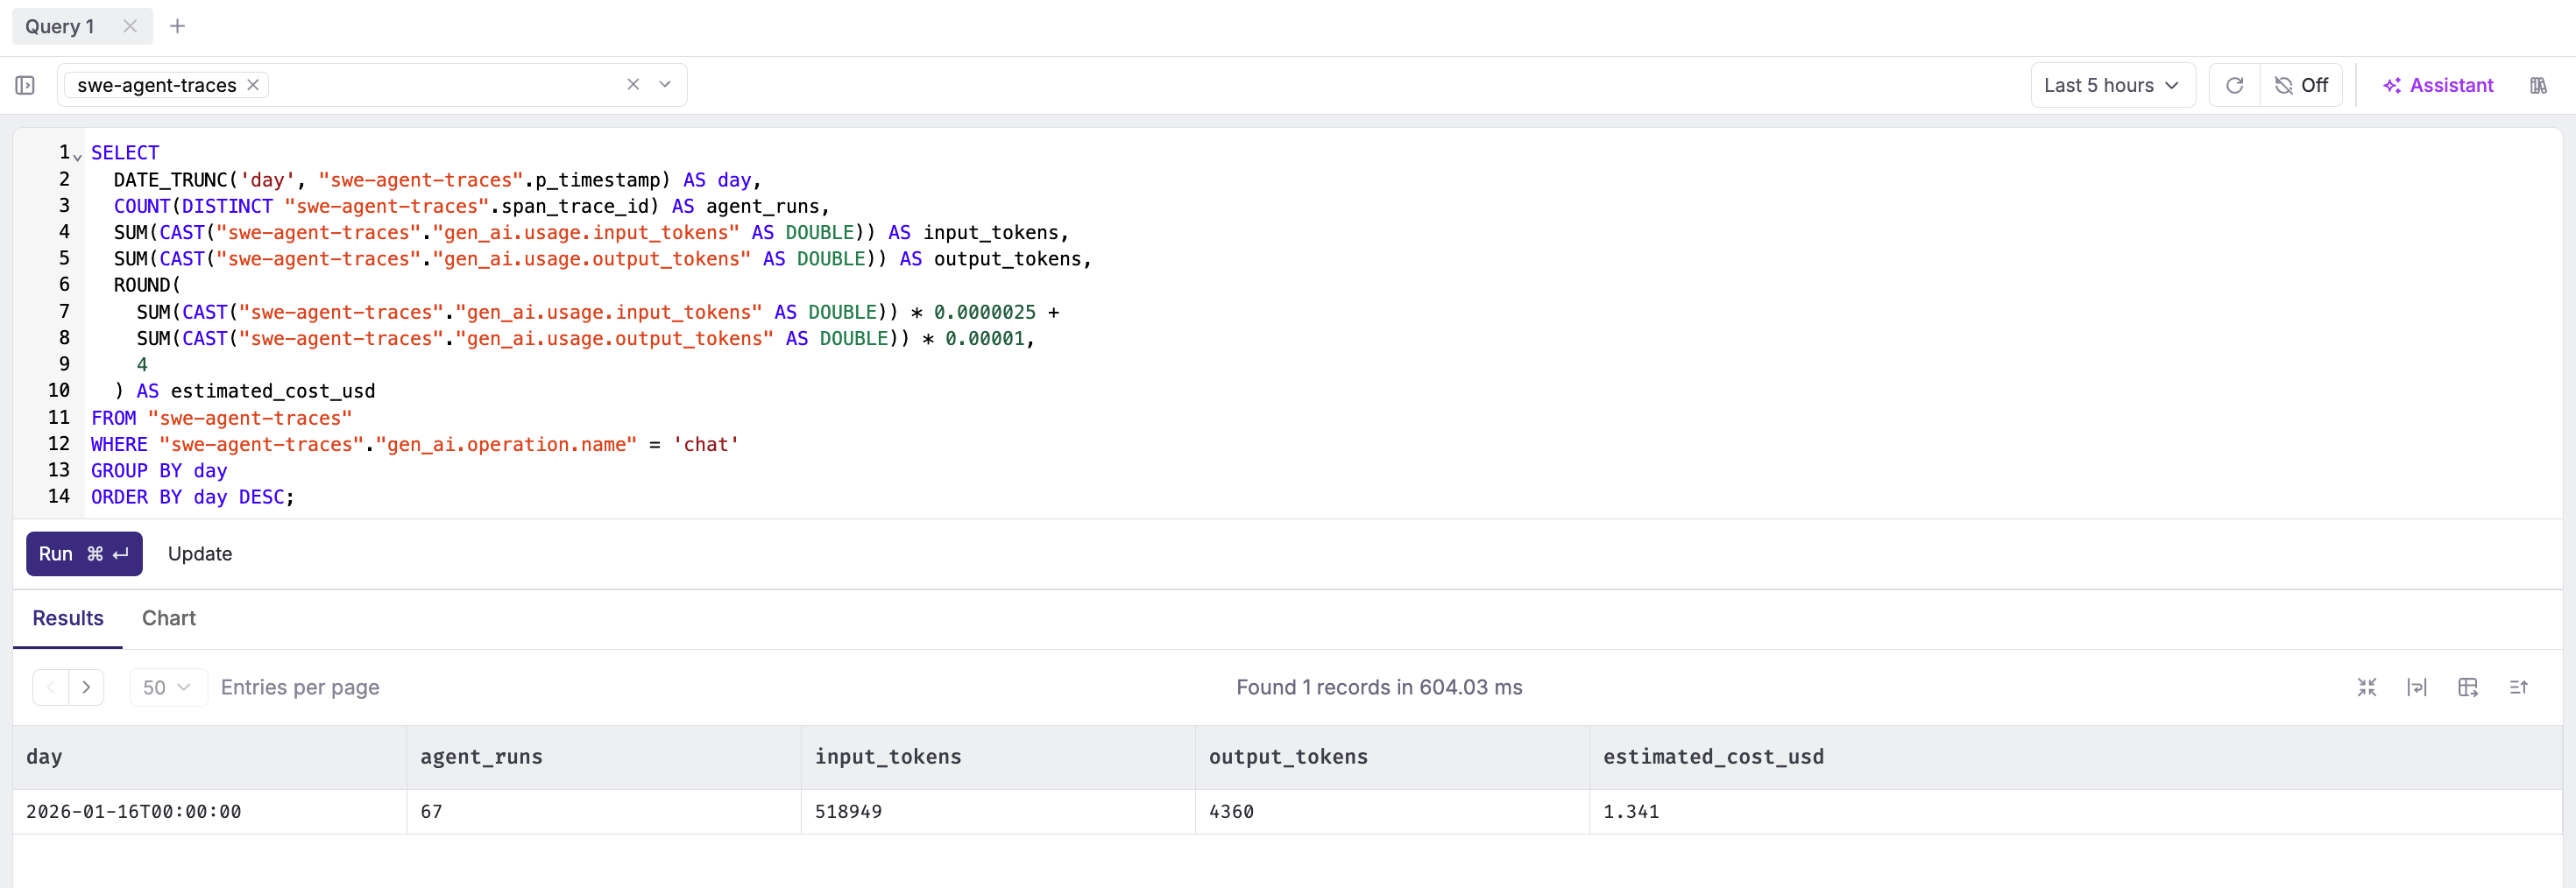
Step 9: Set Up Alerts
High Token Usage Alert
- Navigate to Alerts → Create Alert
- Configure:
- Dataset:
swe-agent-traces - Filter:
gen_ai.operation.name = 'invoke_agent' - Monitor Field:
gen_ai.usage.output_tokens - Aggregation:
SUM - Alert Type: Threshold
- Condition: Greater than
50000in1 hour
- Dataset:
Tool Failure Anomaly
- Create alert:
- Dataset:
swe-agent-traces - Filter:
gen_ai.operation.name = 'execute_tool' AND error.type IS NOT NULL - Monitor Field:
All rows (*) - Aggregation:
COUNT - Alert Type: Anomaly Detection
- Sensitivity: High
- Dataset:
Slow Agent Runs
- Create alert:
- Dataset:
swe-agent-traces - Filter:
gen_ai.operation.name = 'invoke_agent' - Monitor Field:
span_duration_ms - Aggregation:
AVG - Alert Type: Threshold
- Condition: Greater than
120000(2 minutes)
- Dataset:
Privacy Considerations
The instrumentation captures prompts, responses, and tool arguments by default. This is invaluable for debugging but raises concerns for production:
What gets captured:
- Full prompt text (may contain user data, API keys, PII)
- LLM responses (may contain generated secrets or sensitive logic)
- Tool arguments (file paths, command outputs, code snippets)
Mitigation strategies:
- Disable content capture entirely:
# Don't set these attributes in production
# span.set_attribute("gen_ai.input.messages", ...)
# span.set_attribute("gen_ai.output.messages", ...)
# span.set_attribute("gen_ai.tool.call.arguments", ...)
# span.set_attribute("gen_ai.tool.call.result", ...)- Use environment variable:
export OTEL_INSTRUMENTATION_GENAI_CAPTURE_MESSAGE_CONTENT=false- Truncate large content:
def truncate(content: str, max_len: int = 1000) -> str:
    if len(content) > max_len:
        return content[:max_len] + "...[truncated]"
return content- Redact sensitive patterns:
import re

def redact_secrets(content: str) -> str:
    patterns = [
        (r'sk-[a-zA-Z0-9]{48}', '[OPENAI_KEY]'),
        (r'ghp_[a-zA-Z0-9]{36}', '[GITHUB_TOKEN]'),
        (r'password["\s:=]+["\']?[\w@#$%^&*]+', 'password=[REDACTED]'),
    ]
    for pattern, replacement in patterns:
        content = re.sub(pattern, replacement, content, flags=re.IGNORECASE)
    return content
The right balance depends on your use case. For development and debugging, capture everything. For production, capture metadata (tokens, durations, tool names) but redact content.
The Bigger Picture: Agent Observability
Tracing is just the beginning. Once you have structured telemetry flowing into Parseable, you can build:
Cost attribution dashboards. Which teams are burning the most tokens? Which problem types are most expensive to solve?
Performance baselines. What's the p50/p95 latency for your agent? How does it vary by model, task type, or time of day?
Failure analysis. When agents fail, what's the common pattern? Context window overflow? Tool errors? Rate limits?
A/B testing infrastructure. Compare GPT-4o vs Claude 3.5 on the same tasks. Which model produces better patches with fewer iterations?
Regression detection. Did that prompt change increase token usage? Did the new tool implementation slow things down?
The traces you're collecting today become the training data for understanding agent behavior at scale.
Conclusion
Coding agents are no longer experimental. They're fixing real bugs, writing production code, and costing real money. The question isn't whether to use them, it's how to operate them responsibly.
Traditional observability tools weren't built for this. They don't understand that a 3-second "API call" is actually an LLM reasoning through a complex problem. They don't know that token counts matter more than request counts. They can't show you the chain of thought that led to a broken patch.
OpenTelemetry's GenAI semantic conventions change this. They give us a standard vocabulary for AI telemetry. And Parseable gives us the SQL interface to actually use it, with the storage economics to keep months of agent history without breaking the budget.
The instrumented SWE-agent fork is your starting point. Clone it, run it against a real issue, and watch the traces flow in. You'll never look at agent logs the same way again.
Every prompt. Every tool call. Every token. All queryable with SQL. That's the future of agent observability.

