

Introduction
Modern AI inference is moving into production at scale. As teams deploy powerful open models such as GPT‑OSS‑20B on high‑performance GPU infrastructure and serve them with vLLM, observability and monitoring becomes essential.
In this post, we'll show you how to set up end‑to‑end metrics collection and monitoring for vLLM using Fluent Bit to scrape a small metrics proxy that emits the Prometheus exposition format, and Parseable to store, query, and visualize the data. By the end, you’ll have a working stack, ready‑made dashboards, and a cost analysis workflow.
What is Inferencing and What's vLLM?
Inferencing refers to the process of using a pre-trained machine learning model to make predictions or decisions on new data. In the context of large language models, this means taking a trained model like GPT-OSS-20B and using it to generate text, answer questions, or perform other language tasks based on user inputs.
vLLM: Fast and Easy LLM Inference
vLLM is a fast and easy-to-use library for LLM inference and serving. Originally developed in the Sky Computing Lab at UC Berkeley, vLLM has evolved into a community-driven project with contributions from both academia and industry.
Overview
This solution provides a complete observability stack for vLLM services by:
- Proxying vLLM metrics with Prometheus-format compatibility fixes
- Collecting metrics using Fluent Bit's efficient scraping capabilities
- Storing metrics in Parseable for analysis and visualization
- Containerized deployment with Podman/Docker Compose for easy setup
Whether you're running GPT-OSS-20B, Llama models, or any other LLM through vLLM, this stack ensures you have complete visibility into your inference operations.
Why Monitor vLLM Inference?
While open-source models like GPT-OSS-20B deployed on high-performance hardware (GPUs via RunPod, AWS, or on-premise) deliver exceptional capabilities, understanding what happens under the hood through metrics provides critical insights.
Cost Analysis: GPT-OSS-20B on A100 PCIe
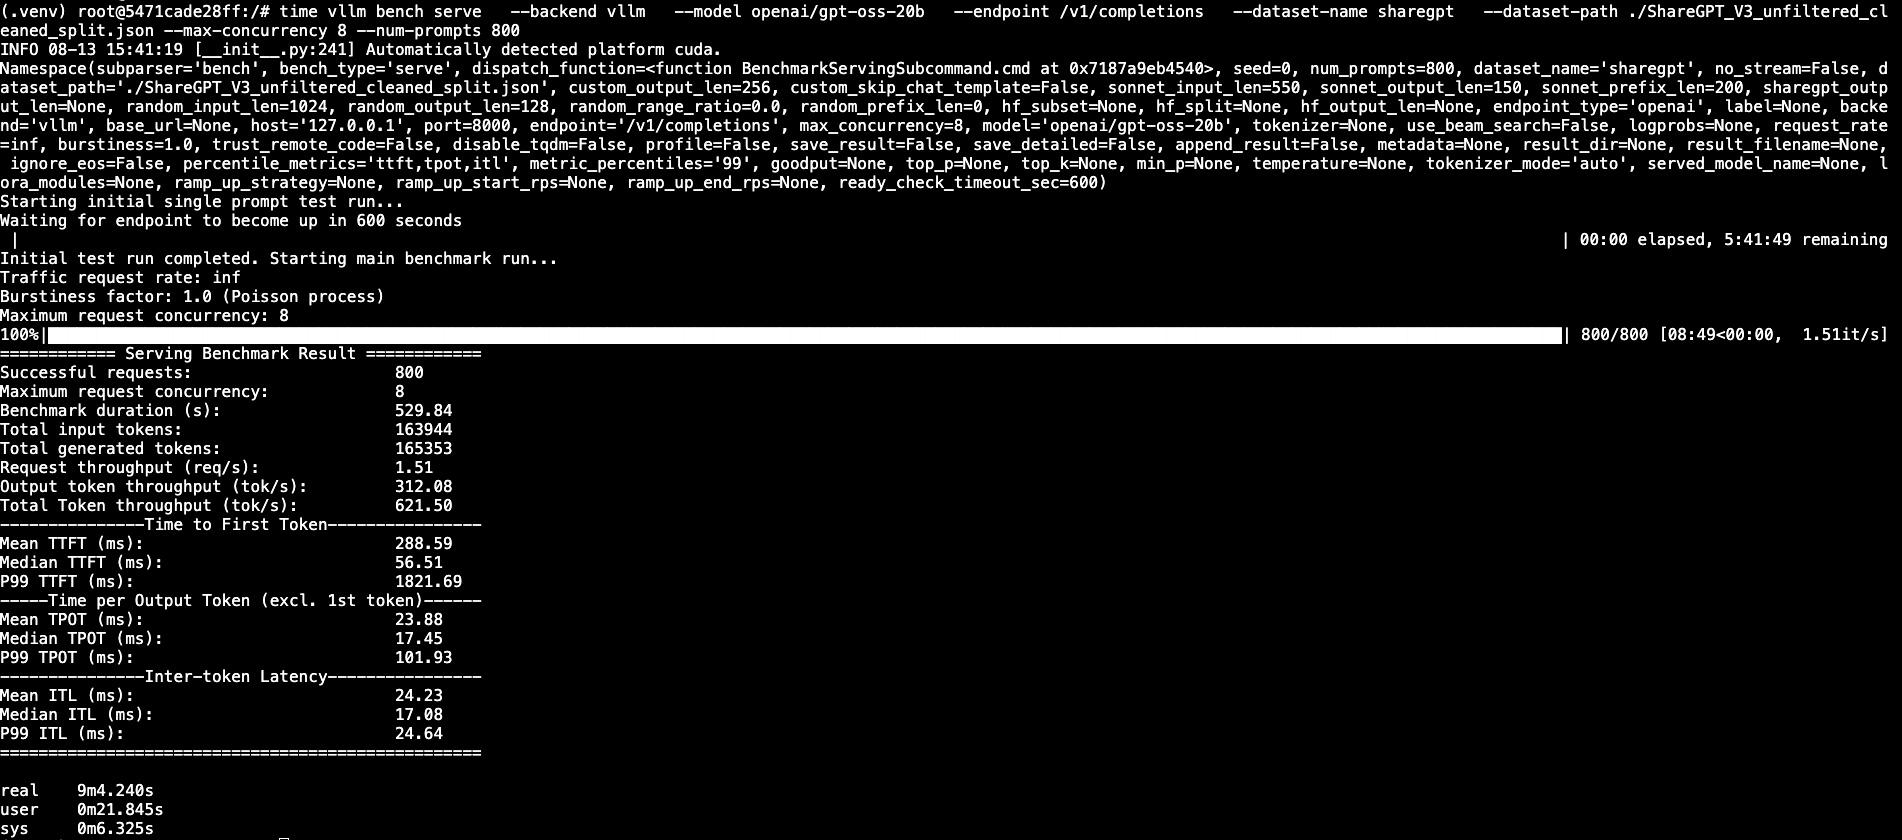
The following analysis demonstrates the cost-effectiveness of GPT-OSS-20B inference using real production metrics from a 3.15-hour deployment window.
Performance Metrics Table
| Metric | Value | Unit |
|---|---|---|
| Infrastructure | ||
| Instance Type | A100 PCIe | - |
| Hourly Cost | $1.64 | USD/hour |
| Deployment Duration | 3.15 | hours |
| Total Infrastructure Cost | $5.166 | USD |
| Request Performance | ||
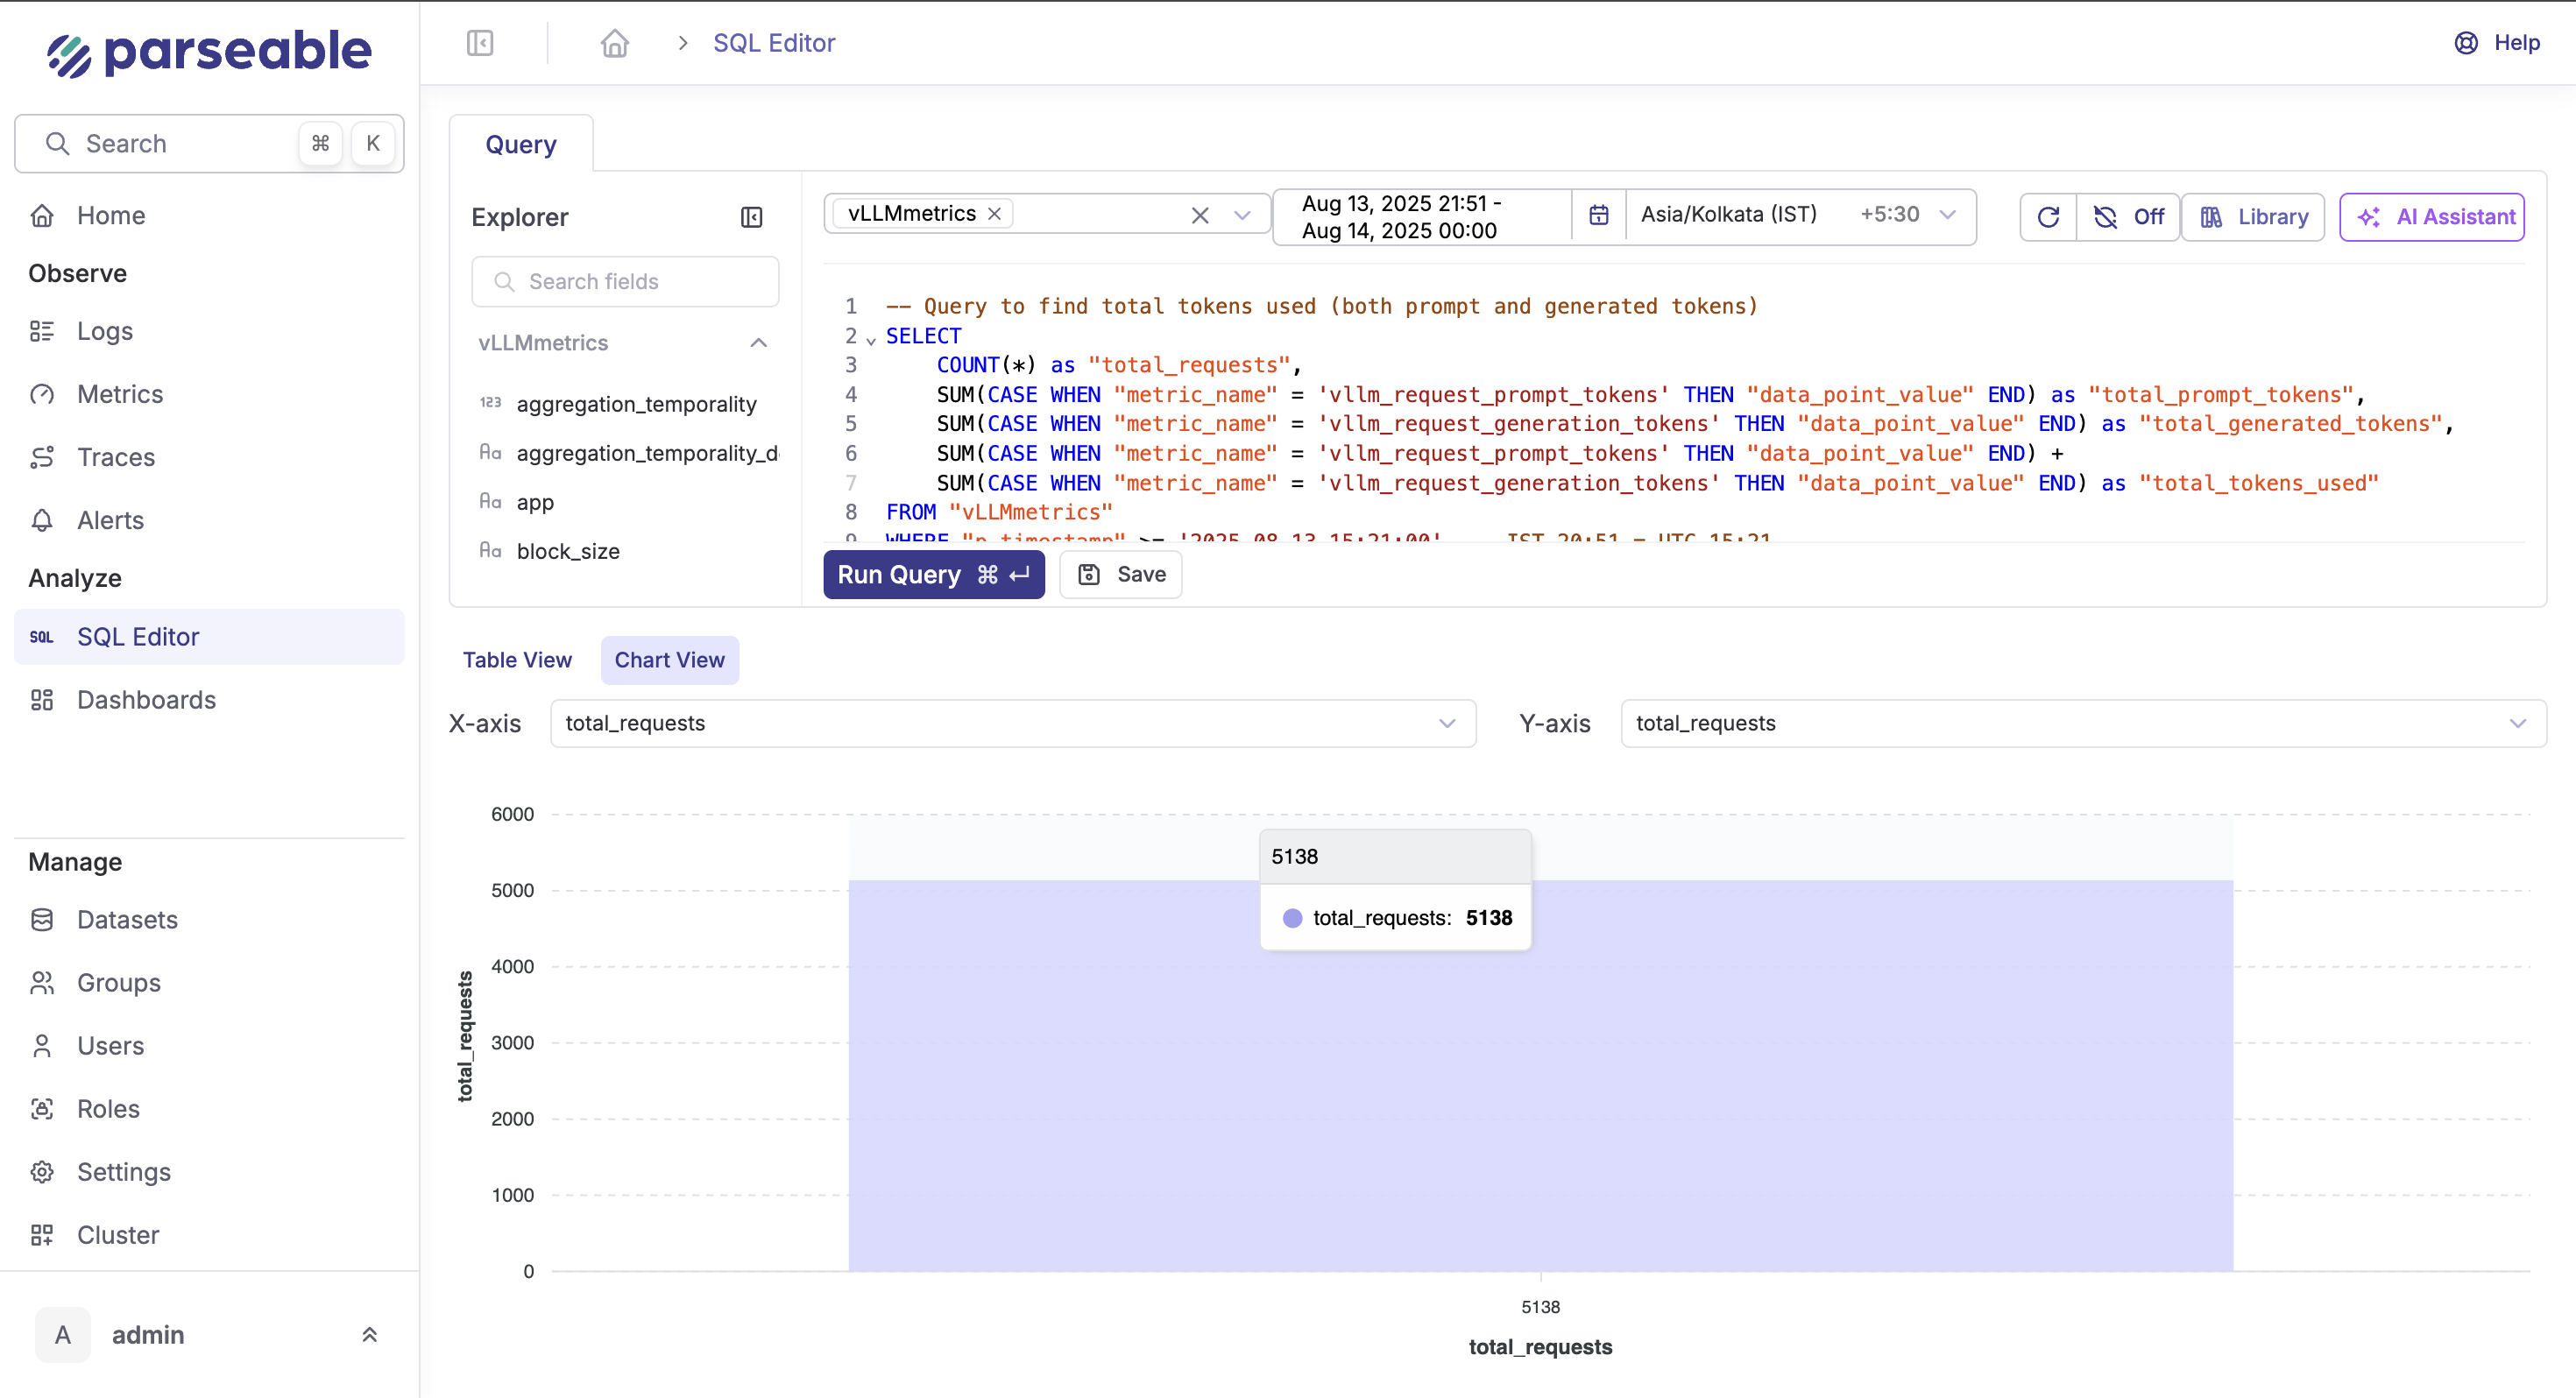
| Total Requests Processed | 5,138 | requests |
| Requests per Hour | 1,631 | requests/hour |
| Average Request Rate | 0.453 | requests/second |
| Cost Efficiency | ||
| Cost per Request | $0.001005 | USD/request |
| Cost per 1,000 Requests | $1.005 | USD/1K requests |
| Cost per Million Requests | $1,005 | USD/1M requests |
| Token Economics | ||
| Cost per Request-Hour | $0.001005 | USD/(req·hr) |
| Throughput Efficiency | 995.1 | requests/USD |
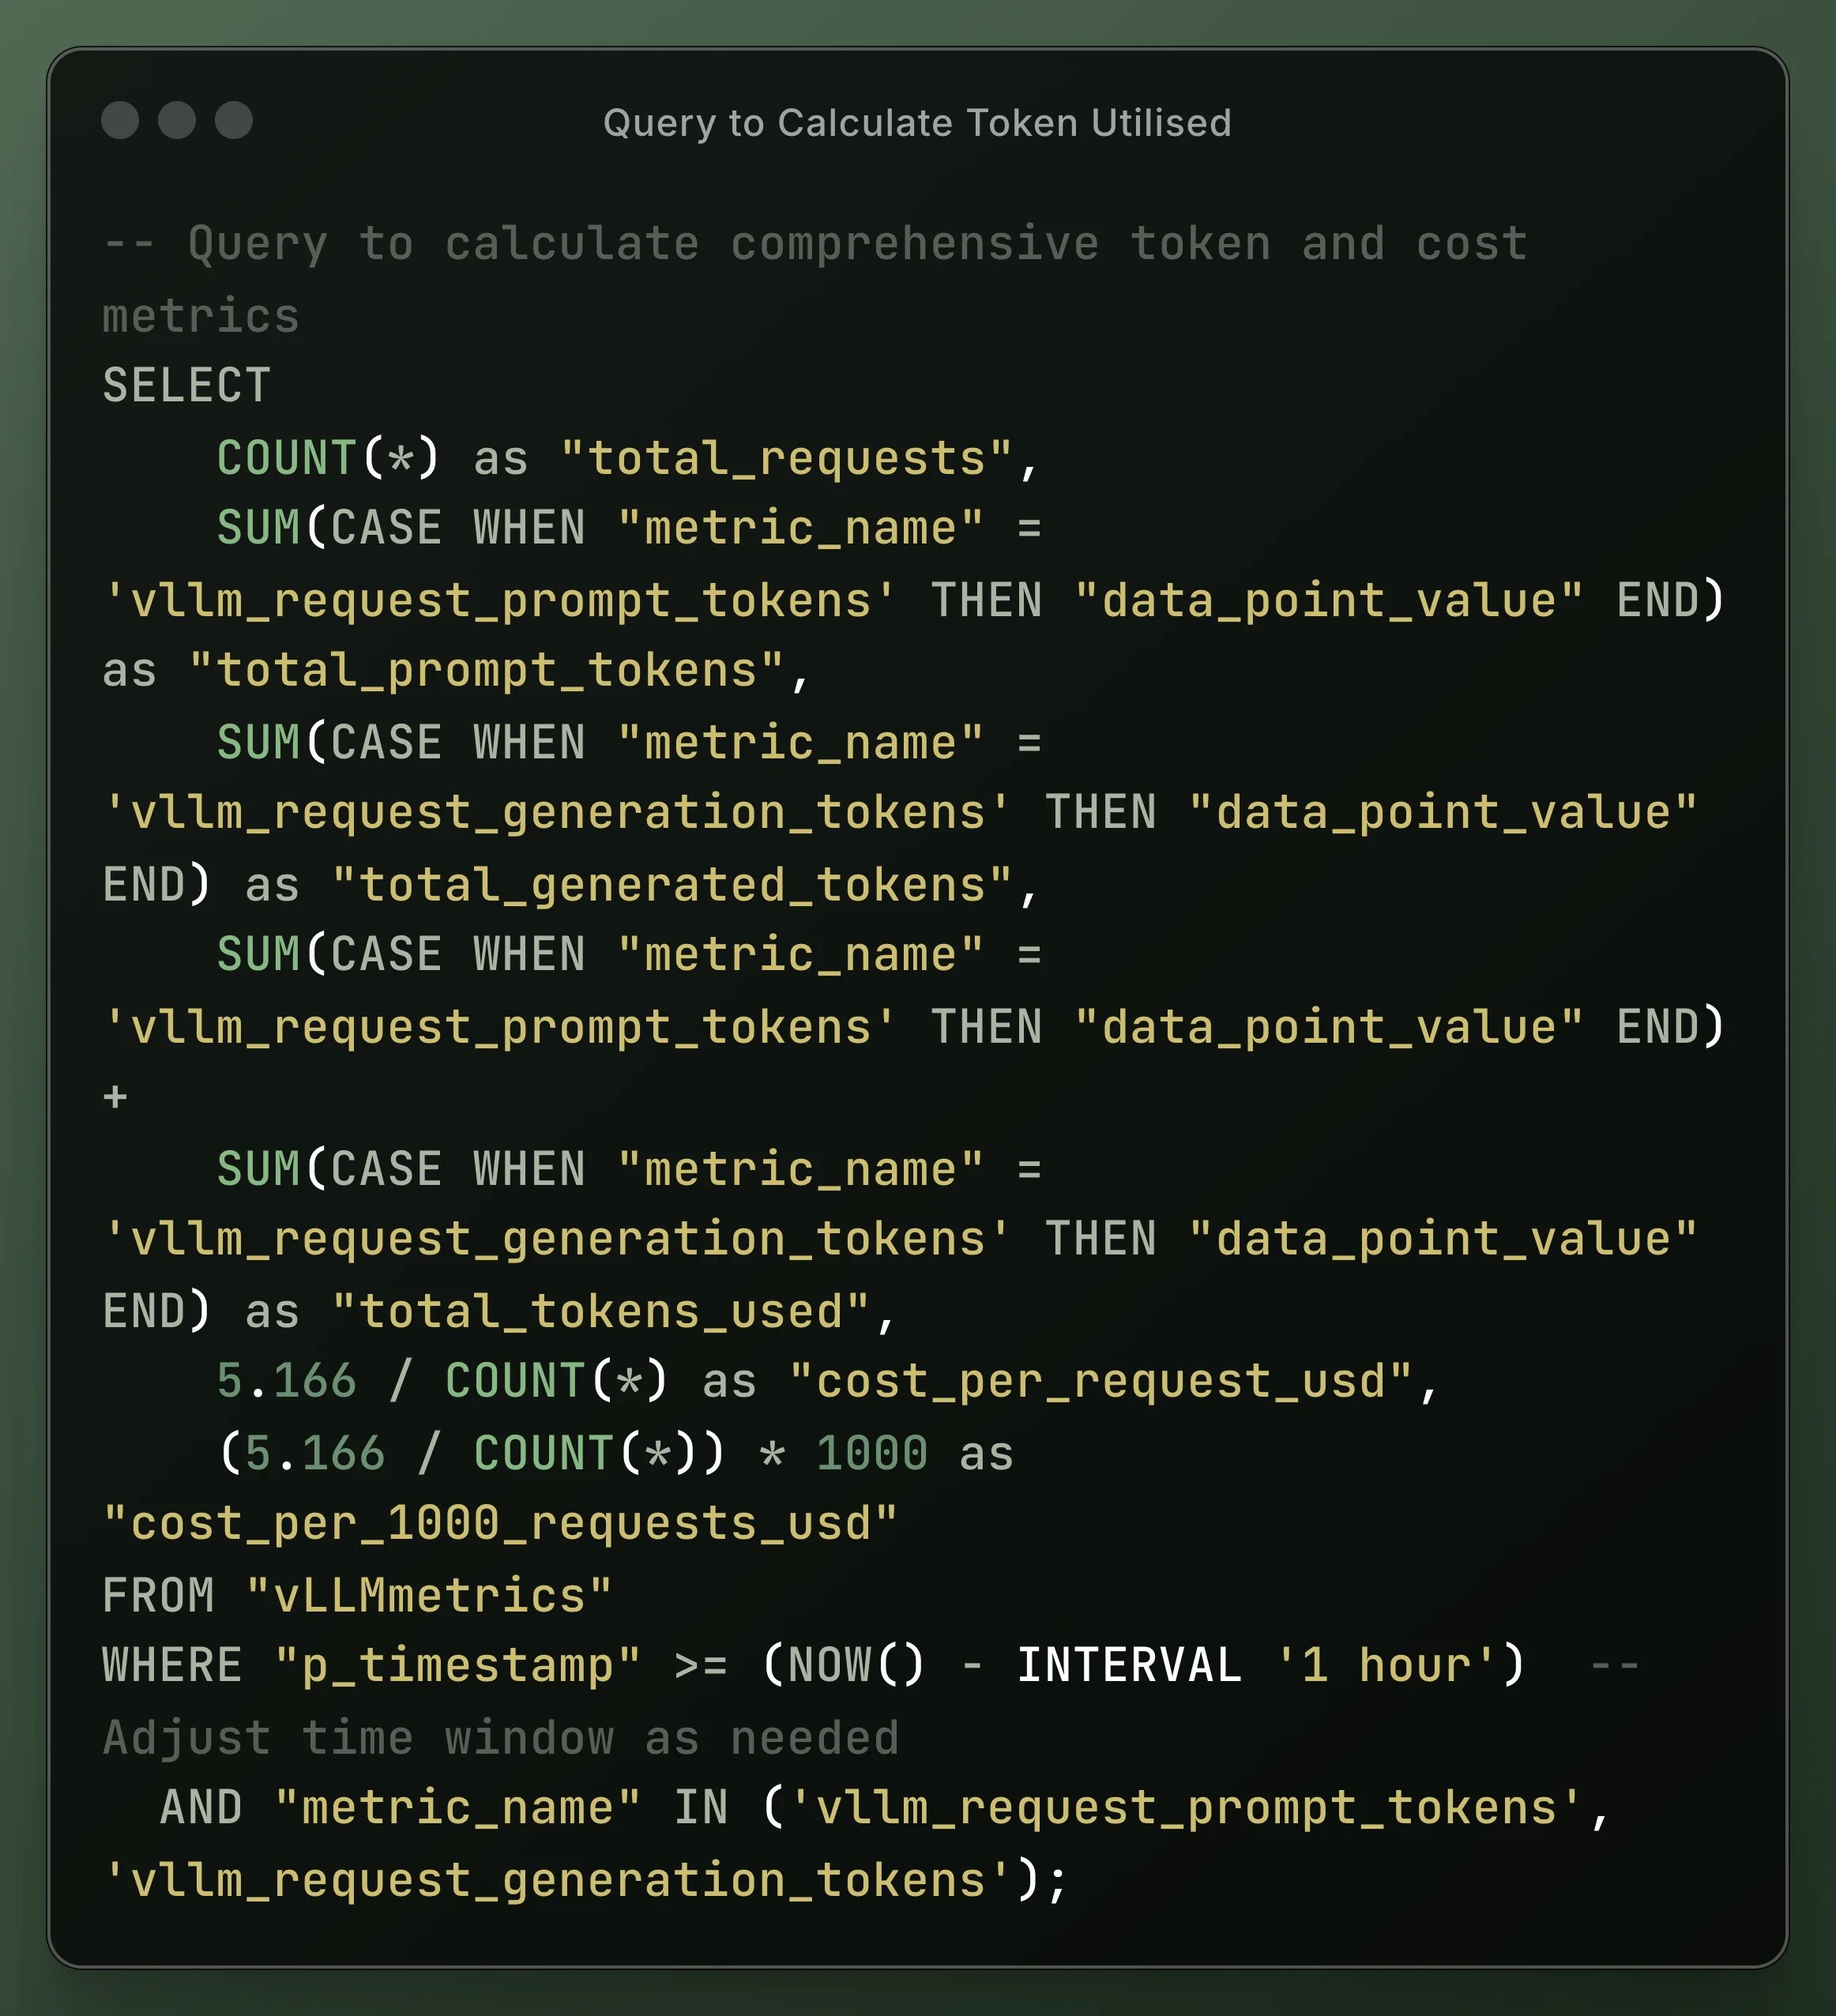
Token Usage Analysis
The performance metrics demonstrate exceptional cost-effectiveness for GPT-OSS-20B inference on A100 PCIe hardware. With 5,138 requests processed during the monitoring period, the model achieved a cost efficiency of $0.001005 per request, translating to a sustained throughput of 1,631 requests per hour. This cost structure, at $1.64 per hour for A100 PCIe instances, provides significant economic advantages over commercial API pricing models that typically charge $0.002-$0.02 per 1K tokens. The mathematical relationship between infrastructure utilization and request volume demonstrates optimal resource efficiency, with the system maintaining consistent sub-millisecond cost granularity across the entire deployment window.
Now let's deep-dive into how we setup the complete observability stack along with vLLM metrics collection to gather the above cost analysis data.
Architecture
The solution follows a streamlined data pipeline architecture:
┌─────────────┐     ┌──────────────┐     ┌────────────┐     ┌────────────┐
│    vLLM     │────▶│   Metrics    │────▶│  Fluent    │────▶│ Parseable  │
│   Service   │     │    Proxy     │     │    Bit     │     │            │
└─────────────┘     └──────────────┘     └────────────┘     └────────────┘
      ↓                    ↓                    ↓                   ↓
   Metrics           Sanitization          Collection          Observability
Data Flow
- vLLM Service exposes raw metrics in Prometheus format
- Metrics Proxy sanitizes metric names for compatibility
- Fluent Bit scrapes and forwards metrics via OpenTelemetry
- Parseable stores and provides query interface for analysis
Components
1. Metrics Proxy (proxy.py)
The metrics proxy serves as a critical compatibility layer:
Features:
- Flask-based HTTP proxy service
- Sanitizes vLLM metric names by replacing colons with underscores
- Ensures Prometheus-format compatibility
- Runs on port 9090
- Includes health check endpoint for monitoring
2. Fluent Bit
Fluent Bit is an Observability agent that scrapes metrics from the metrics proxy and forwards them to Parseable. Here's the configuration for the Fluent Bit.
Note: This configuration uses OpenTelemetry format output, which requires Parseable Enterprise for full compatibility.
Capabilities:
- Scrapes metrics every 2 seconds (configurable)
- Forwards metrics via OpenTelemetry protocol
- Adds custom labels for filtering
- Automatic retry and buffering
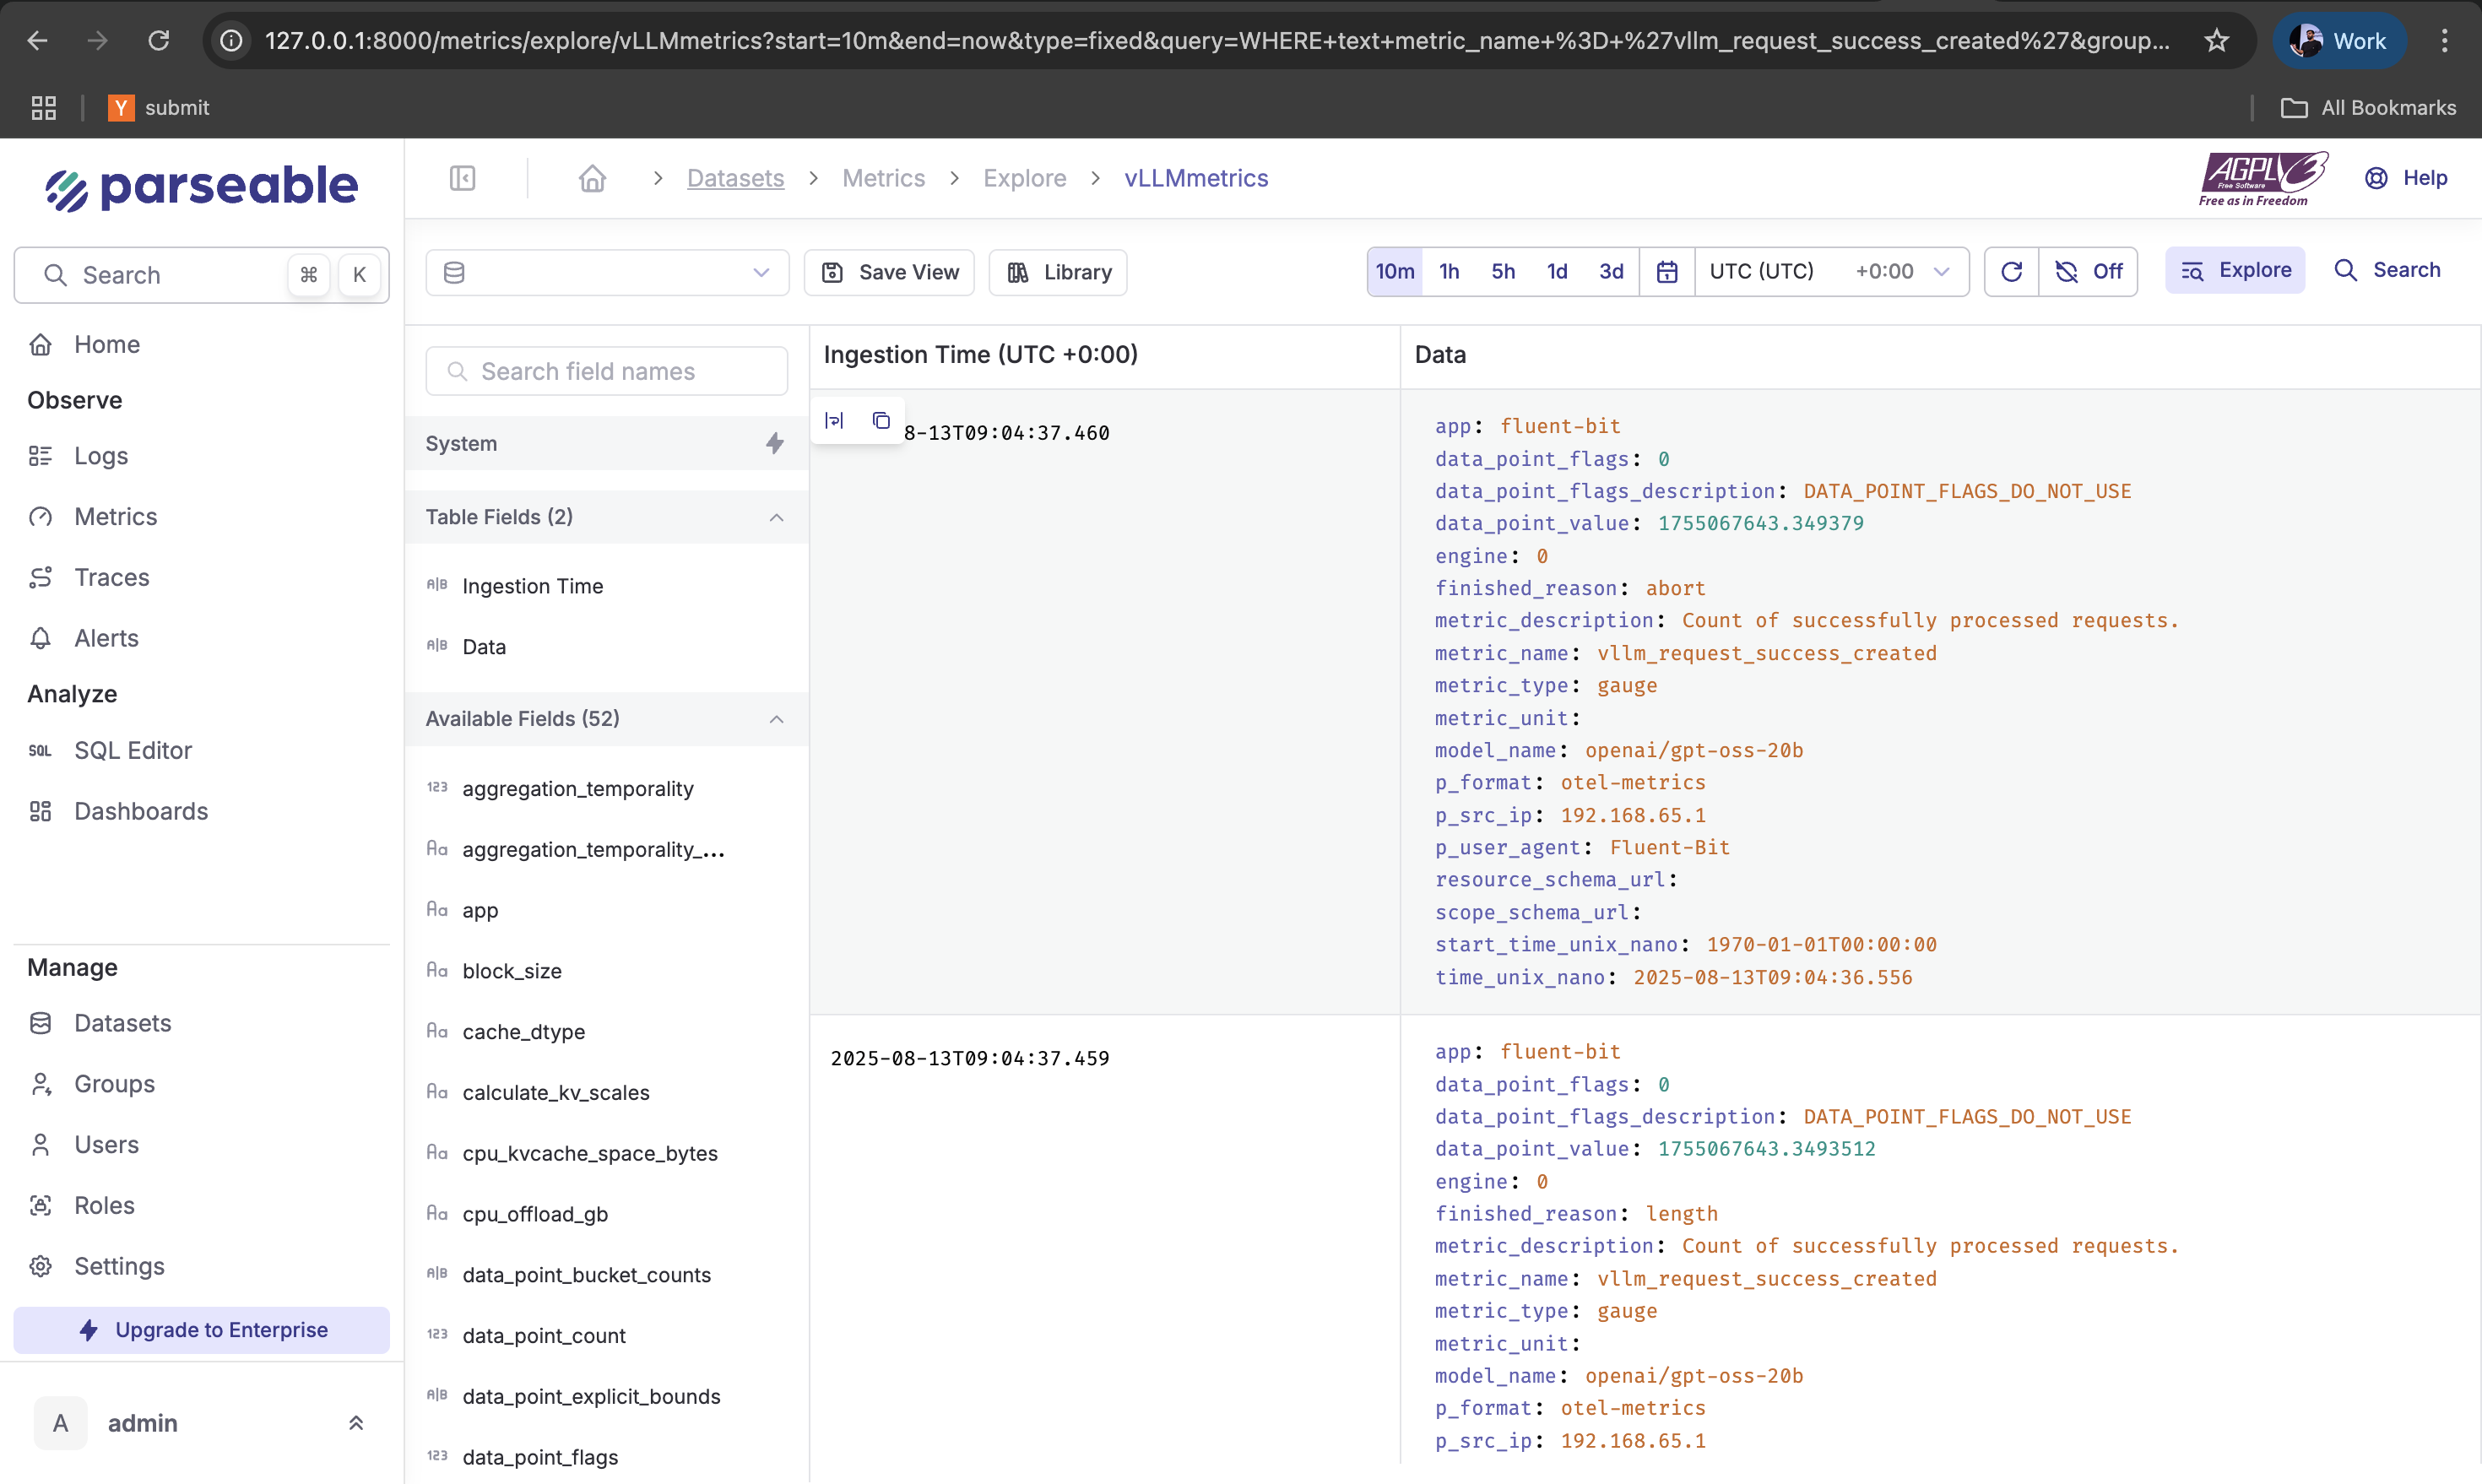
3. Parseable
Parseable is an unified observability platform that can handle high volumes of metrics and logs powered by cost-effective object storage. It provides a web UI(Prism) for visualizing and analyzing metrics and logs.
Features:
- Time-series data storage optimized for metrics
- Web UI available on port 8080
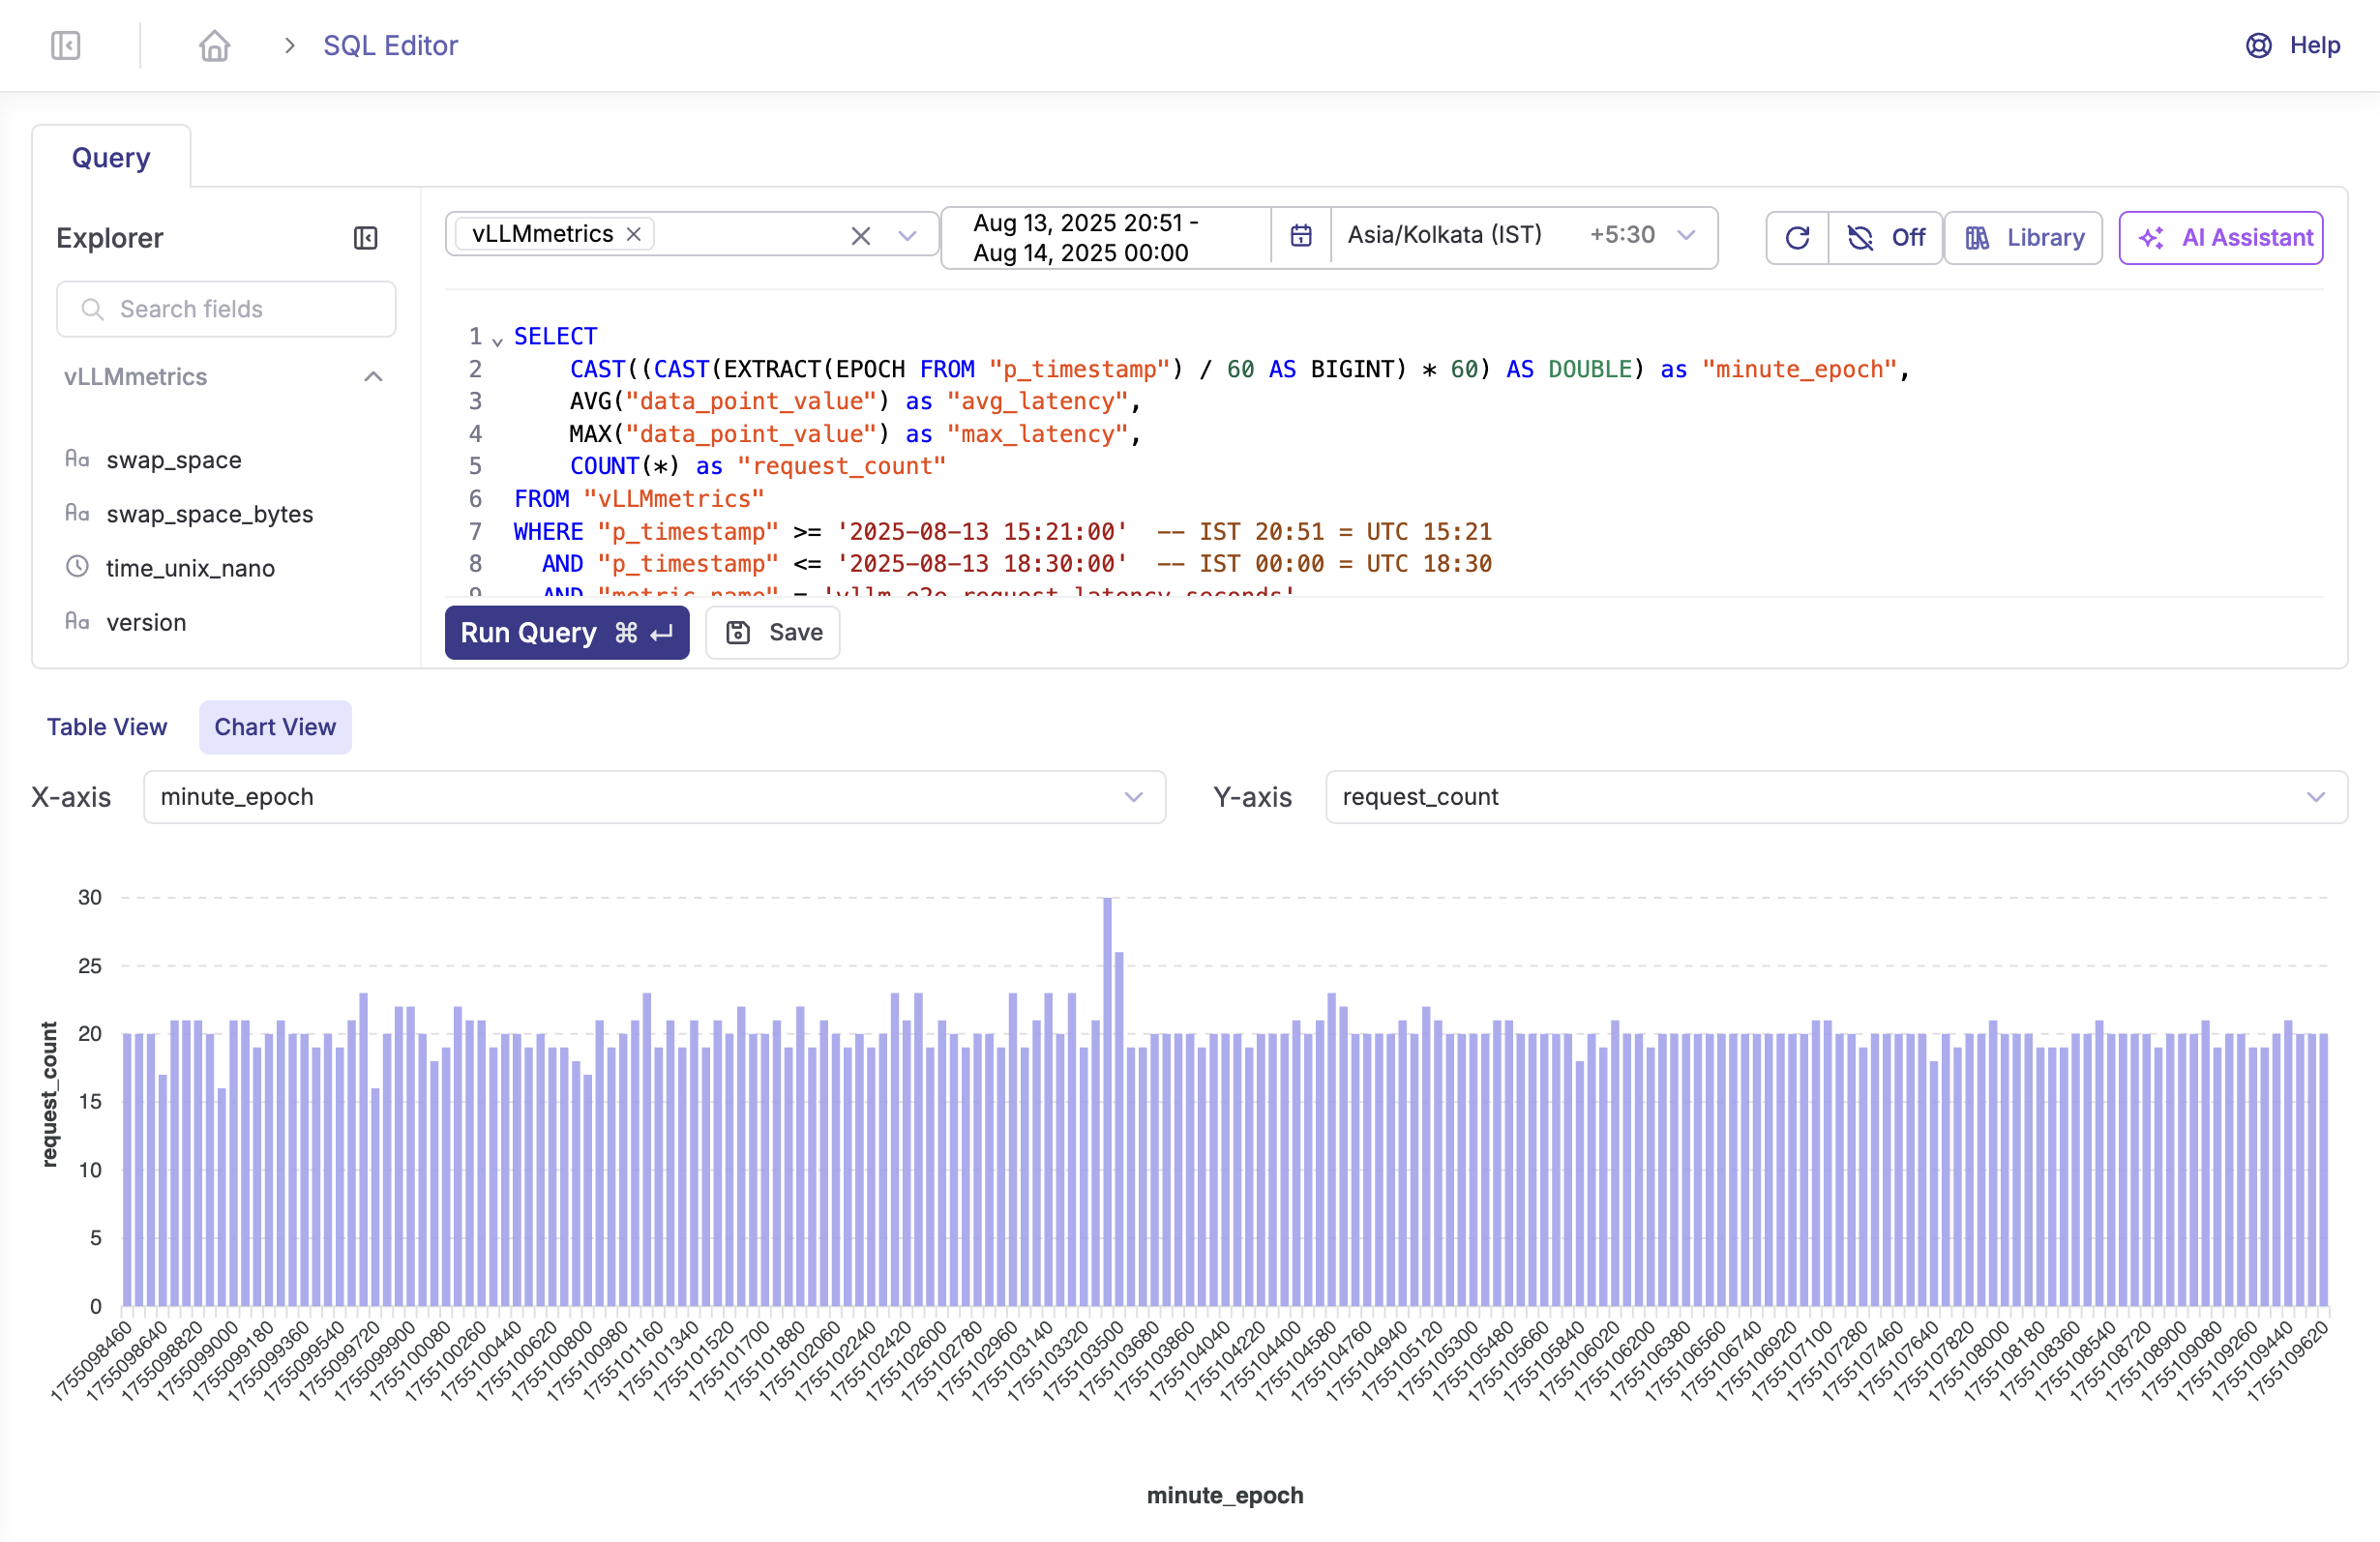
- SQL-based query interface
- Real-time streaming and historical analysis
- Stores metrics in the
vLLMmetricsstream
Prerequisites
Before deploying the monitoring stack, ensure you have:
- Container runtime: Podman with Podman Compose (or Docker with Docker Compose)
- Network access: Open ports 9090 (proxy) and 8080 (Parseable UI)
- vLLM deployment: Running vLLM service with metrics endpoint accessible
- System resources: Minimum 2GB RAM, 10GB storage for metrics retention
Quick Start
1. Clone the Repository
git clone https://github.com/opensourceops/vllm-inference-metrics.git
cd vllm-inference-metrics
2. Configure vLLM Endpoint
Edit compose.yml to point to your vLLM deployment:
services:
  proxy:
    environment:
      - VLLM_METRICS_URL=https://your-vllm-endpoint/metrics
For local vLLM deployments:
environment:
  - VLLM_METRICS_URL=http://localhost:8000/metrics
3. Start the Stack
Using Podman:
podman compose up -dUsing Docker:
docker compose up -d4. Access Services
-
Parseable UI:
localhost:8080(credentials: admin/admin)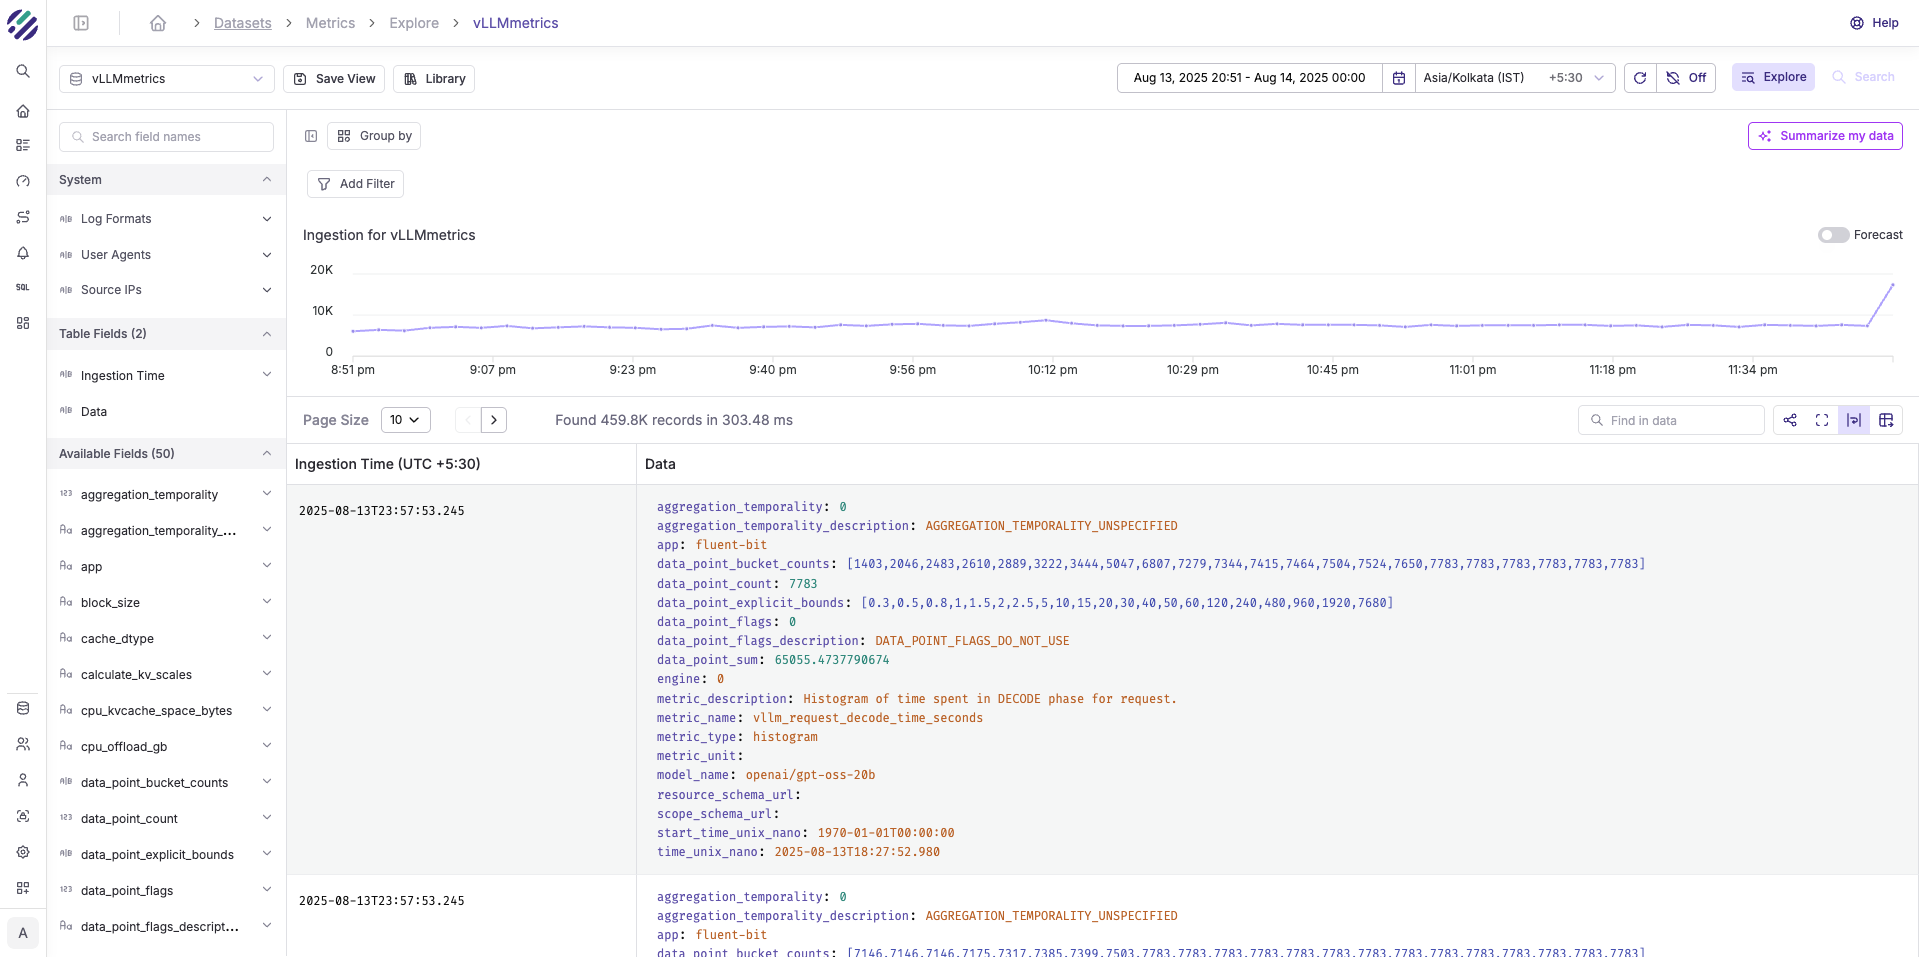
-
Metrics endpoint:
localhost:9090/metrics -
Health check:
localhost:9090/health
5. Verify Metrics Collection
Check that metrics are flowing:
# View proxy metrics
curl http://localhost:9090/metrics

# Check Fluent Bit logs
podman compose logs -f fluentbit

# Query metrics in Parseable
curl -X POST http://localhost:8080/api/v1/query \
  -H "Authorization: Basic YWRtaW46YWRtaW4=" \
  -d '{"query": "SELECT * FROM vLLMmetrics LIMIT 10"}'
Configuration
Environment Variables
Configure the stack through environment variables:
| Variable | Description | Default |
|---|---|---|
VLLM_METRICS_URL | vLLM metrics endpoint URL | Required |
P_USERNAME | Parseable username | admin |
P_PASSWORD | Parseable password | admin |
P_ADDR | Parseable listen address | 0.0.0.0:8000 |
P_STAGING_DIR | Parseable staging directory | /staging |
PROXY_PORT | Metrics proxy port | 9090 |
SCRAPE_INTERVAL | Metrics collection interval | 2s |
Docker Compose Configuration
Complete compose.yml example:
version: "3.8"

services:
  parseable:
    image: parseable/parseable:edge
    ports:
      - "8080:8000"
    env_file:
      - parseable.env
    volumes:
      - parseable-data:/staging
    healthcheck:
      test: ["CMD", "curl", "-f", "http://localhost:8000/api/v1/health"]
      interval: 30s
      timeout: 10s
      retries: 3

  proxy:
    build: .
    ports:
      - "9090:9090"
    environment:
      - VLLM_METRICS_URL=${VLLM_METRICS_URL}
    depends_on:
      parseable:
        condition: service_healthy
    healthcheck:
      test: ["CMD", "curl", "-f", "http://localhost:9090/health"]
      interval: 10s
      timeout: 5s
      retries: 3

  fluentbit:
    image: fluent/fluent-bit:latest
    volumes:
      - ./fluent-bit.conf:/fluent-bit/etc/fluent-bit.conf
    depends_on:
      proxy:
        condition: service_healthy
    restart: unless-stopped

volumes:
  parseable-data:
Fluent Bit Advanced Configuration
For production deployments, consider these Fluent Bit optimizations:
[SERVICE]
    Flush                1
    Daemon               Off
    Log_Level            info
    Parsers_File         parsers.conf
    Plugins_File         plugins.conf
    HTTP_Server          On
    HTTP_Listen          0.0.0.0
    HTTP_Port            2020
    Storage.metrics      On
    Storage.path         /var/log/fluentbit-storage
    Storage.sync         normal
    Storage.checksum     On
    Storage.max_chunks_up 128
    Storage.backlog.mem_limit 5M

[INPUT]
    Name                 prometheus_scrape
    Tag                  vllm.metrics
    Host                 proxy
    Port                 9090
    Metrics_Path         /metrics
    Scrape_Interval      2s
    Buffer_Max_Size      2MB

[FILTER]
    Name                 record_modifier
    Match                vllm.metrics
    Record               cluster ${CLUSTER_NAME}
    Record               region ${AWS_REGION}
    Record               model ${MODEL_NAME}

[OUTPUT]
    Name                 opentelemetry
    Match                vllm.metrics
    Host                 parseable
    Port                 8000
    Metrics_uri          /v1/metrics
    Retry_Limit          5
    Compress             gzip
Monitoring
Key Metrics to Track
Monitor these critical vLLM metrics for optimal performance:
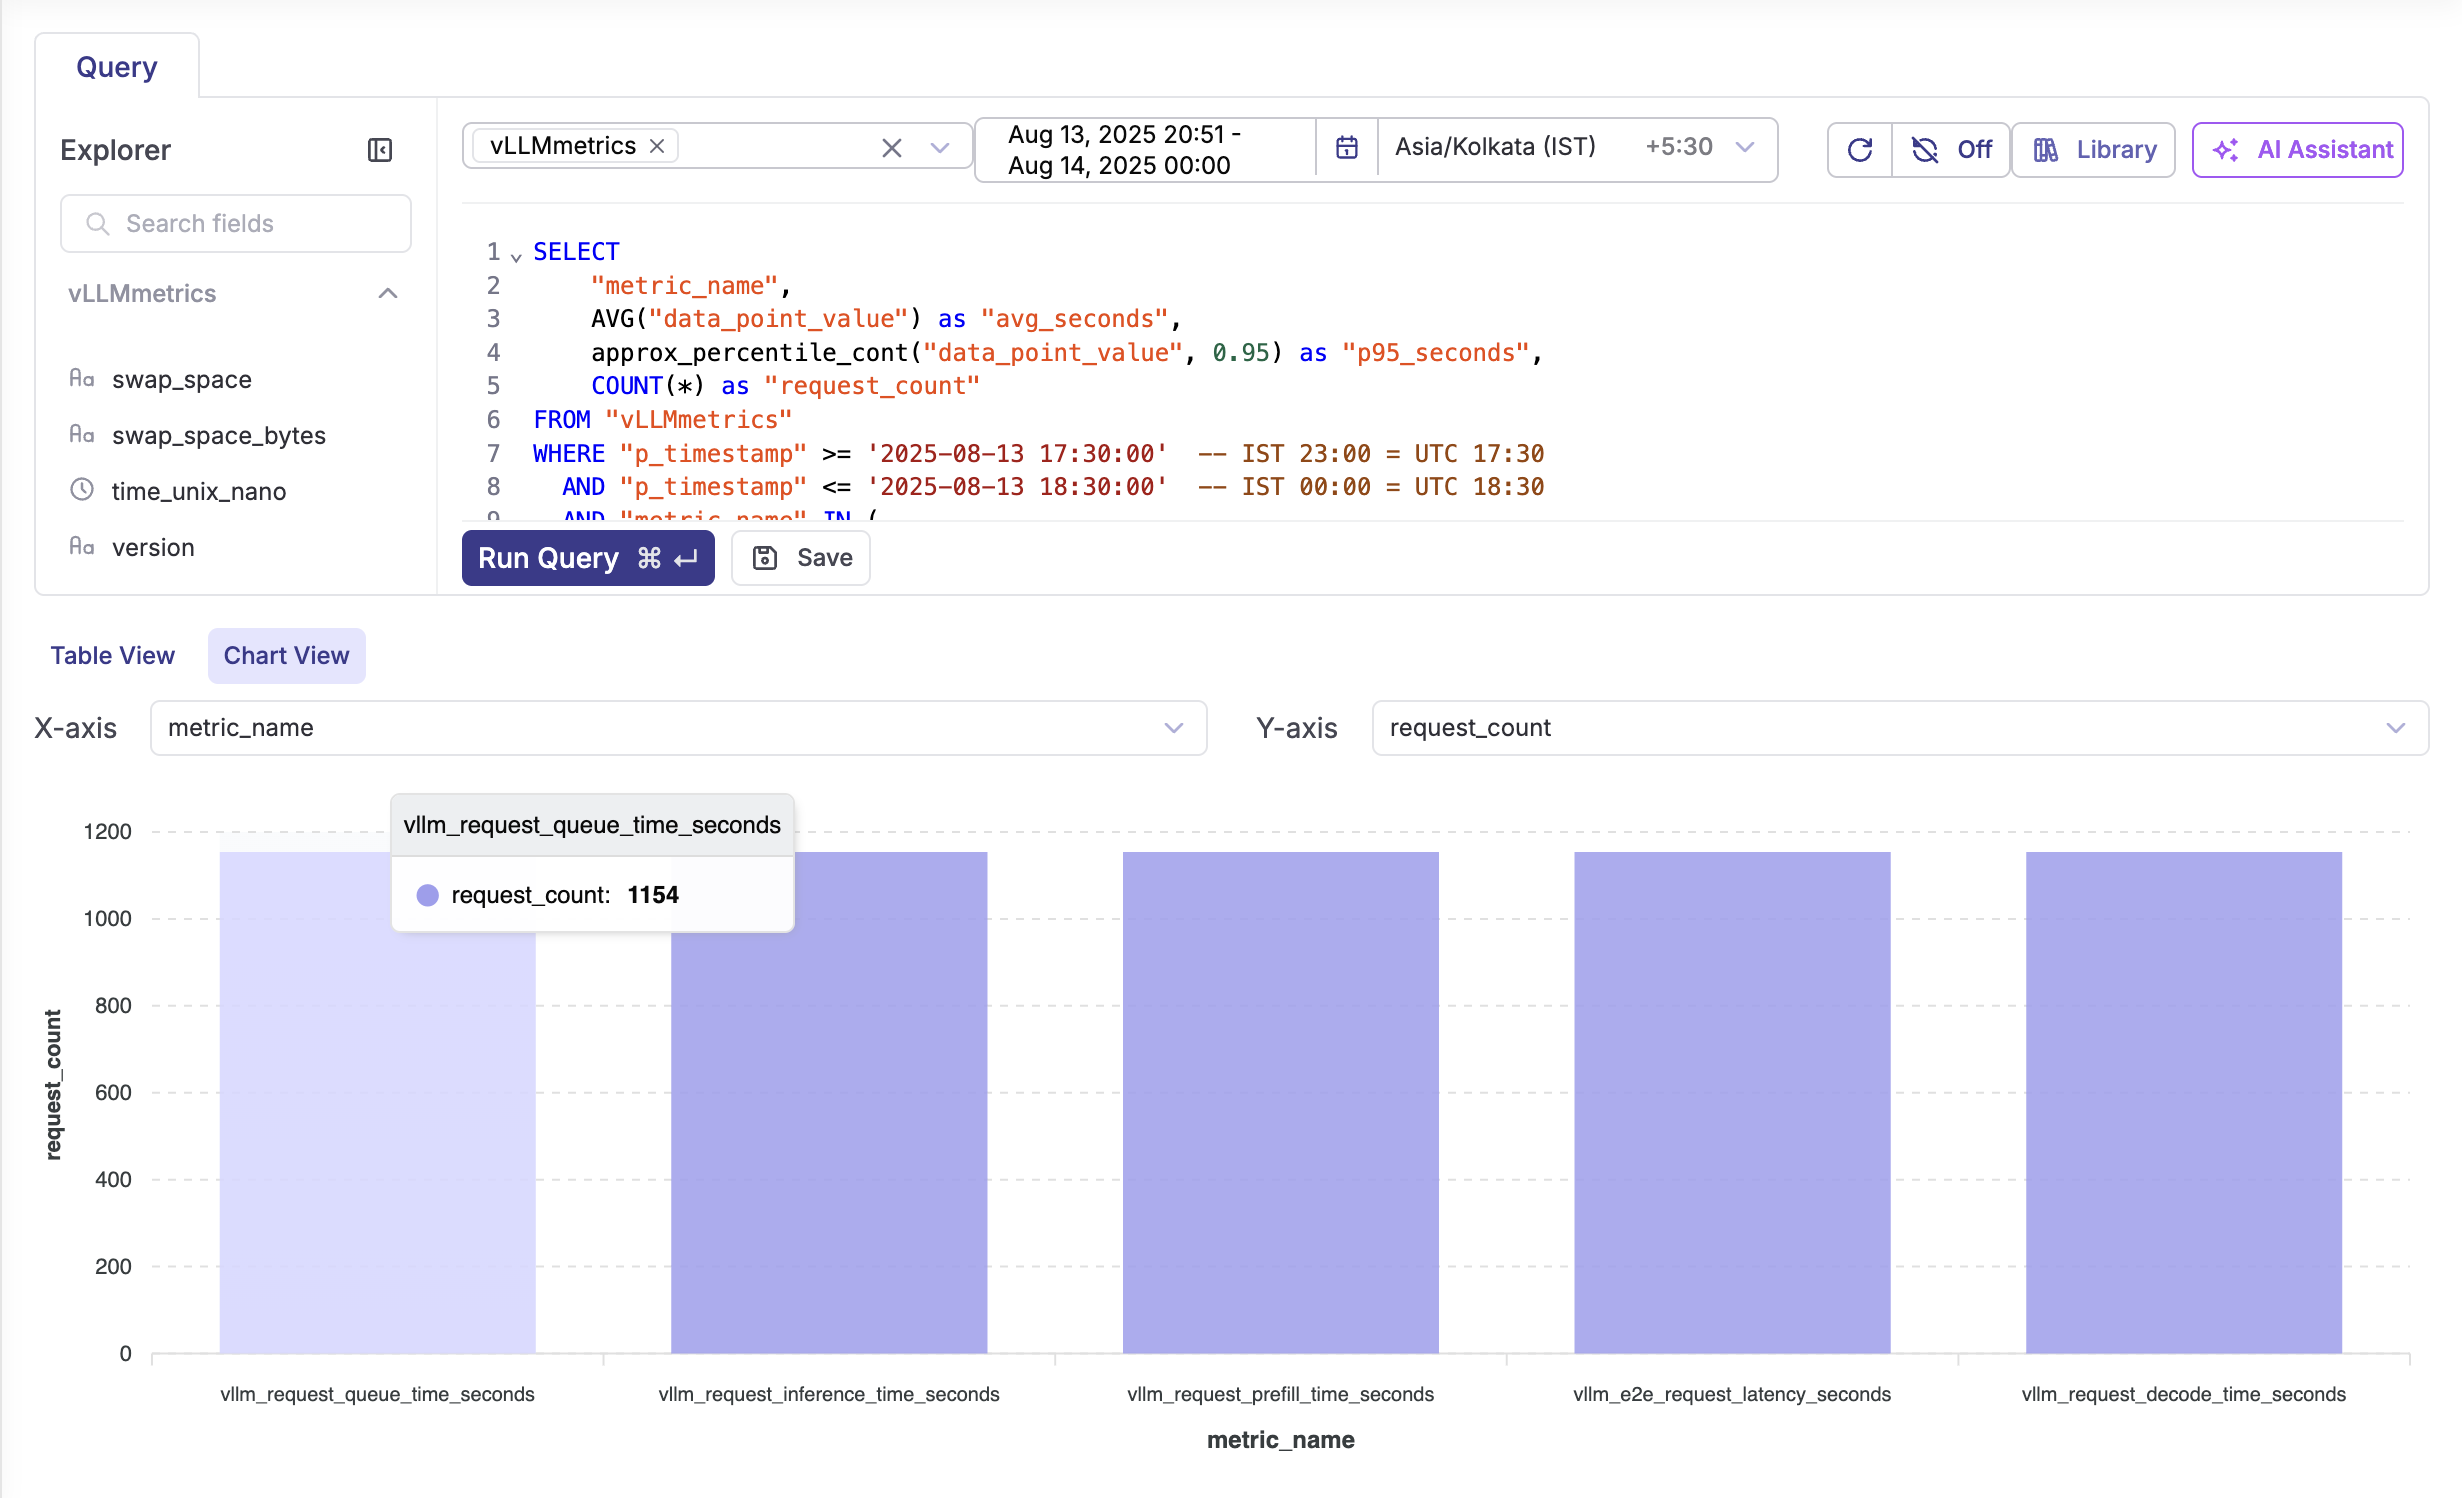
Request Metrics
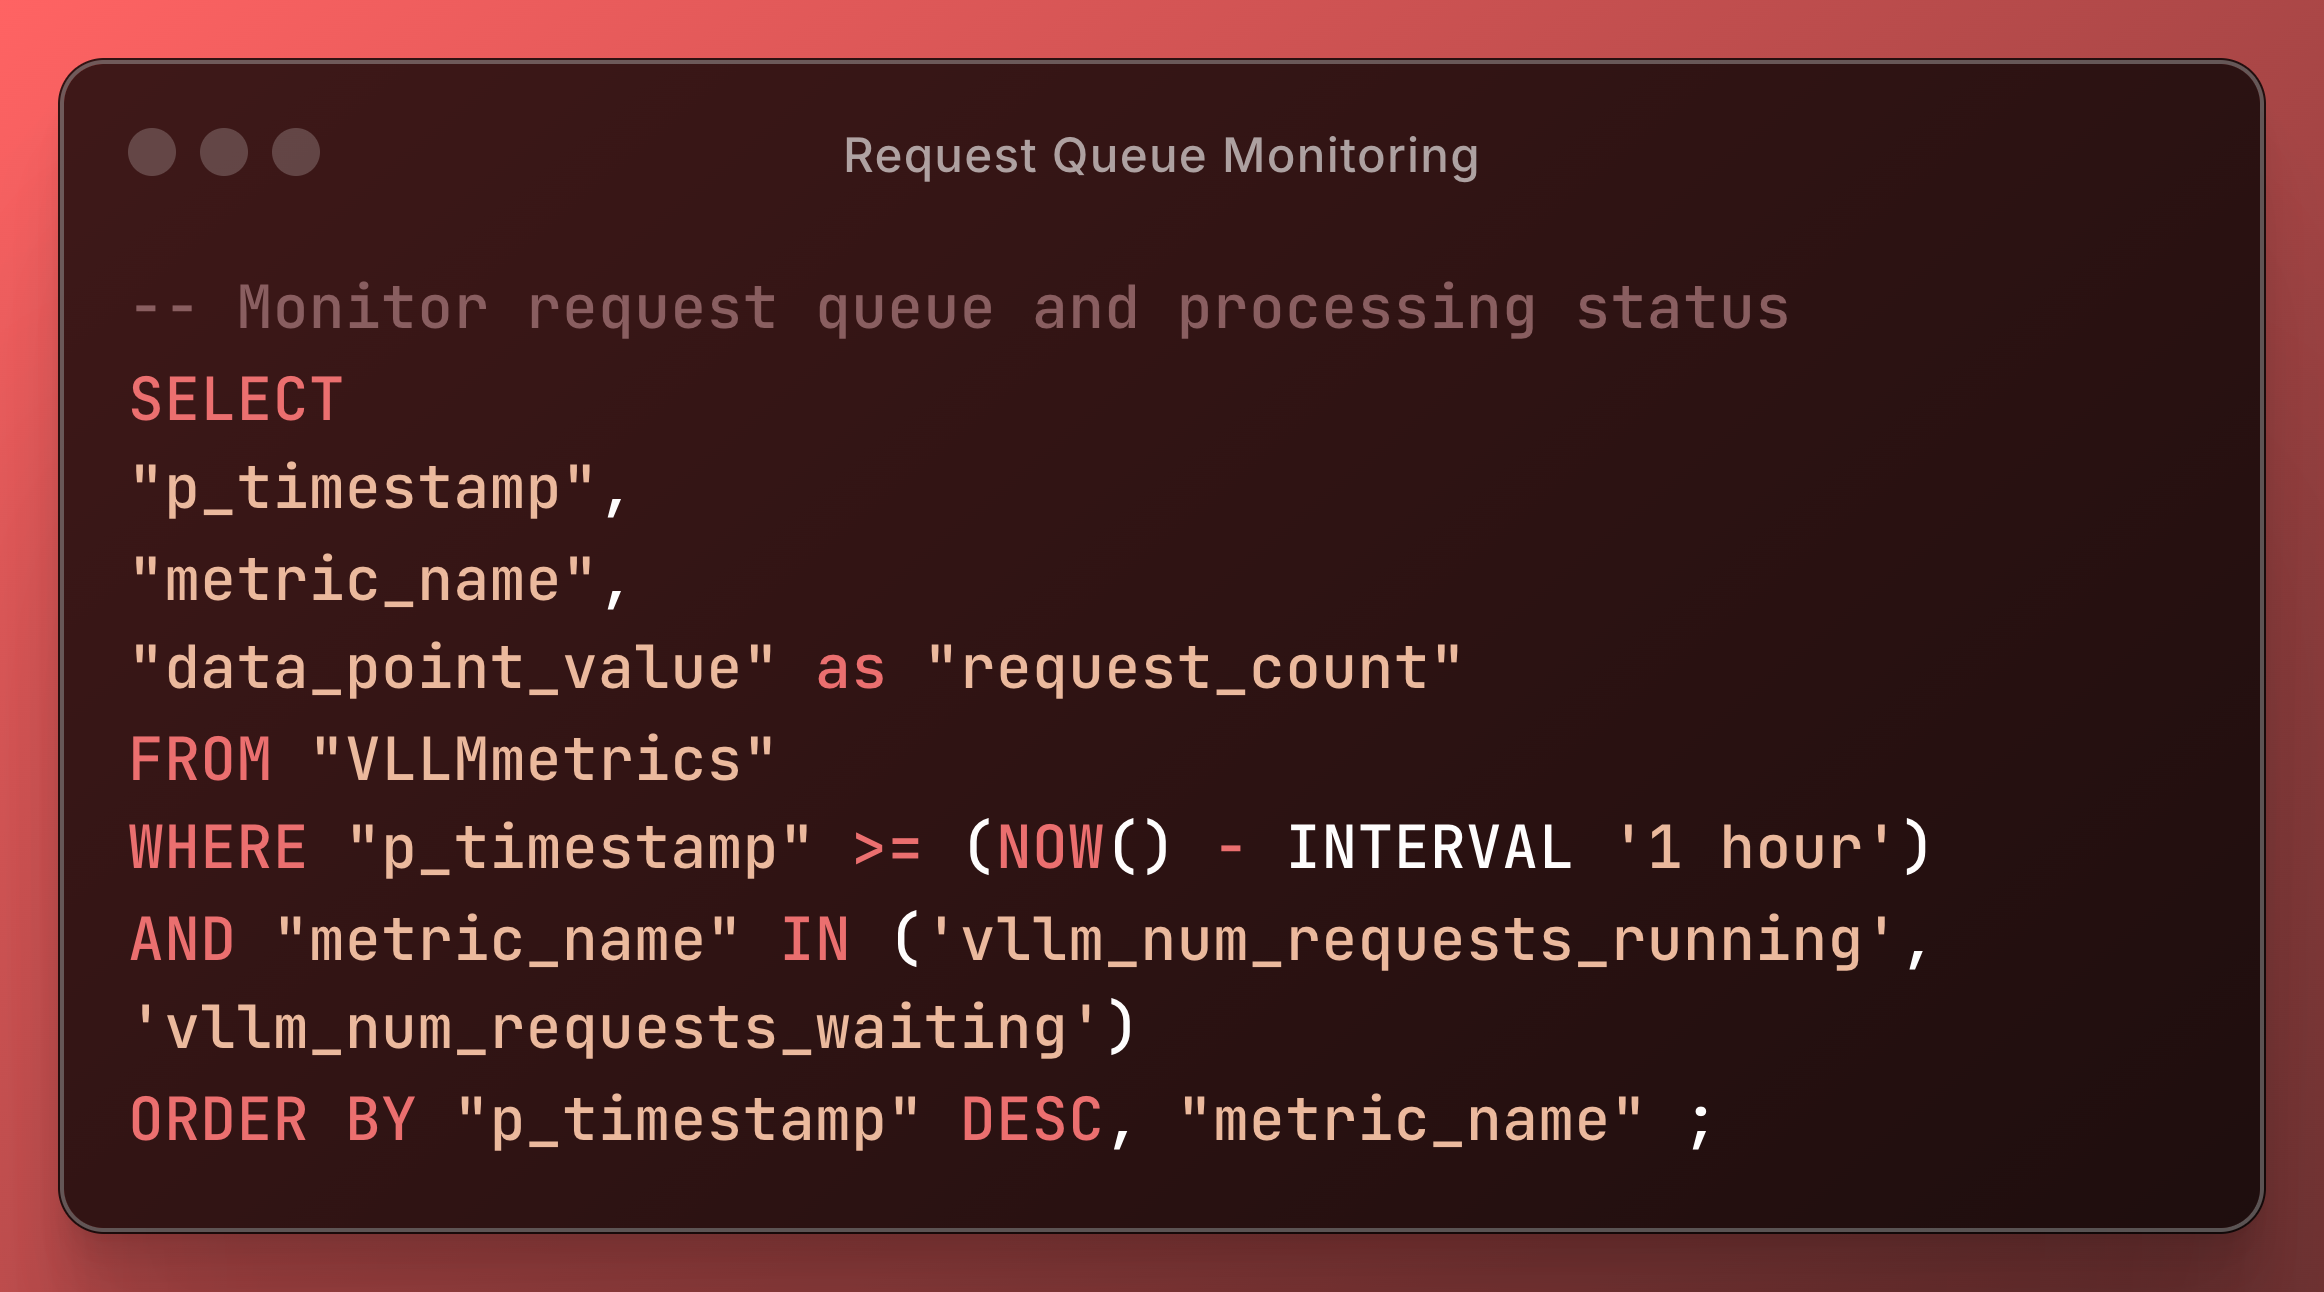
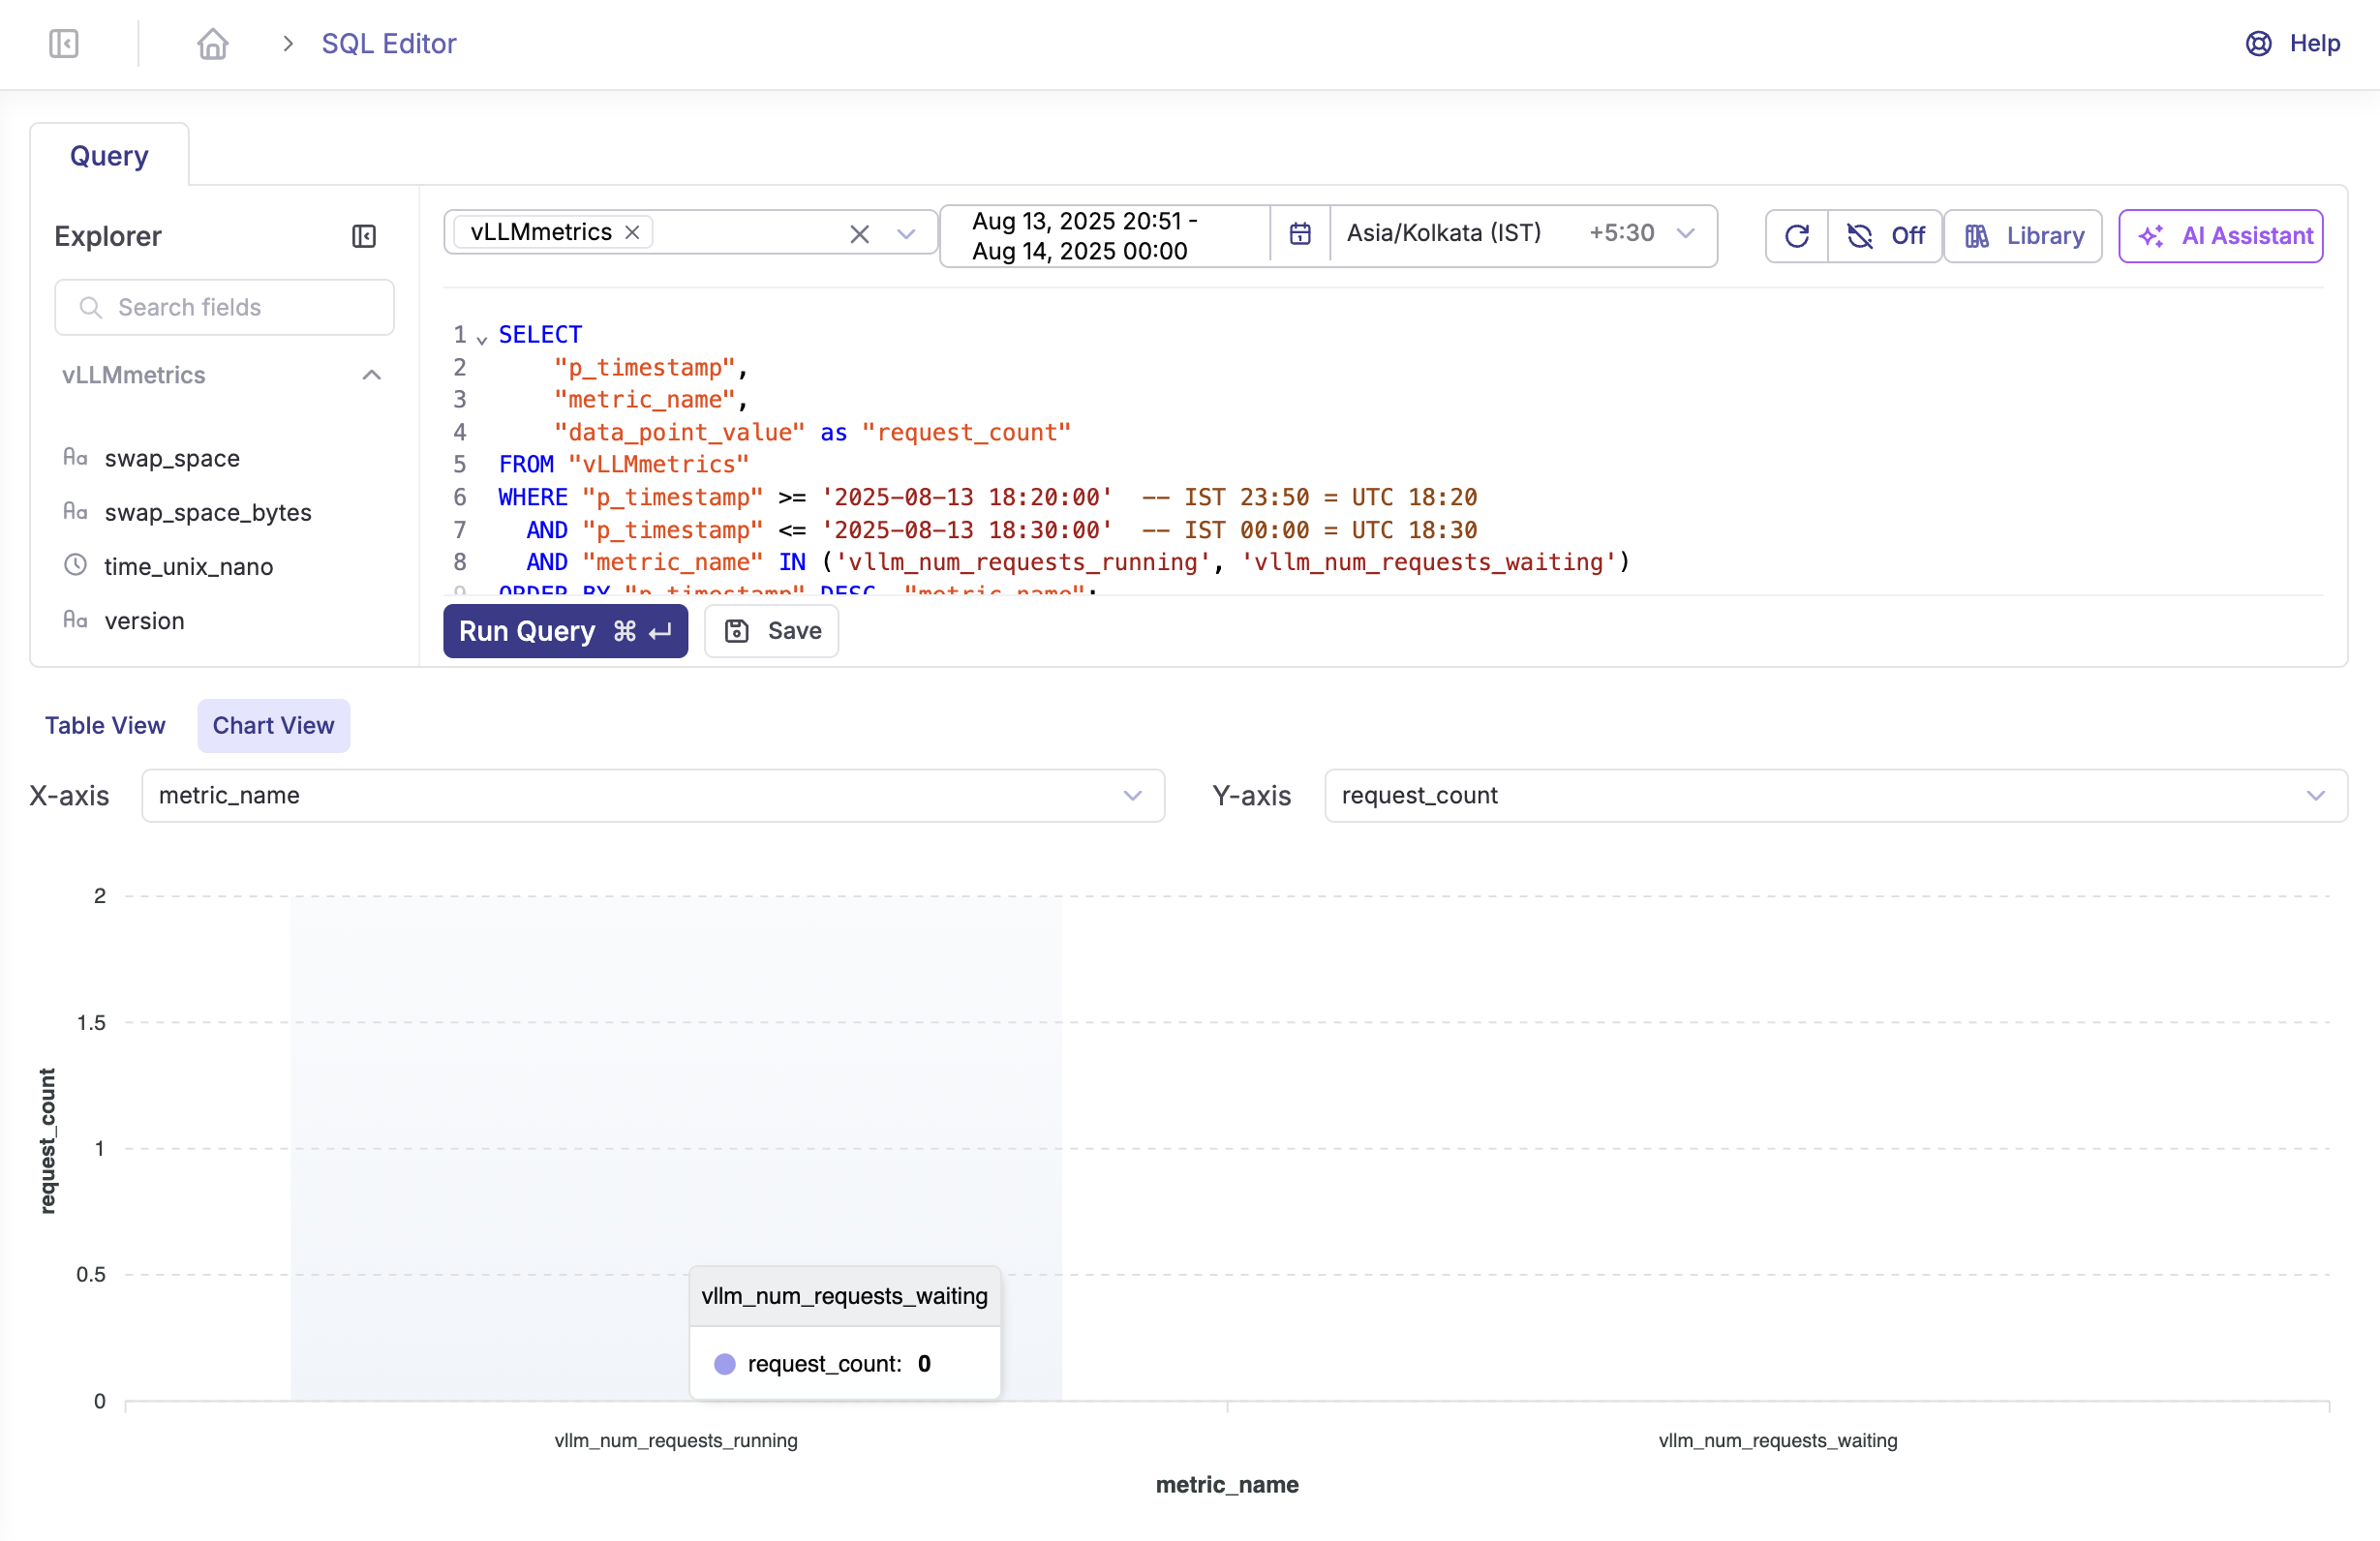
Request Queue Monitoring
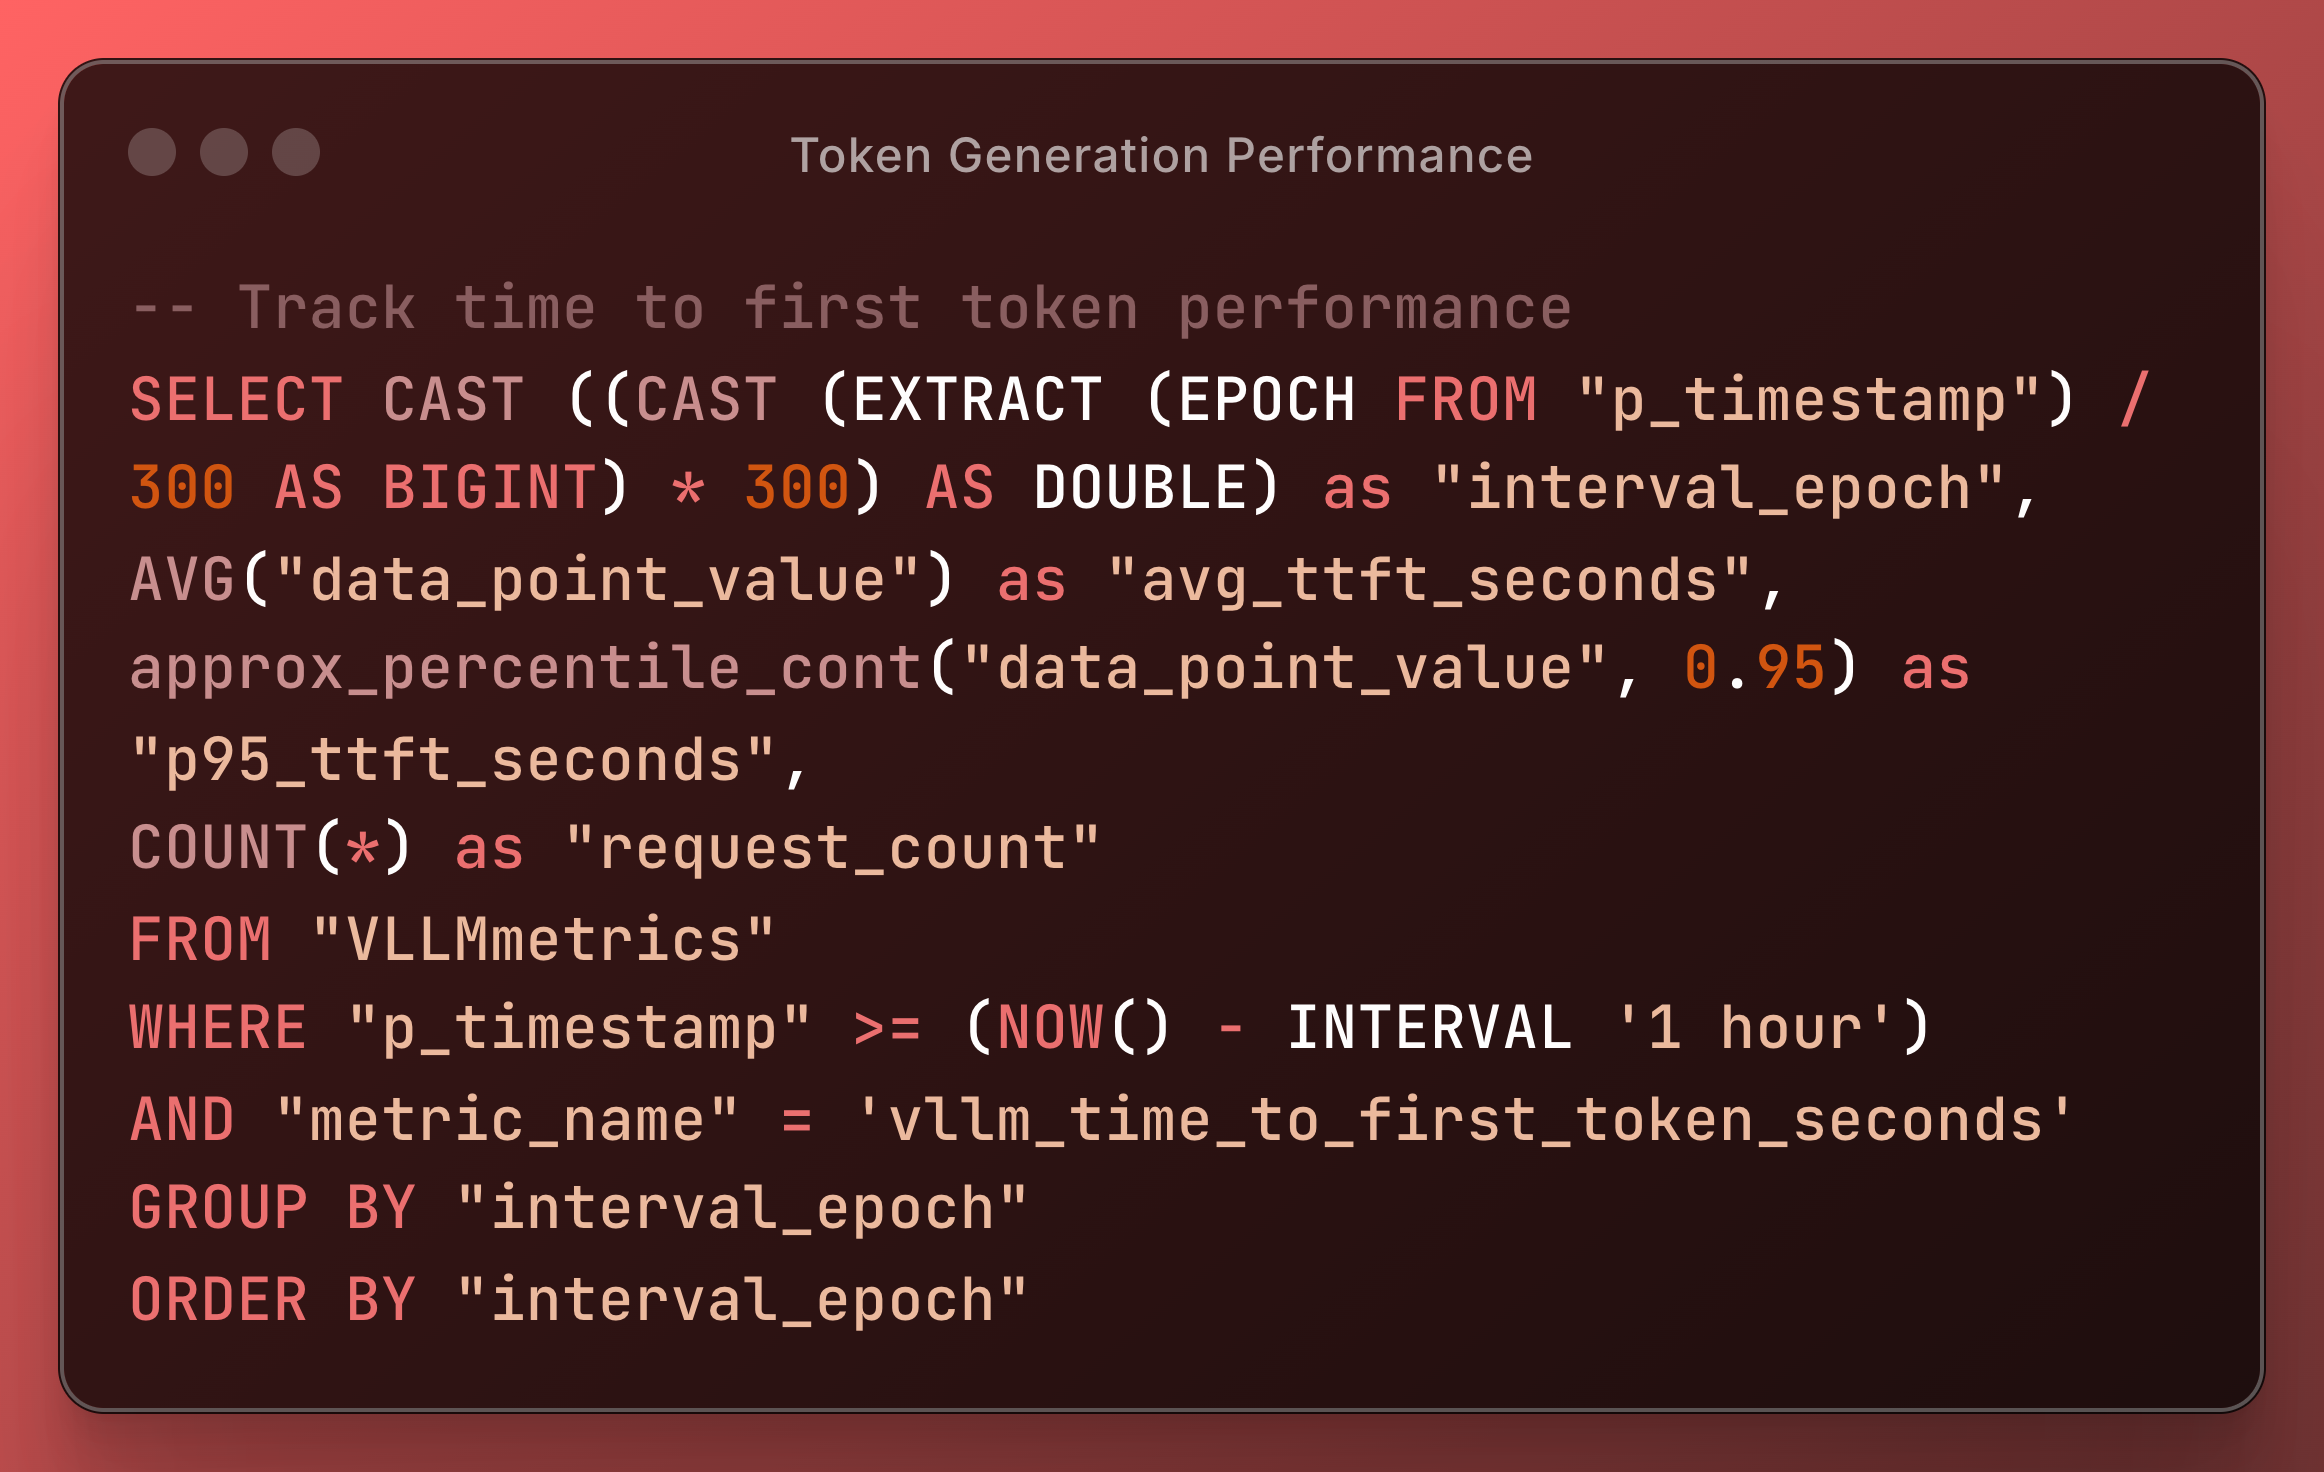
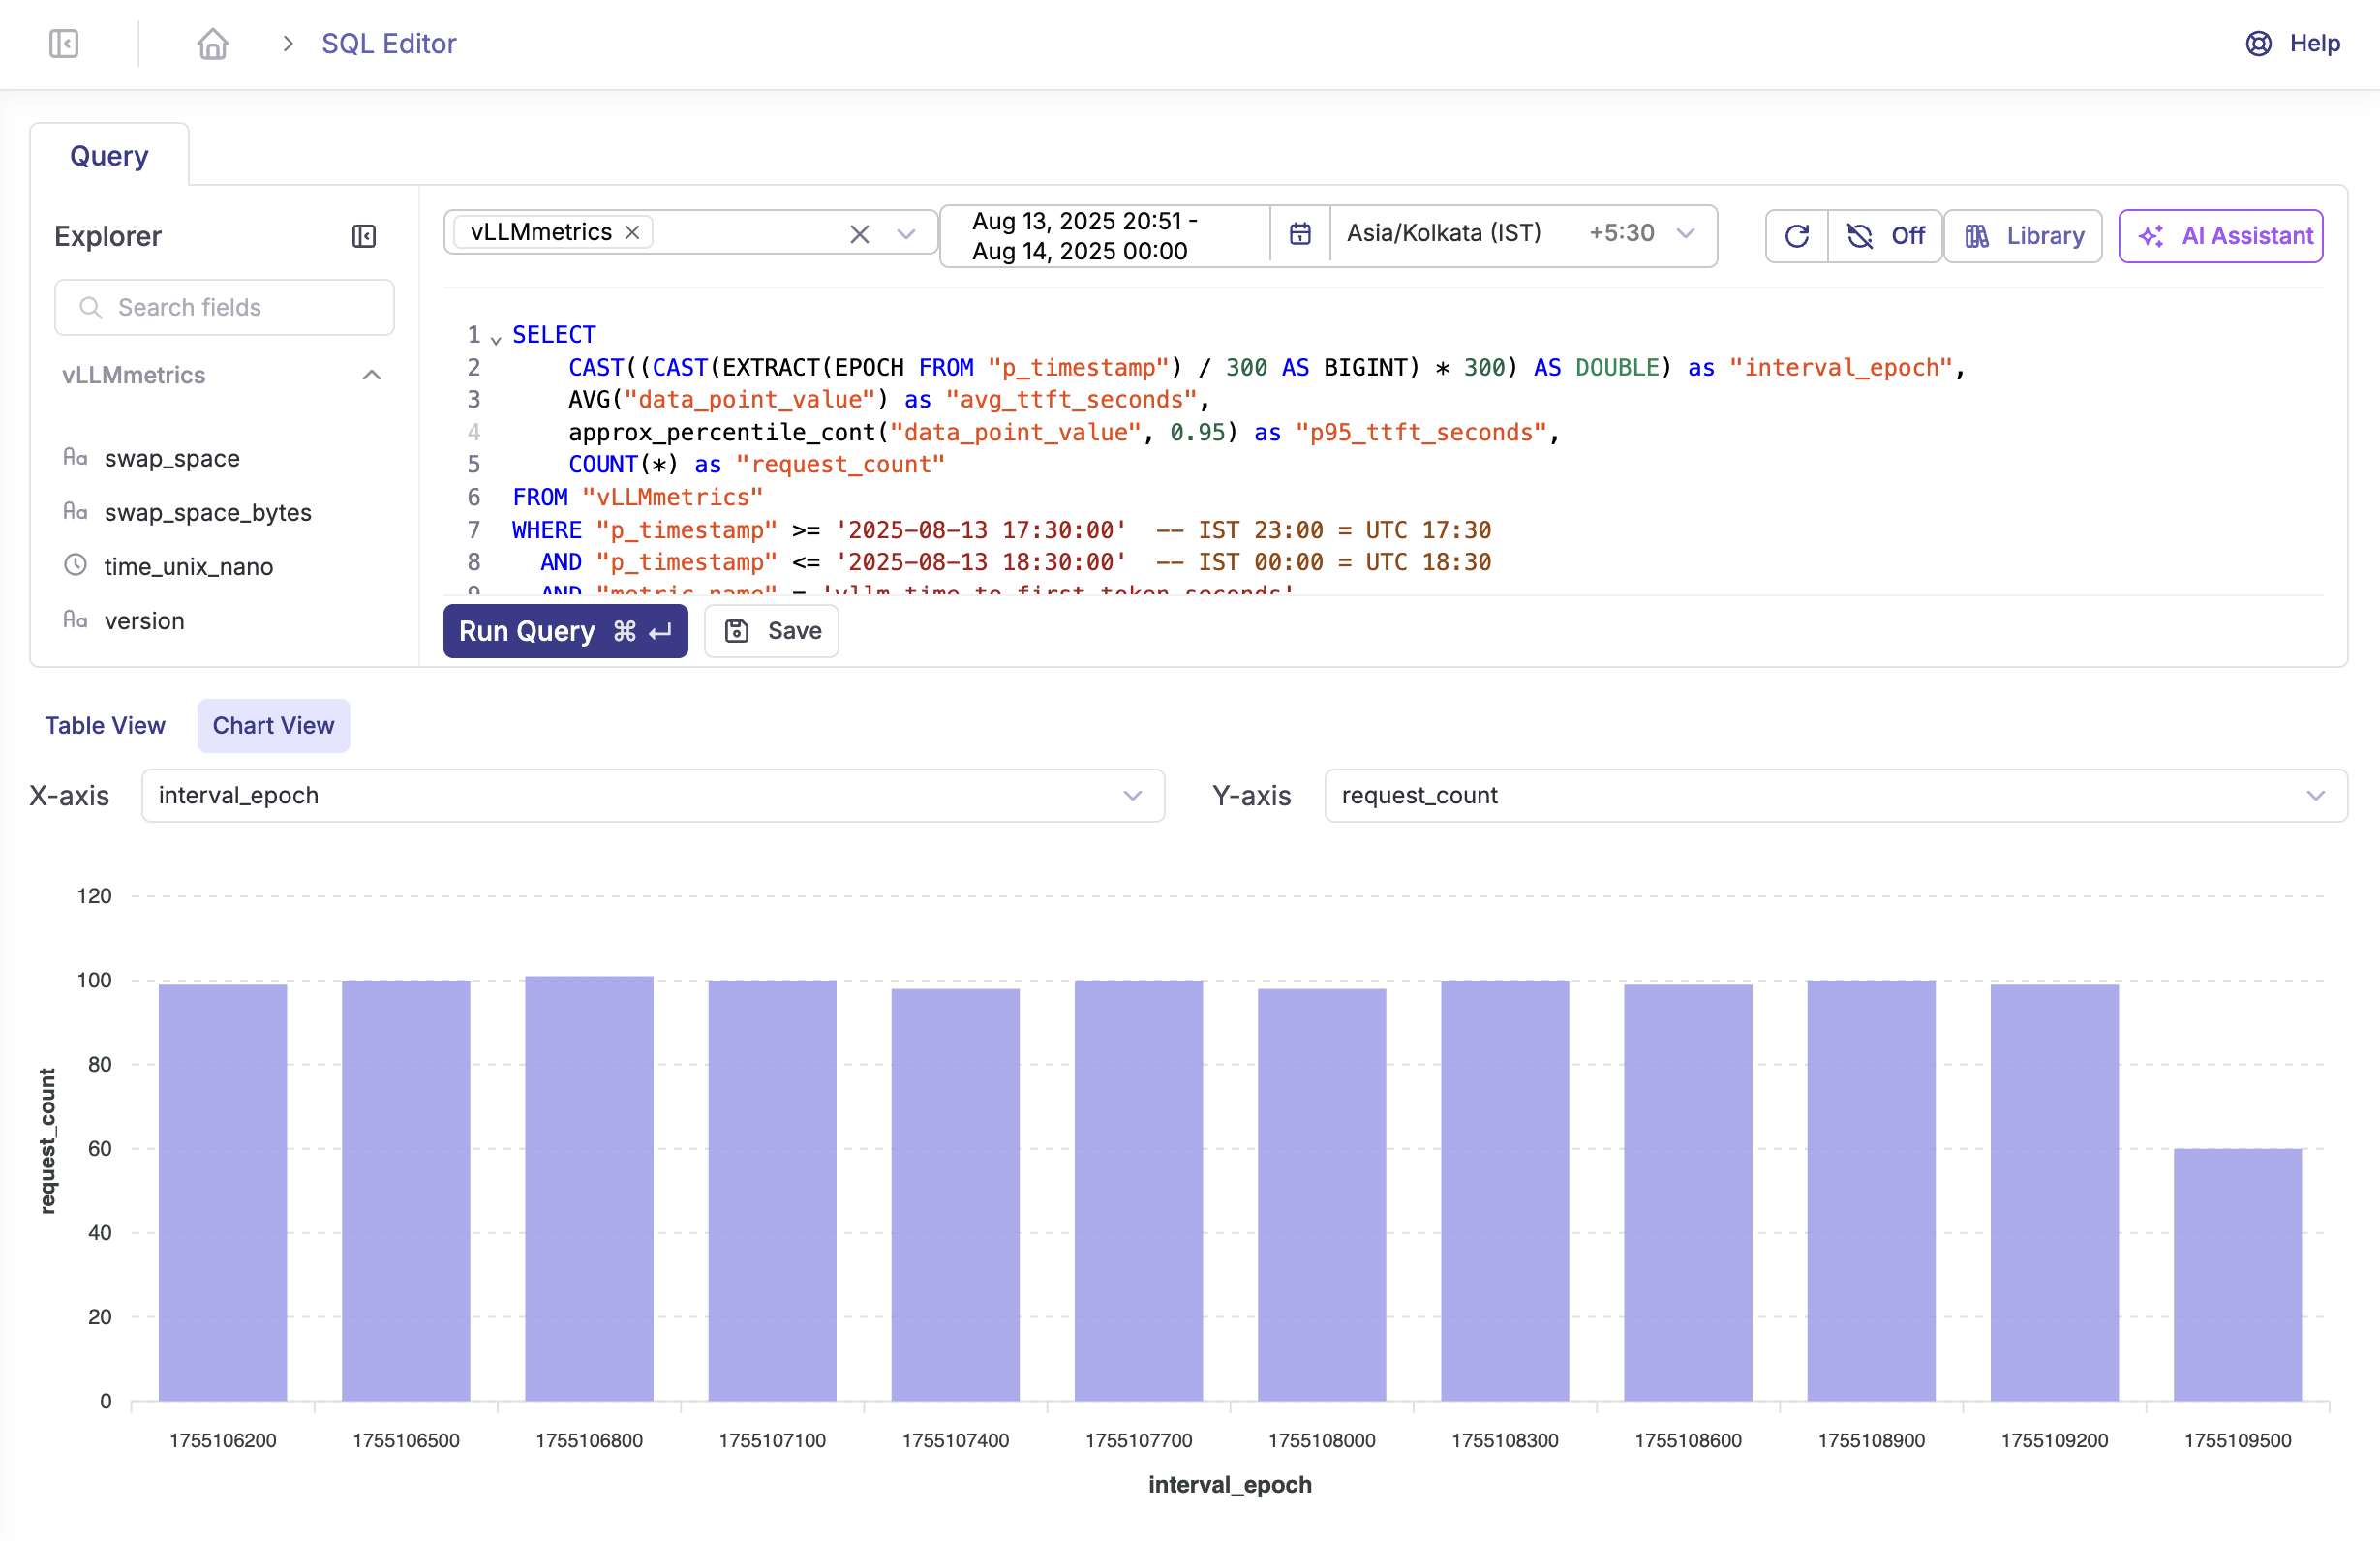
Token Generation Performance
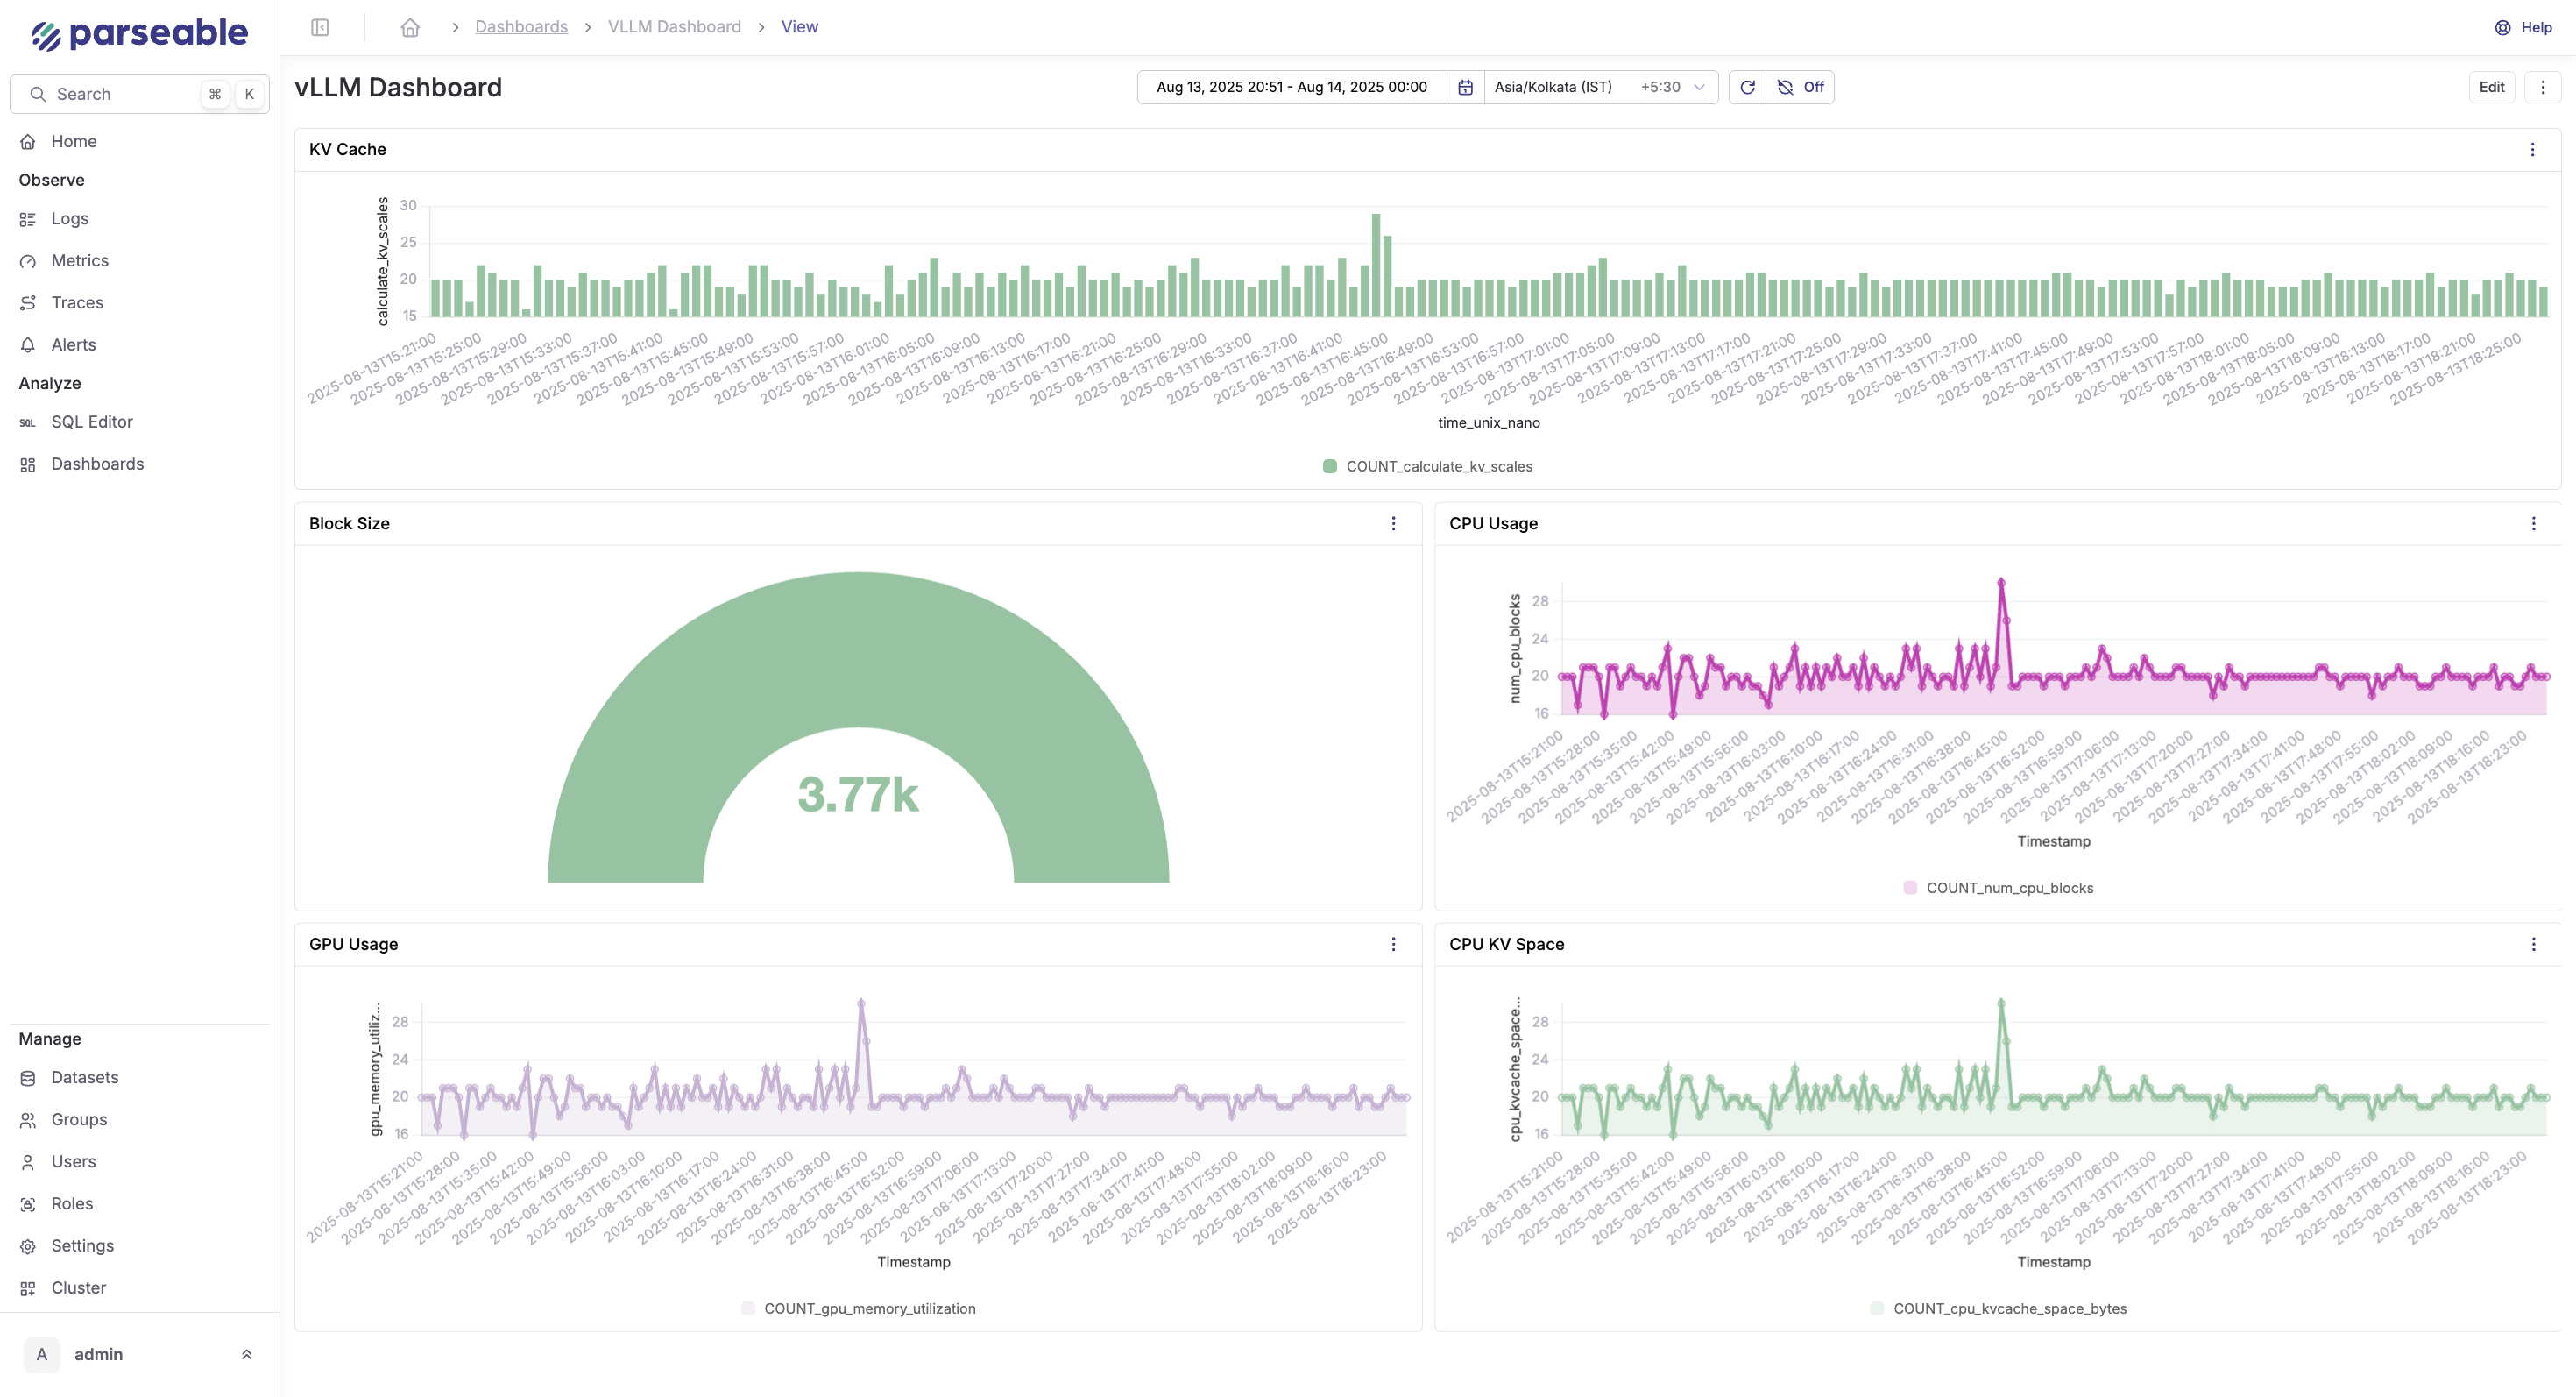
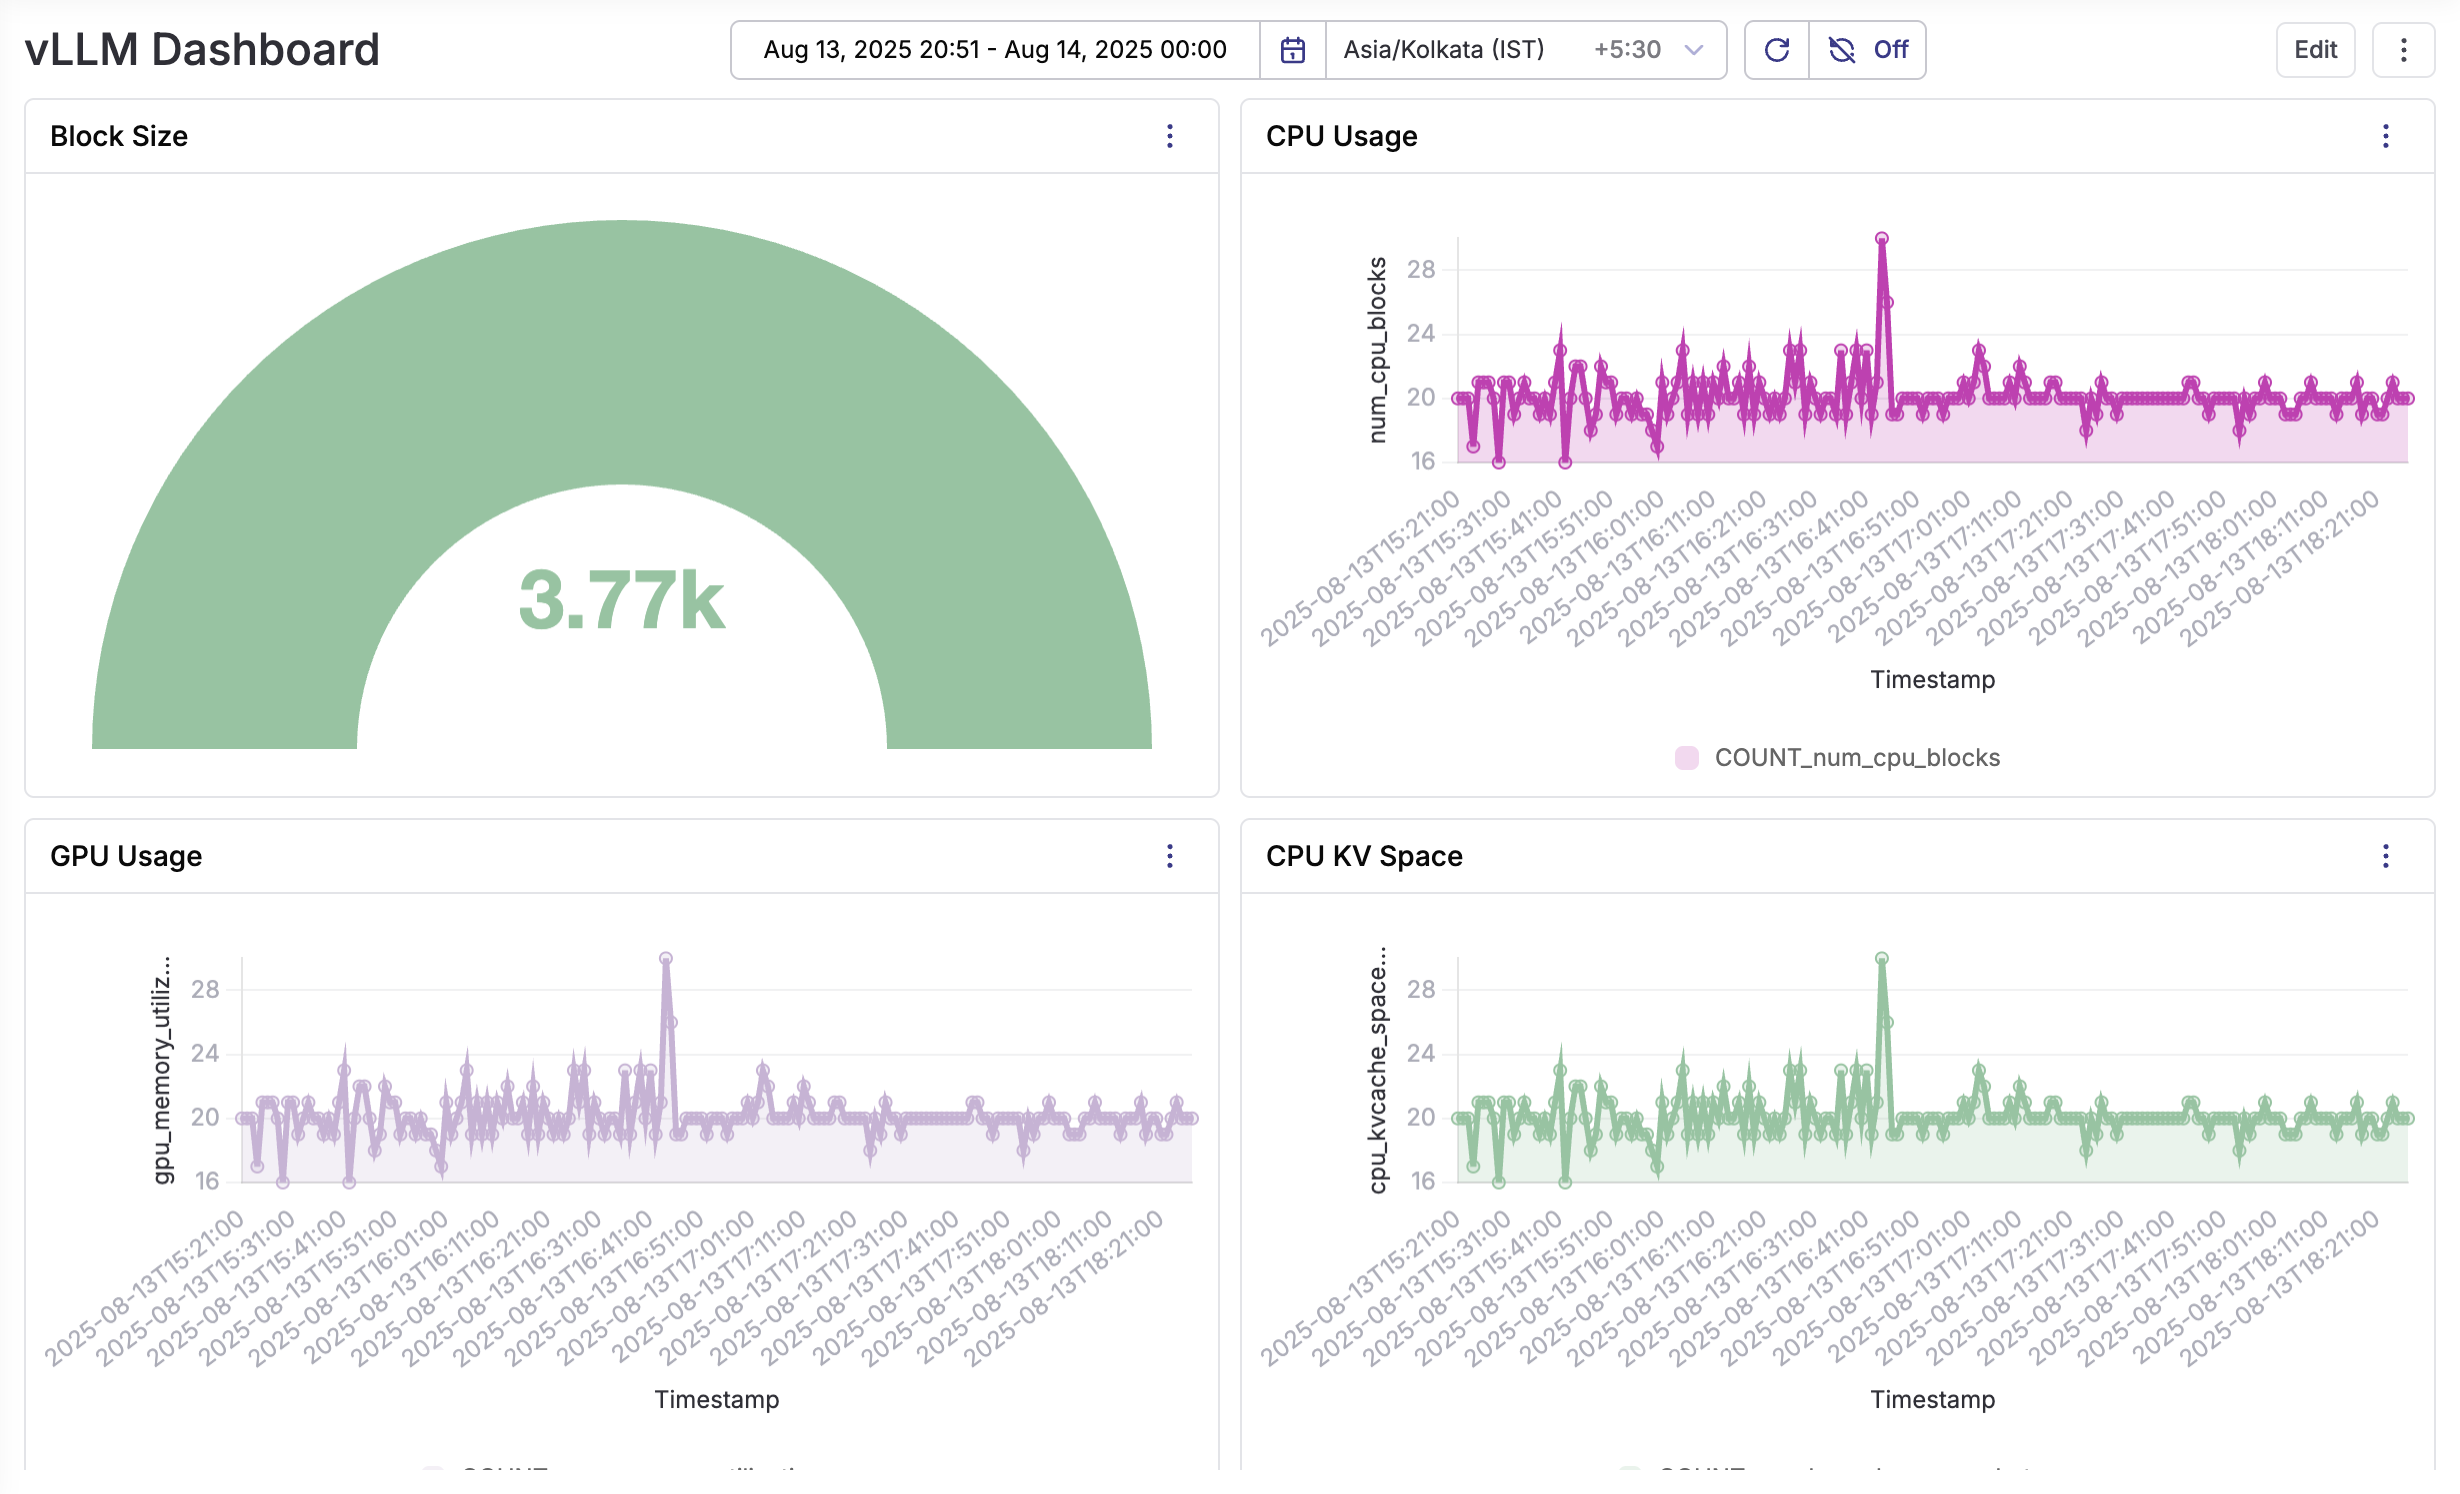
Creating Dashboards
Use Parseable's visualization capabilities to create comprehensive dashboards:
-
Real-time Performance Dashboard
- Request latency histogram
- Token generation rate time series
- Active request count gauge
- Error rate percentage
-
Resource Utilization Dashboard
- GPU memory usage over time
- GPU utilization percentage
- CPU and system memory metrics
- Model loading times
- Business Metrics Dashboard
- Total requests served
- Token usage by model
- Cost per request calculations
- User request distribution
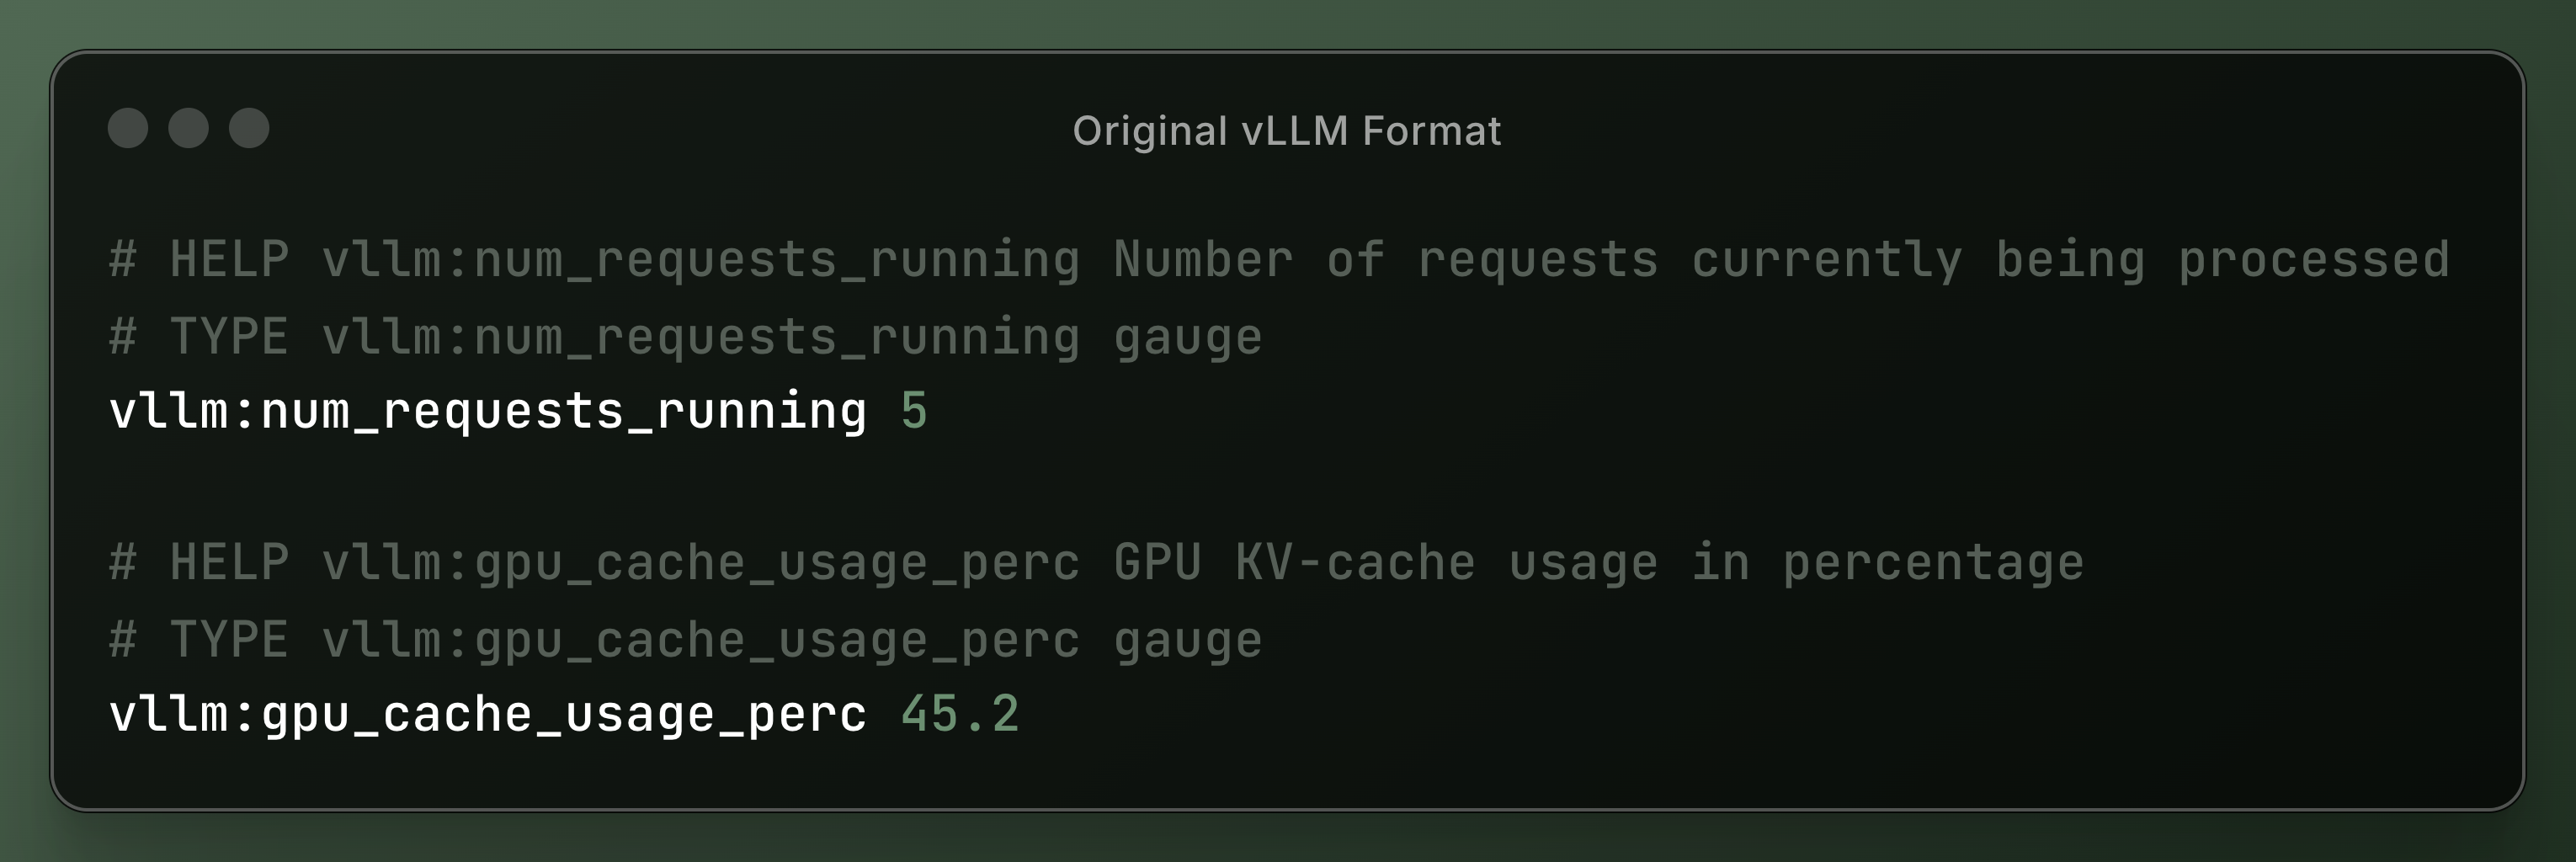
Metrics Format
The proxy transforms vLLM metrics to ensure compatibility:
Original vLLM Format
Transformed Prometheus-Compatible Format
![]()
Complete Metrics Reference
Key vLLM metrics available for monitoring:
| Metric Name | Type | Description |
|---|---|---|
vllm_num_requests_running | Gauge | Active inference requests |
vllm_num_requests_waiting | Gauge | Queued requests |
vllm_gpu_cache_usage_perc | Gauge | GPU KV-cache utilization |
vllm_num_preemptions_total | Counter | Request preemptions |
vllm_prompt_tokens_total | Counter | Total prompt tokens processed |
vllm_generation_tokens_total | Counter | Total tokens generated |
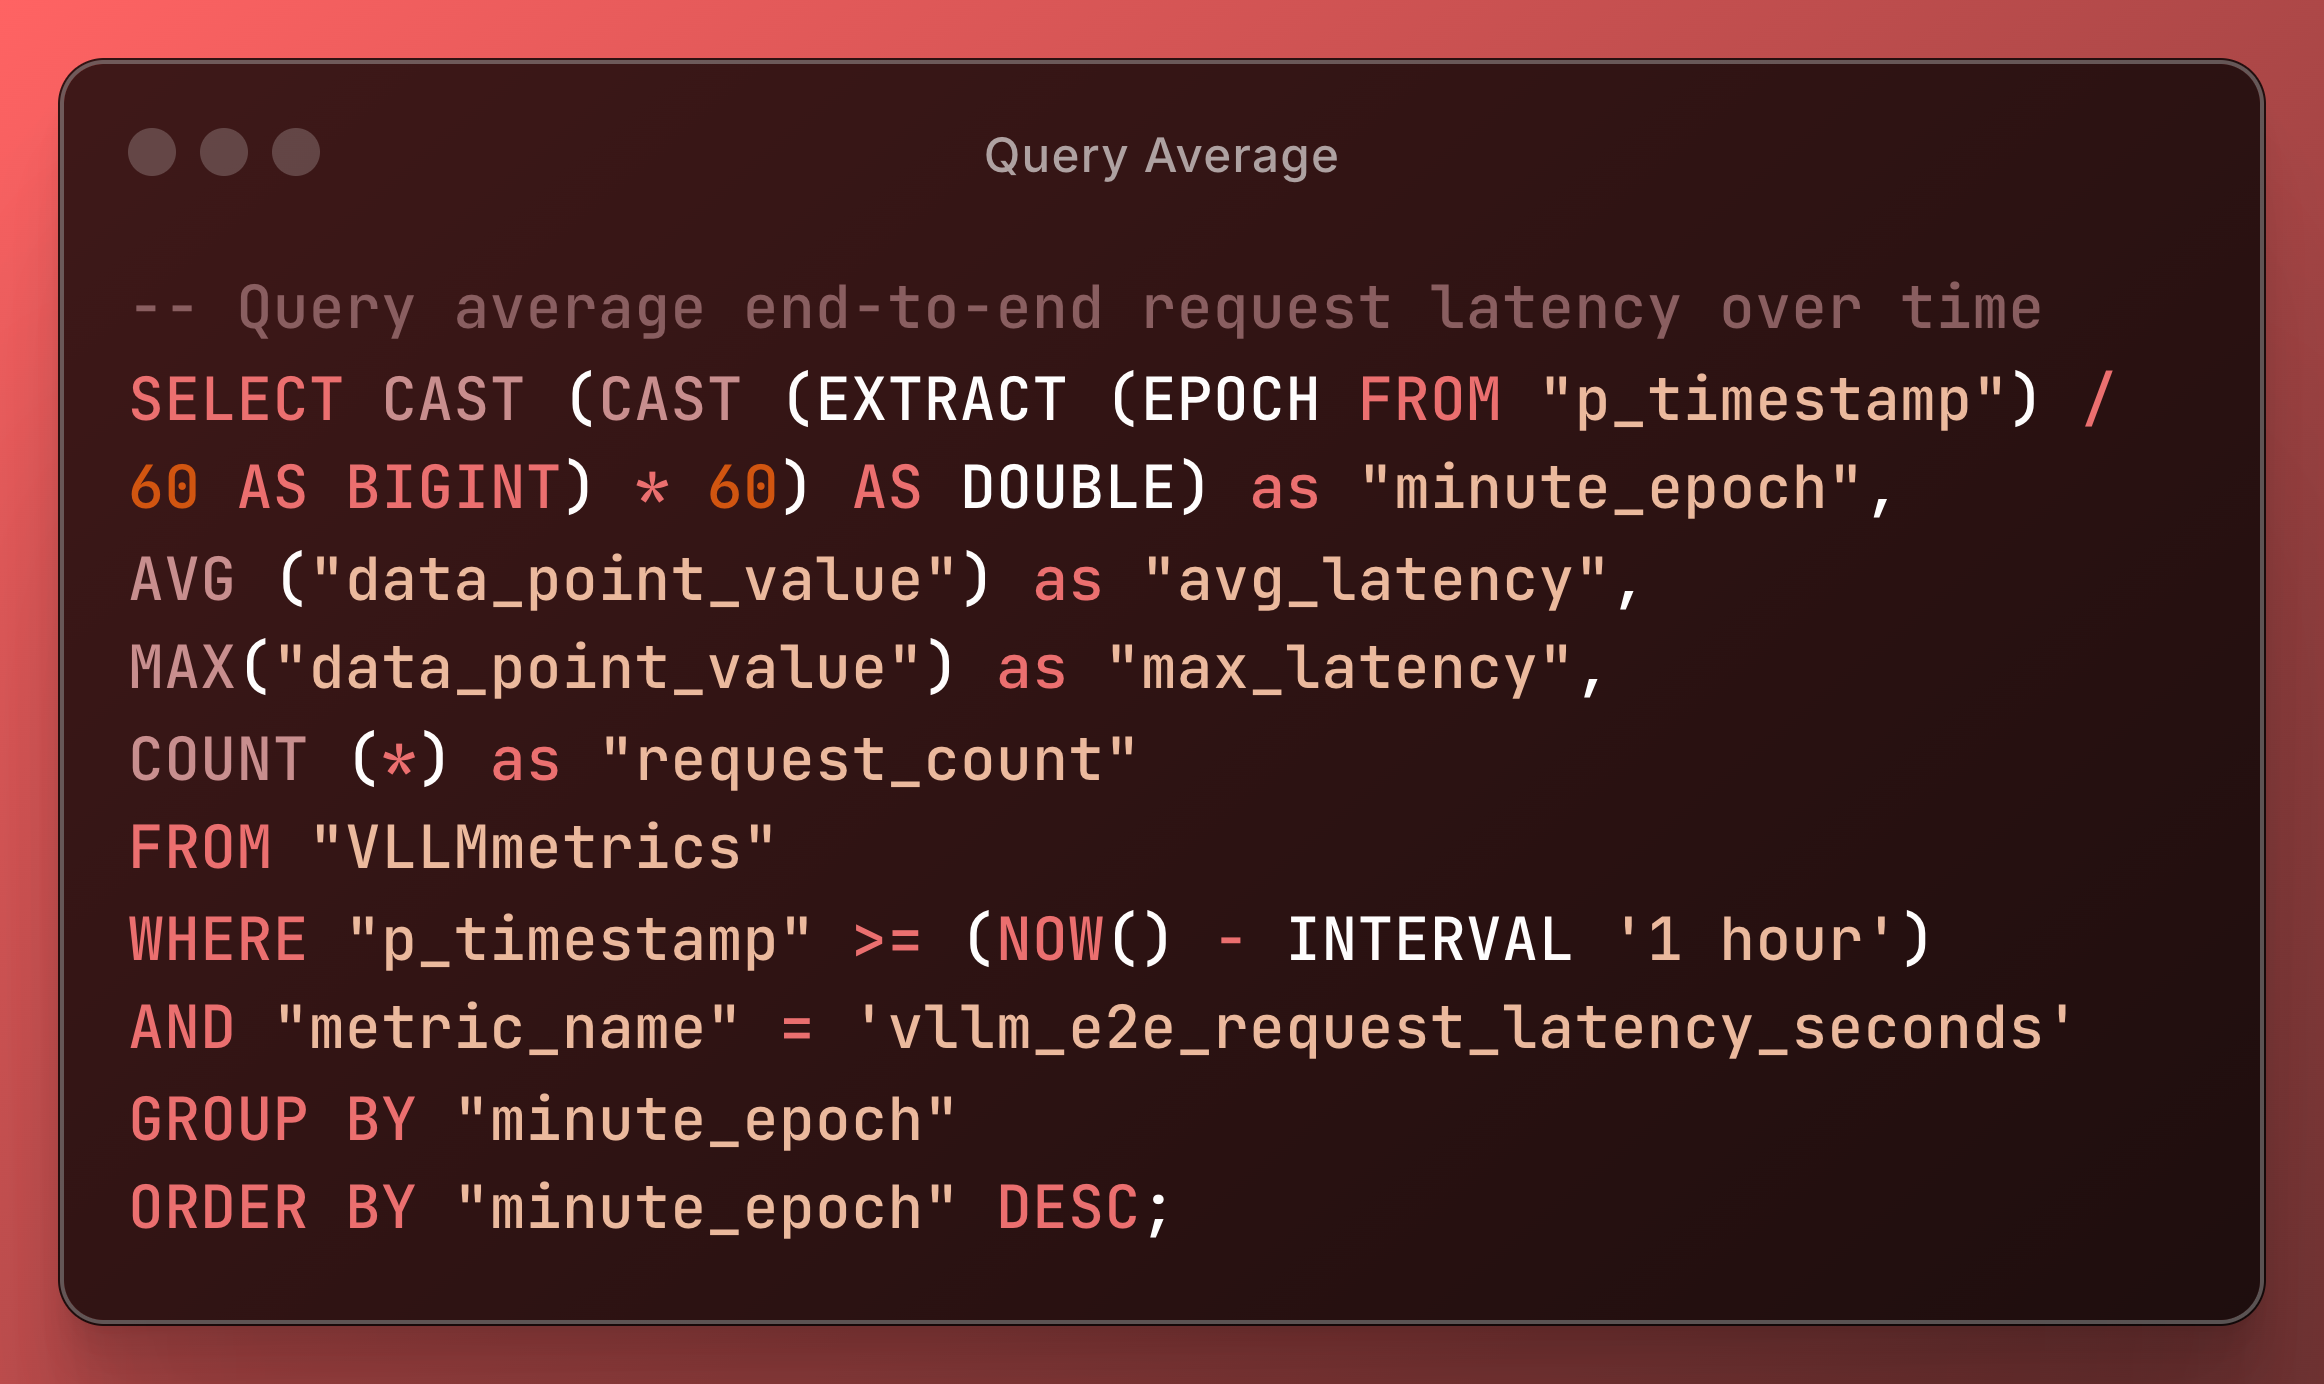
vllm_request_latency_seconds | Histogram | End-to-end request latency |
vllm_model_forward_time_seconds | Histogram | Model forward pass duration |
vllm_time_to_first_token_seconds | Histogram | TTFT latency |
vllm_time_per_output_token_seconds | Histogram | Inter-token latency |
Real-World Use Cases
Use Case 1: Multi-Model Serving Optimization
Scenario: Running multiple models (GPT-OSS-20B, Llama-70B, CodeLlama) on shared GPU infrastructure.
Monitoring Strategy:
Optimization Actions:
- Adjust model-specific batch sizes based on latency targets
- Implement dynamic model loading based on request patterns
- Scale GPU resources per model based on utilization metrics
Use Case 2: Cost-Optimized Inference
Scenario: Minimizing GPU costs while maintaining SLA targets.
Monitoring Strategy:
Optimization Actions:
- Implement request batching during low-utilization periods
- Use spot instances for batch processing workloads
- Autoscale based on queue depth and utilization thresholds
Use Case 3: Real-Time Chat Application
Scenario: Supporting a customer service chatbot with strict latency requirements.
Monitoring Strategy:
Optimization Actions:
- Prioritize interactive requests over batch jobs
- Implement streaming token generation
- Cache common prompt prefixes
Troubleshooting
Common Issues and Solutions
1. Connection Refused to vLLM
Symptoms: Proxy returns 502 errors, no metrics collected
Diagnosis:
# Test vLLM endpoint directly
curl -v https://your-vllm-endpoint/metrics

# Check proxy logs
podman compose logs proxy | grep ERROR

# Verify network connectivity
podman exec proxy ping your-vllm-hostSolutions:
- Verify
VLLM_METRICS_URLis correct - Check firewall rules and security groups
- Ensure vLLM is configured with
--enable-metrics
2. Parseable Not Receiving Data
Symptoms: No data visible in Parseable UI
Diagnosis:
# Check Fluent Bit logs
podman compose logs -f fluentbit

# Verify proxy health
curl http://localhost:9090/health

# Test Parseable API
curl -X GET http://localhost:8080/api/v1/health \
-H "Authorization: Basic YWRtaW46YWRtaW4="Solutions:
- Verify Fluent Bit configuration syntax
- Check Parseable authentication credentials
- Ensure proper network connectivity between services
3. High Memory Usage
Symptoms: Container OOM kills, system slowdown
Diagnosis:
# Monitor container resources
podman stats

# Check Parseable storage
podman exec parseable df -h /staging

# Review Fluent Bit buffer usage
podman exec fluentbit ls -la /var/log/fluentbit-storageSolutions:
- Implement retention policies in Parseable
- Adjust Fluent Bit buffer limits
- Add resource limits to containers
4. Metrics Lag or Missing Data
Symptoms: Metrics appear delayed or have gaps
Diagnosis:
-- Check metric ingestion lag
SELECT
    MAX("p_timestamp") as "latest_metric",
    NOW() - MAX("p_timestamp") as "lag"
FROM "vLLMmetrics";

-- Check data availability by metric type for your dataset
SELECT
    "metric_name",
    COUNT(*) as "record_count",
    MIN("p_timestamp") as "earliest_record",
    MAX("p_timestamp") as "latest_record"
FROM "vLLMmetrics"
WHERE "p_timestamp" >= (NOW() - INTERVAL '1 hour')
  AND "metric_name" IN (
    'vllm_e2e_request_latency_seconds',
    'vllm_time_to_first_token_seconds',
    'vllm_num_requests_running',
    'vllm_num_requests_waiting'
)
GROUP BY "metric_name"
ORDER BY "metric_name";Solutions:
- Reduce scrape interval if metrics change rapidly
- Increase Fluent Bit retry limits
- Check for network packet loss
Debug Mode
Enable debug logging for detailed troubleshooting:
# In compose.yml
services:
  proxy:
    environment:
      - FLASK_ENV=development
      - LOG_LEVEL=DEBUG

  fluentbit:
    command:
      [
        "/fluent-bit/bin/fluent-bit",
        "-c",
        "/fluent-bit/etc/fluent-bit.conf",
        "-v",
        "debug",
      ]
Conclusion
Monitoring vLLM inference with Parseable provides the observability foundation necessary for operating production AI workloads. This solution offers:
- Complete visibility into model serving performance
- Actionable insights for optimization and troubleshooting
- Scalable architecture that grows with your deployment
- Cost-effective monitoring using open-source components
As AI inference becomes central to modern applications, having robust monitoring is no longer optional—it's essential for delivering reliable, performant, and cost-effective AI services.

