

Introduction
In Part 1 of this tutorial, we set up a complete Kafka monitoring stack with Kafka Exporter and Fluent Bit, configured metrics collection to Parseable, and explored the Explore page for quick filtering and grouping of Kafka metrics. We learned how to monitor partition health, and spot replication issues using simple filters and group-by operations.
Now in Part 2, we'll take our Kafka monitoring to the next level with advanced capabilities that transform raw metrics into actionable insights using SQL editor, dashboards and alerts.
What You'll Learn in Part 2
Building on the foundation from Part 1, this tutorial covers:
- SQL Analysis: Write queries with AI to uncover trends, correlations, and anomalies in your Kafka metrics.
- Dashboards: Build comprehensive dashboards with multiple chart types for at-a-glance monitoring.
- Alerting: Set up threshold, anomaly detection, and forecast alerts to catch issues before they impact production.
- Investigation: Use Parseable's Investigate feature to quickly diagnose and resolve incidents.
By the end, you'll have a production-ready Kafka monitoring solution that reduces troubleshooting time from hours to minutes.
Prerequisites: Complete Part 1 to set up your Kafka monitoring stack and ensure metrics are flowing into Parseable.
Deep Dive with the SQL Editor
The SQL editor gives you full control over your Kafka metrics. Let's explore some powerful queries.
Access the SQL Editor
- Go to the SQL Editor in the sidenav.
- Select the
kafka_metricsdataset from the dropdown.
Essential Kafka Monitoring Queries
Now let's write SQL queries that leverage the full power of the Kafka metrics schema.
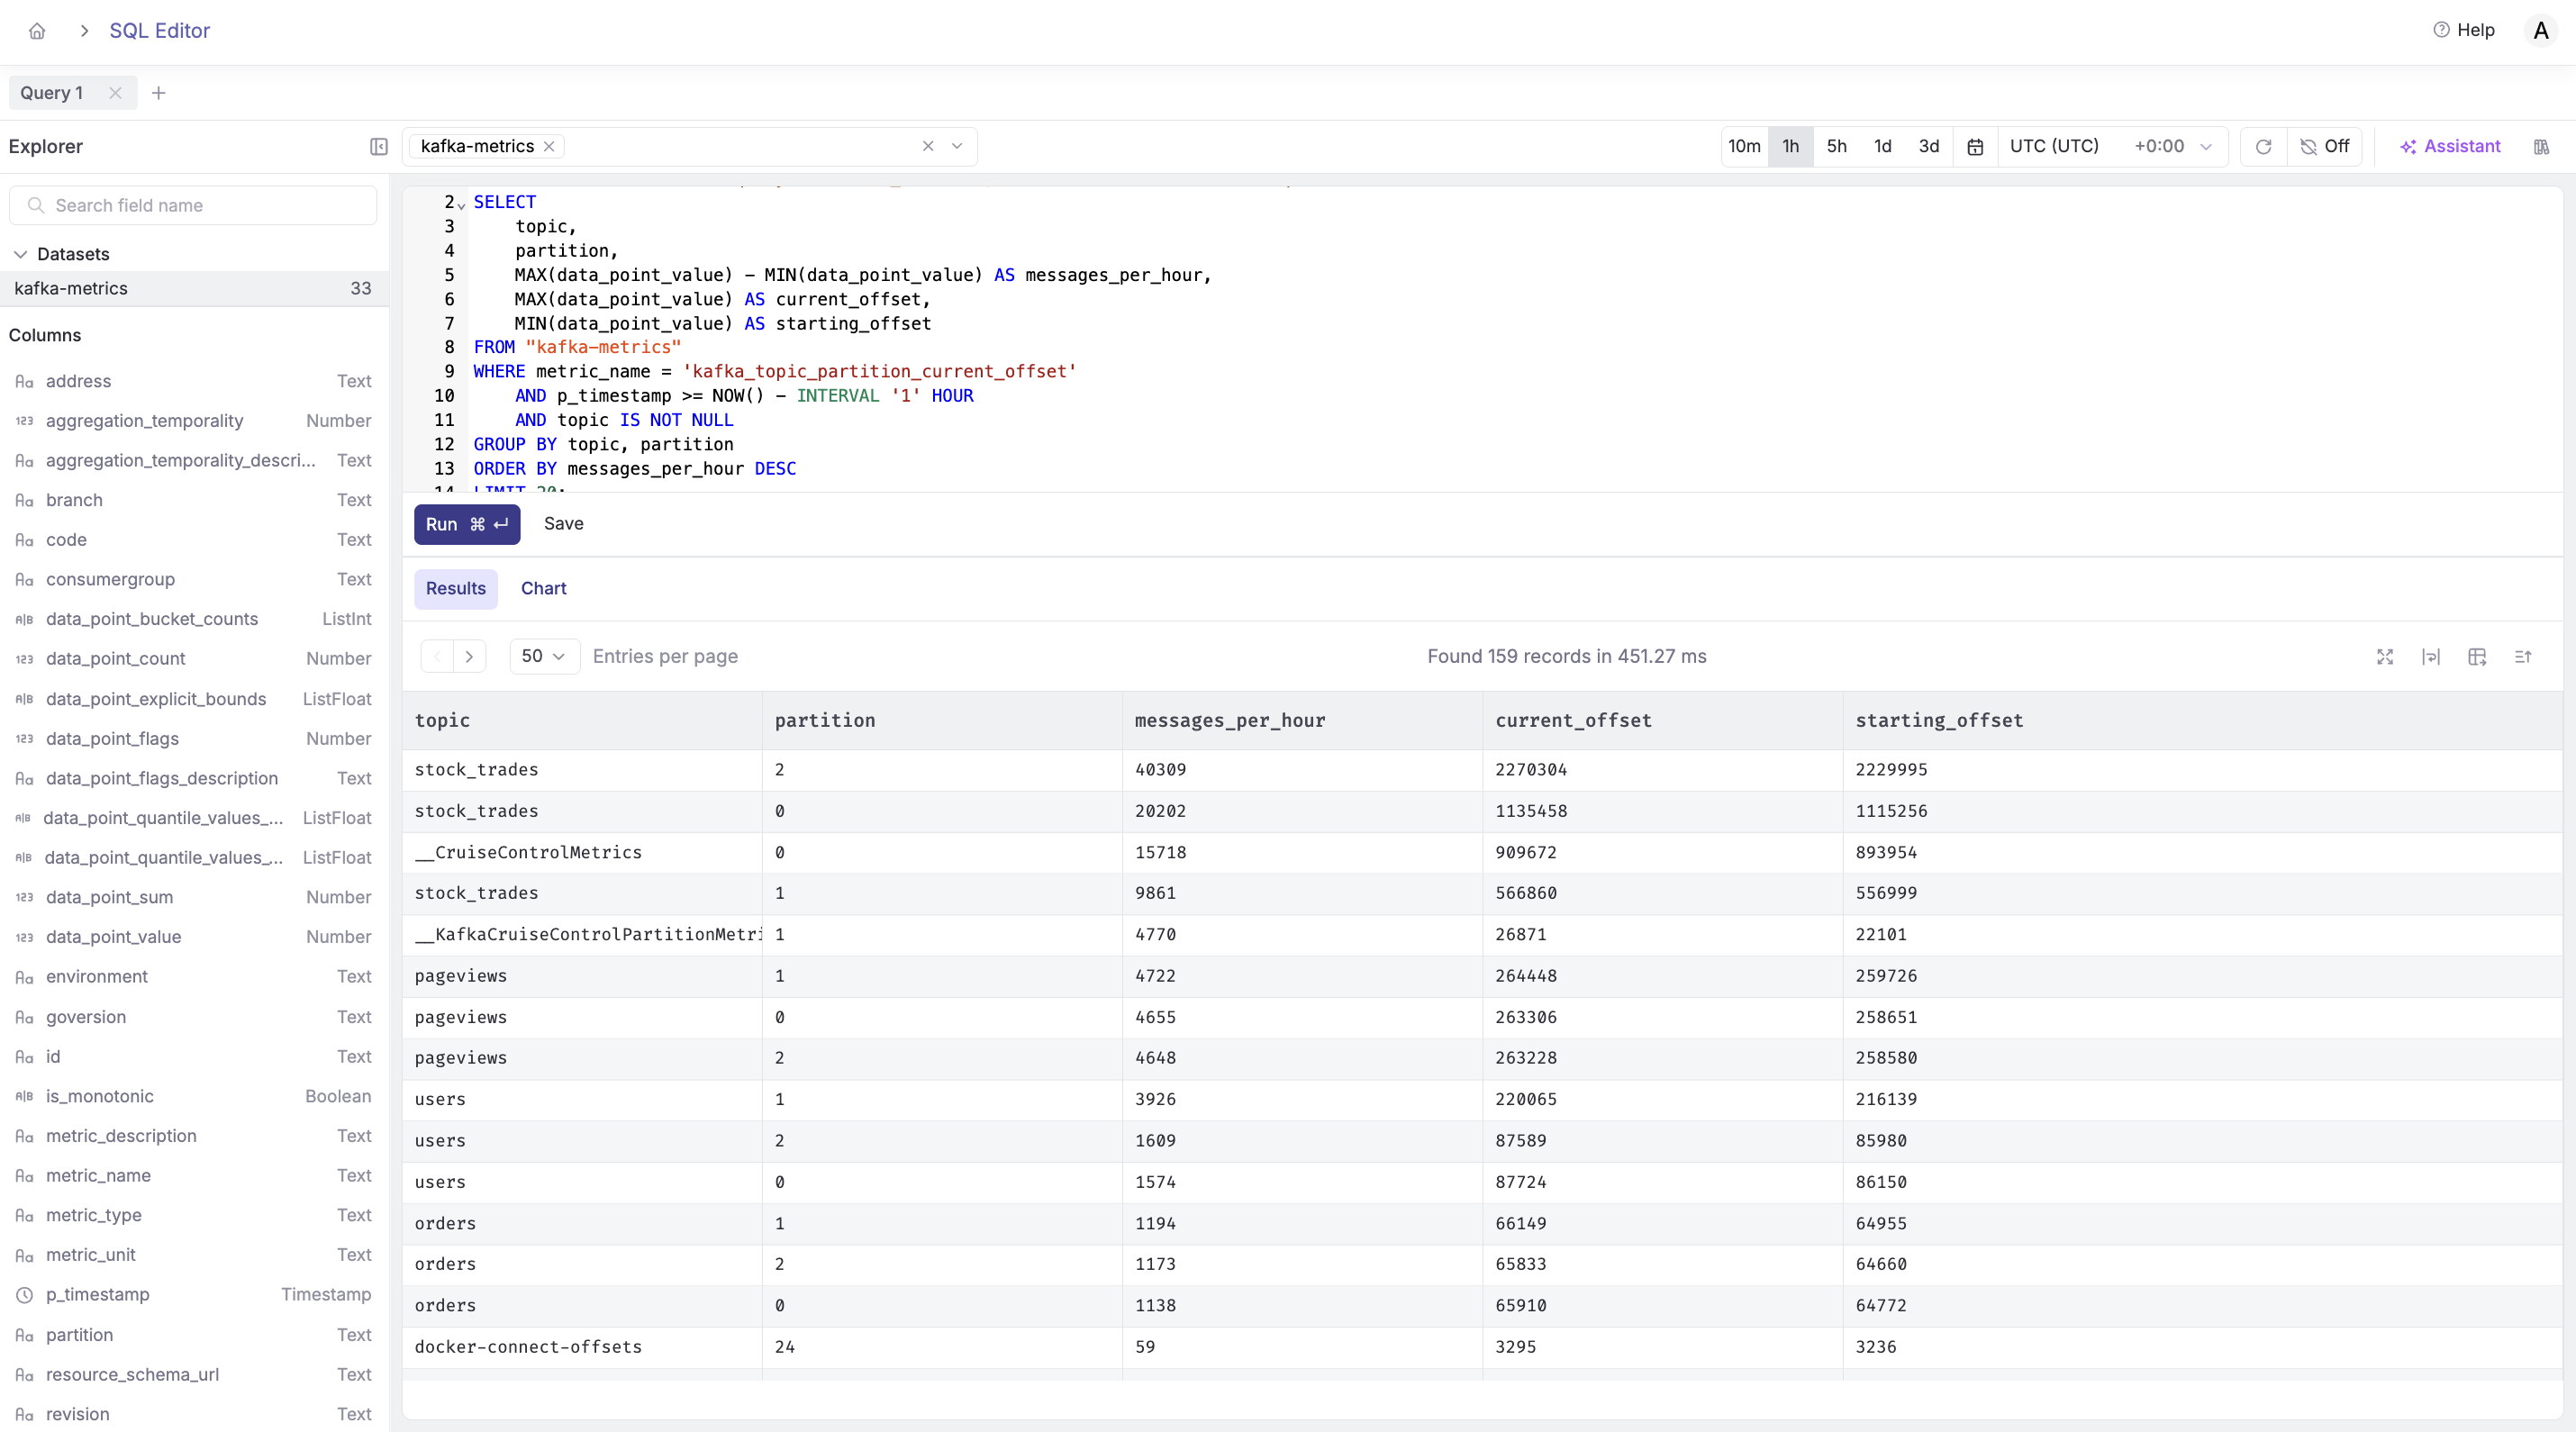
Query 1: Partition Growth Rate
SELECT
    topic,
    partition,
    MAX(data_point_value) - MIN(data_point_value) AS messages_per_hour,
    MAX(data_point_value) AS current_offset,
    MIN(data_point_value) AS starting_offset
FROM "kafka-metrics"
WHERE metric_name = 'kafka_topic_partition_current_offset'
    AND p_timestamp >= NOW() - INTERVAL '1' HOUR
    AND topic IS NOT NULL
GROUP BY topic, partition
ORDER BY messages_per_hour DESC
LIMIT 20;
What it does: Calculates message throughput by measuring offset changes over the last hour.
Use case: Identify your busiest partitions and understand traffic patterns.
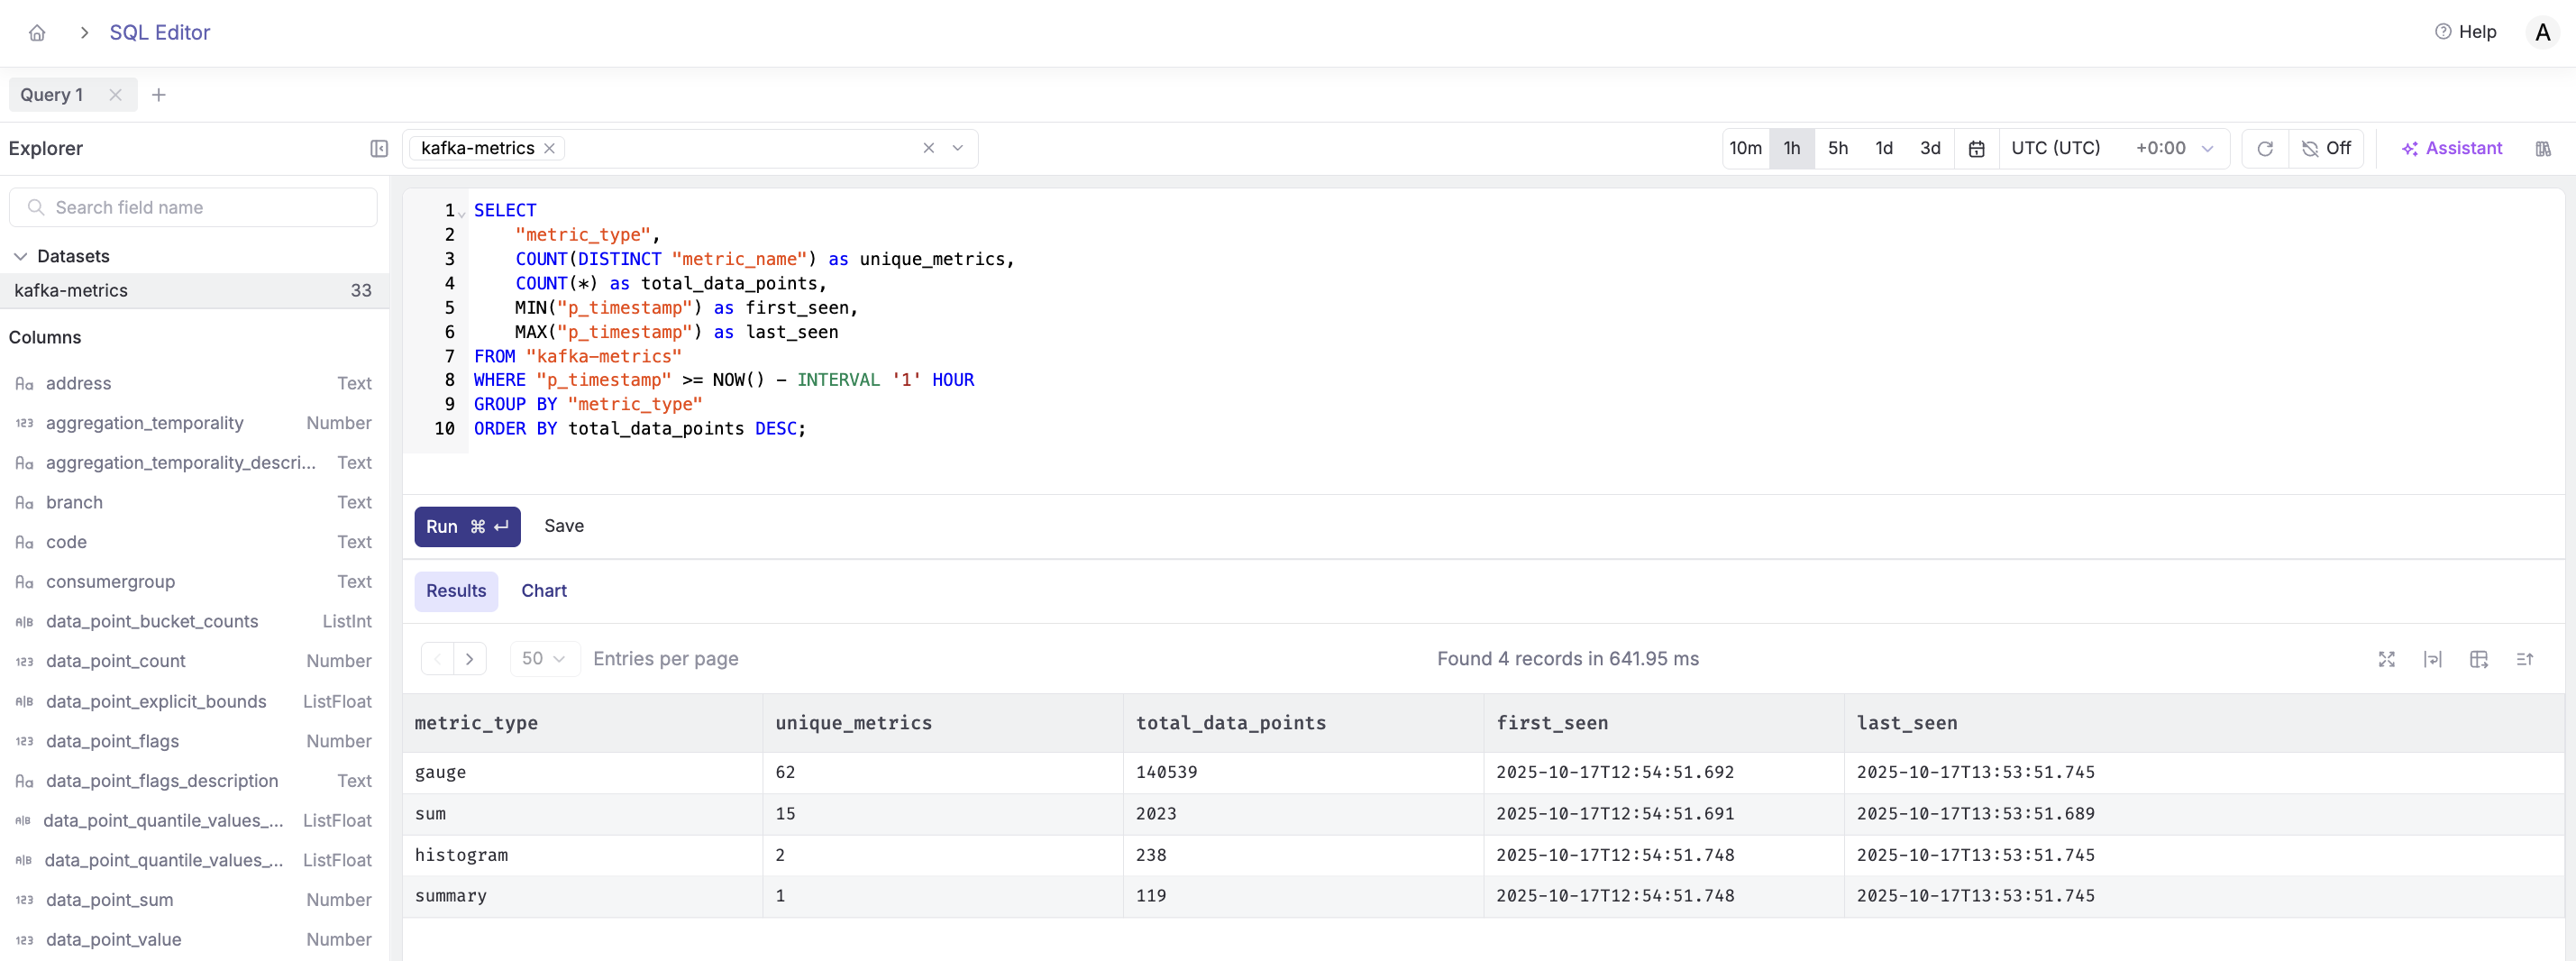
Query 2: Metric Type Distribution
SELECT
    metric_type,
    COUNT(DISTINCT metric_name) as unique_metrics,
    COUNT(*) as total_data_points,
    MIN(p_timestamp) as first_seen,
    MAX(p_timestamp) as last_seen
FROM "kafka-metrics"
WHERE p_timestamp >= NOW() - INTERVAL '1 hour'
GROUP BY metric_type
ORDER BY total_data_points DESC;
What it does: Shows the distribution of metric types being collected.
Use case: Understand what types of metrics you're collecting and their volume.
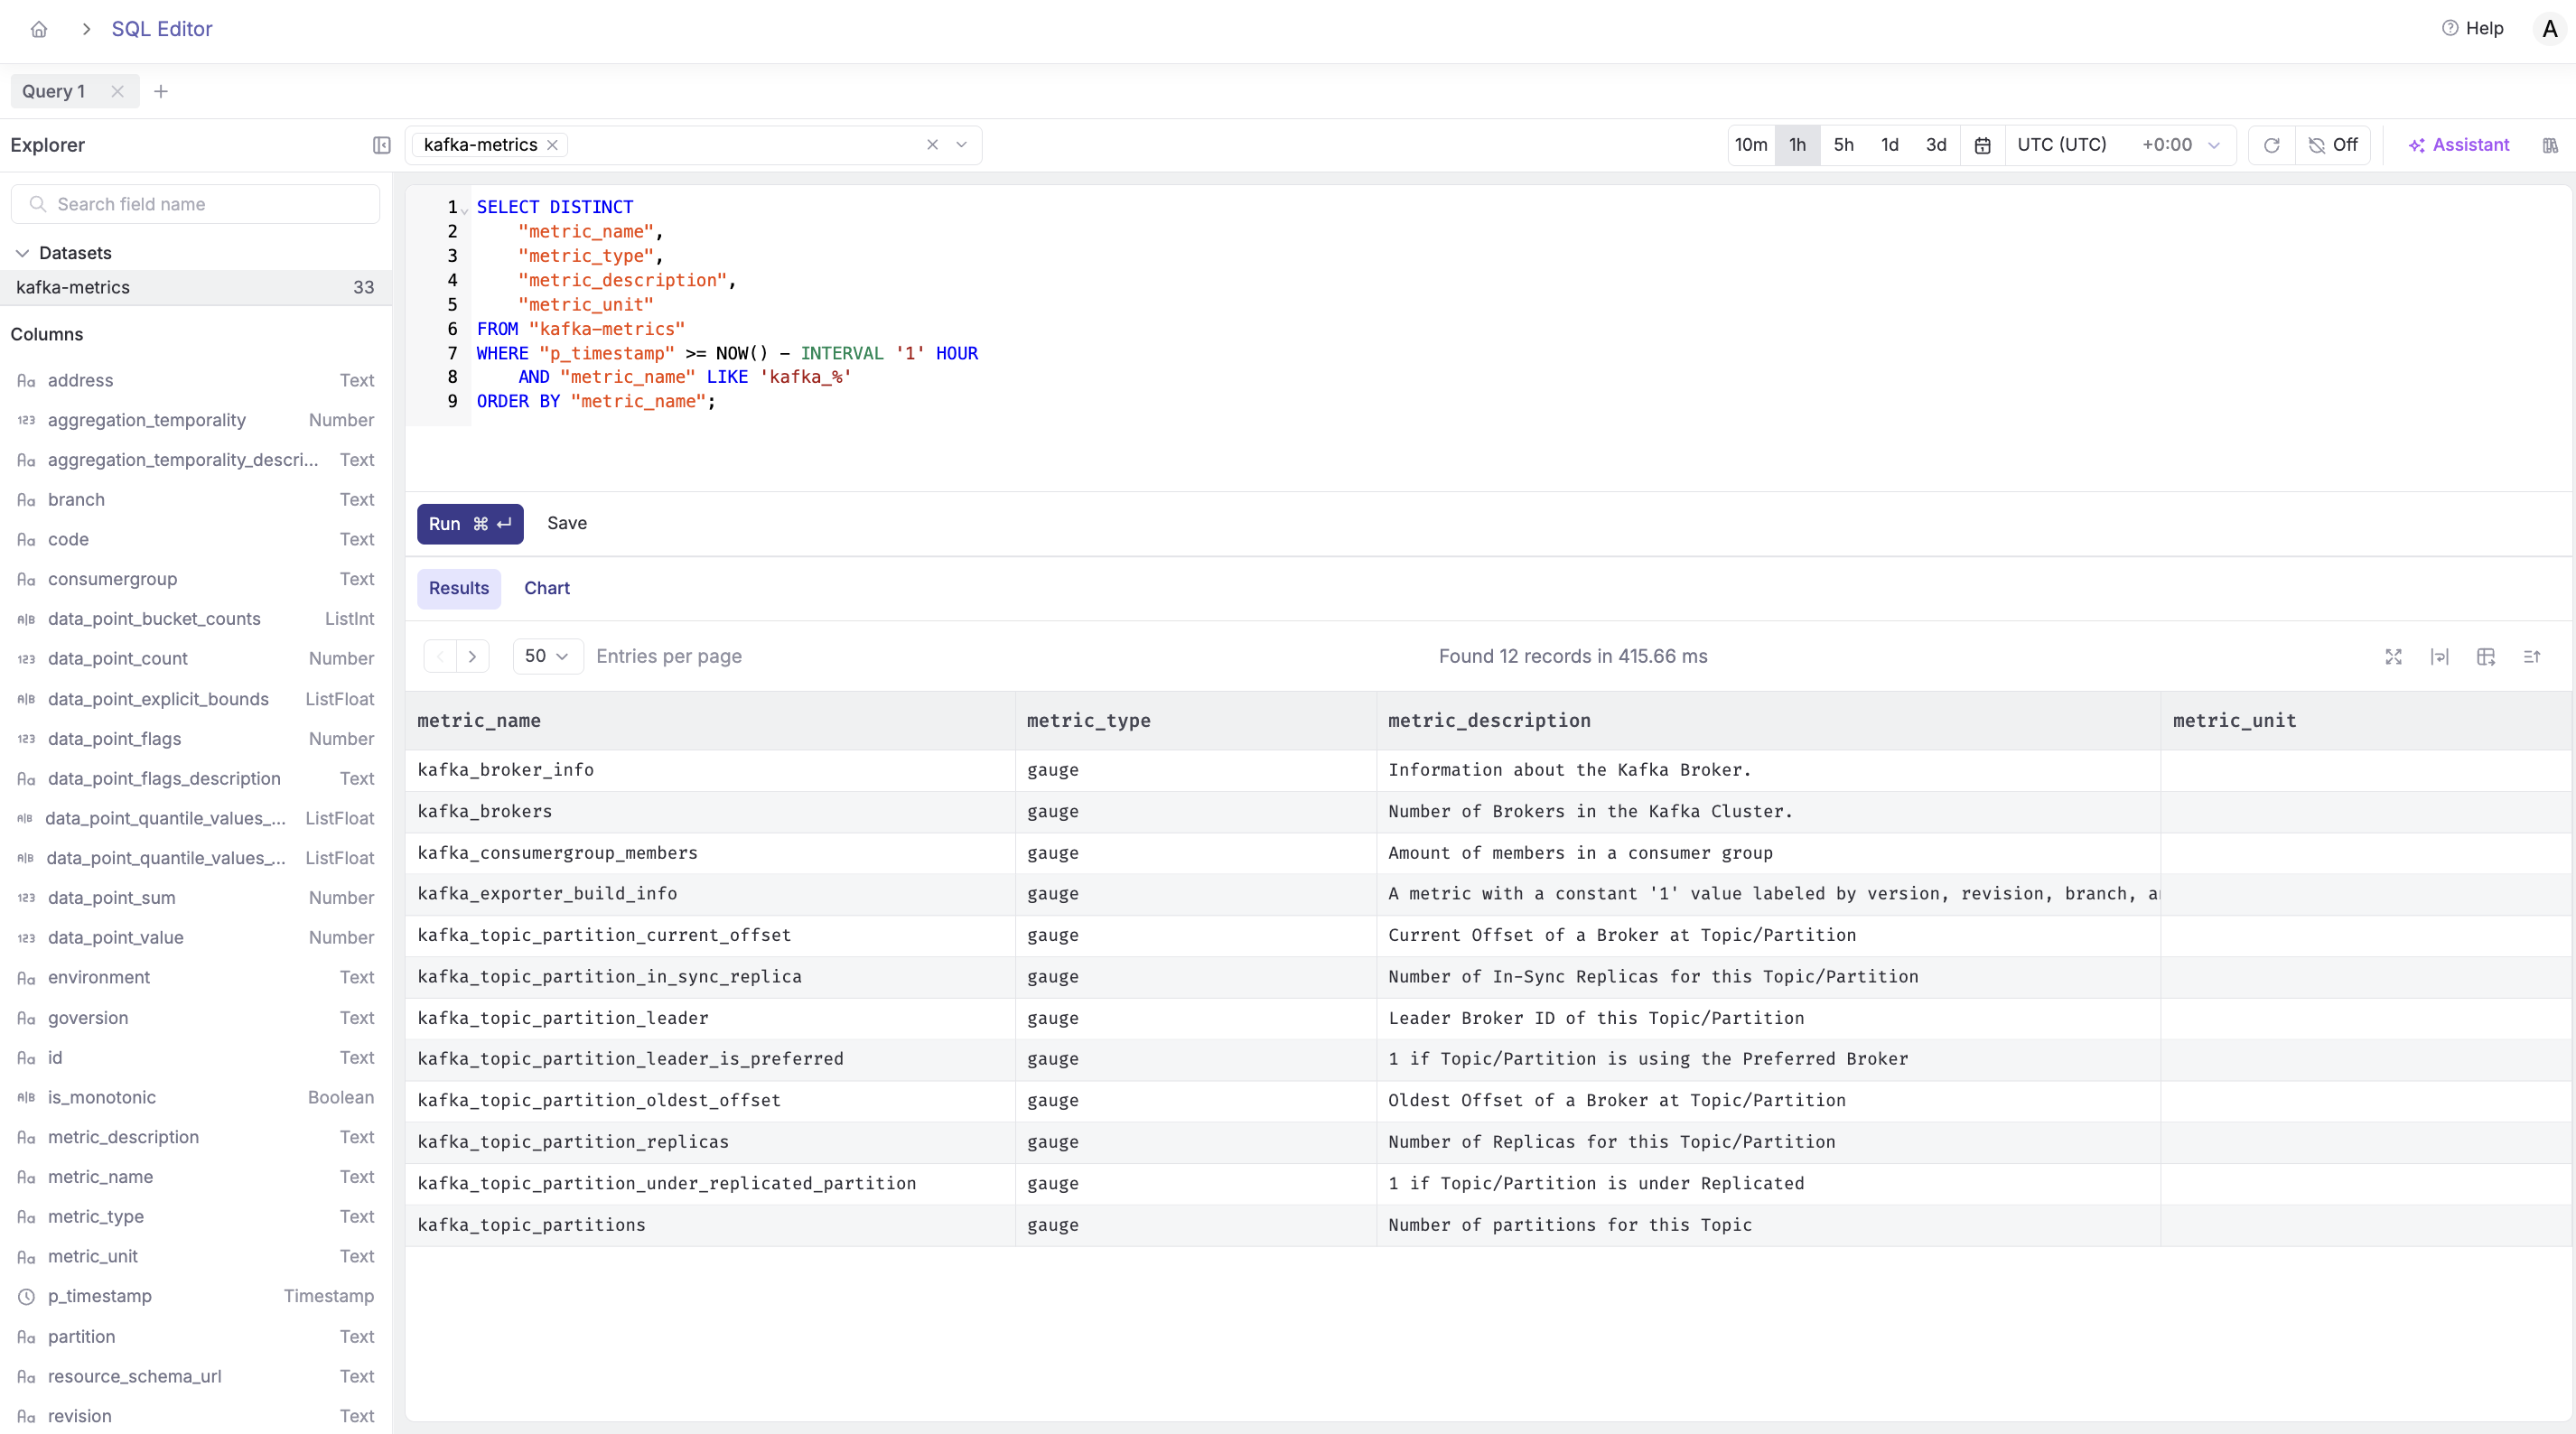
Query 3: All Available Kafka Metrics
SELECT DISTINCT
    metric_name,
    metric_type,
    metric_description,
    metric_unit
FROM "kafka-metrics"
WHERE p_timestamp >= NOW() - INTERVAL '1 hour'
    AND metric_name LIKE 'kafka_%'
ORDER BY metric_name;
What it does: Lists all available Kafka metrics with their metadata.
Use case: Discover what metrics are available for monitoring and analysis.
Saving Queries for Reuse
Click the Save Query button to add frequently-used queries to your library for quick access.
Building Visualizations and Charts
Now let's turn these queries into visual dashboards.
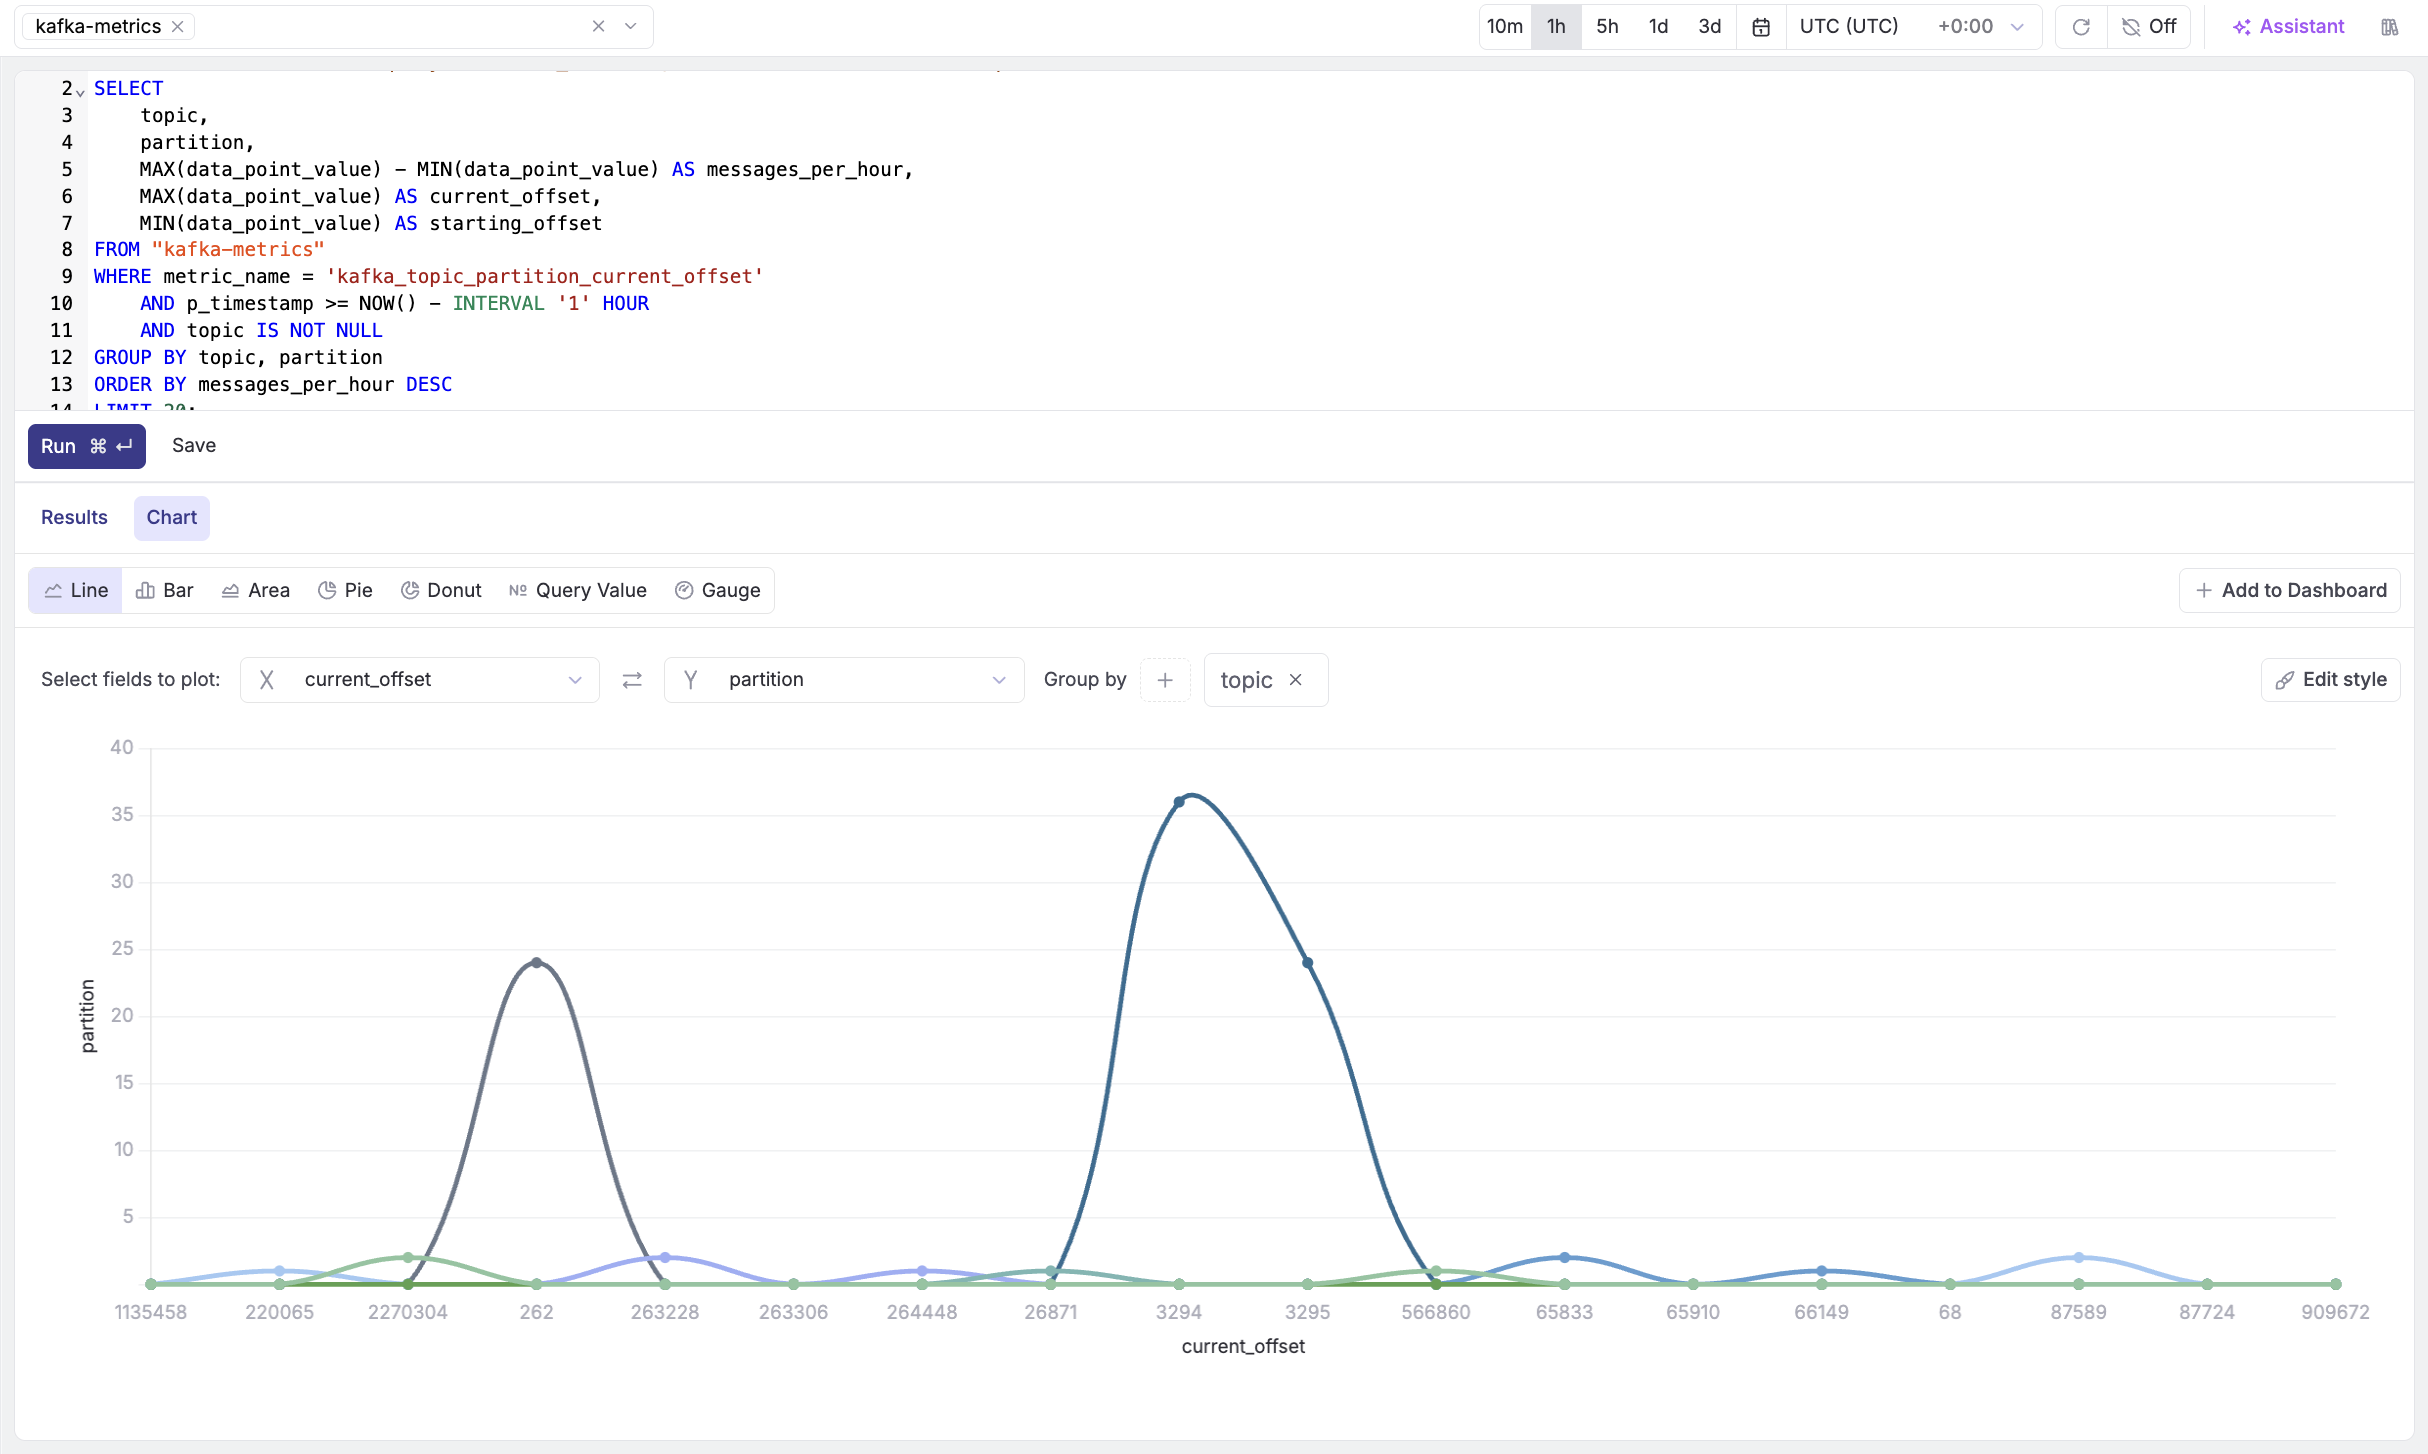
Creating Your First Chart
- Run the Partition Growth Rate query (Query 1 from above)
- Click the Visualize button
- Select chart type: Bar Chart
- Configure:
- X-axis:
topic - Y-axis:
messages_per_hour - Color by:
partition
- X-axis:
- Click Add to Dashboard and add toyour desired Kafka Monitoring Dashboard.
Chart Types for Kafka Metrics
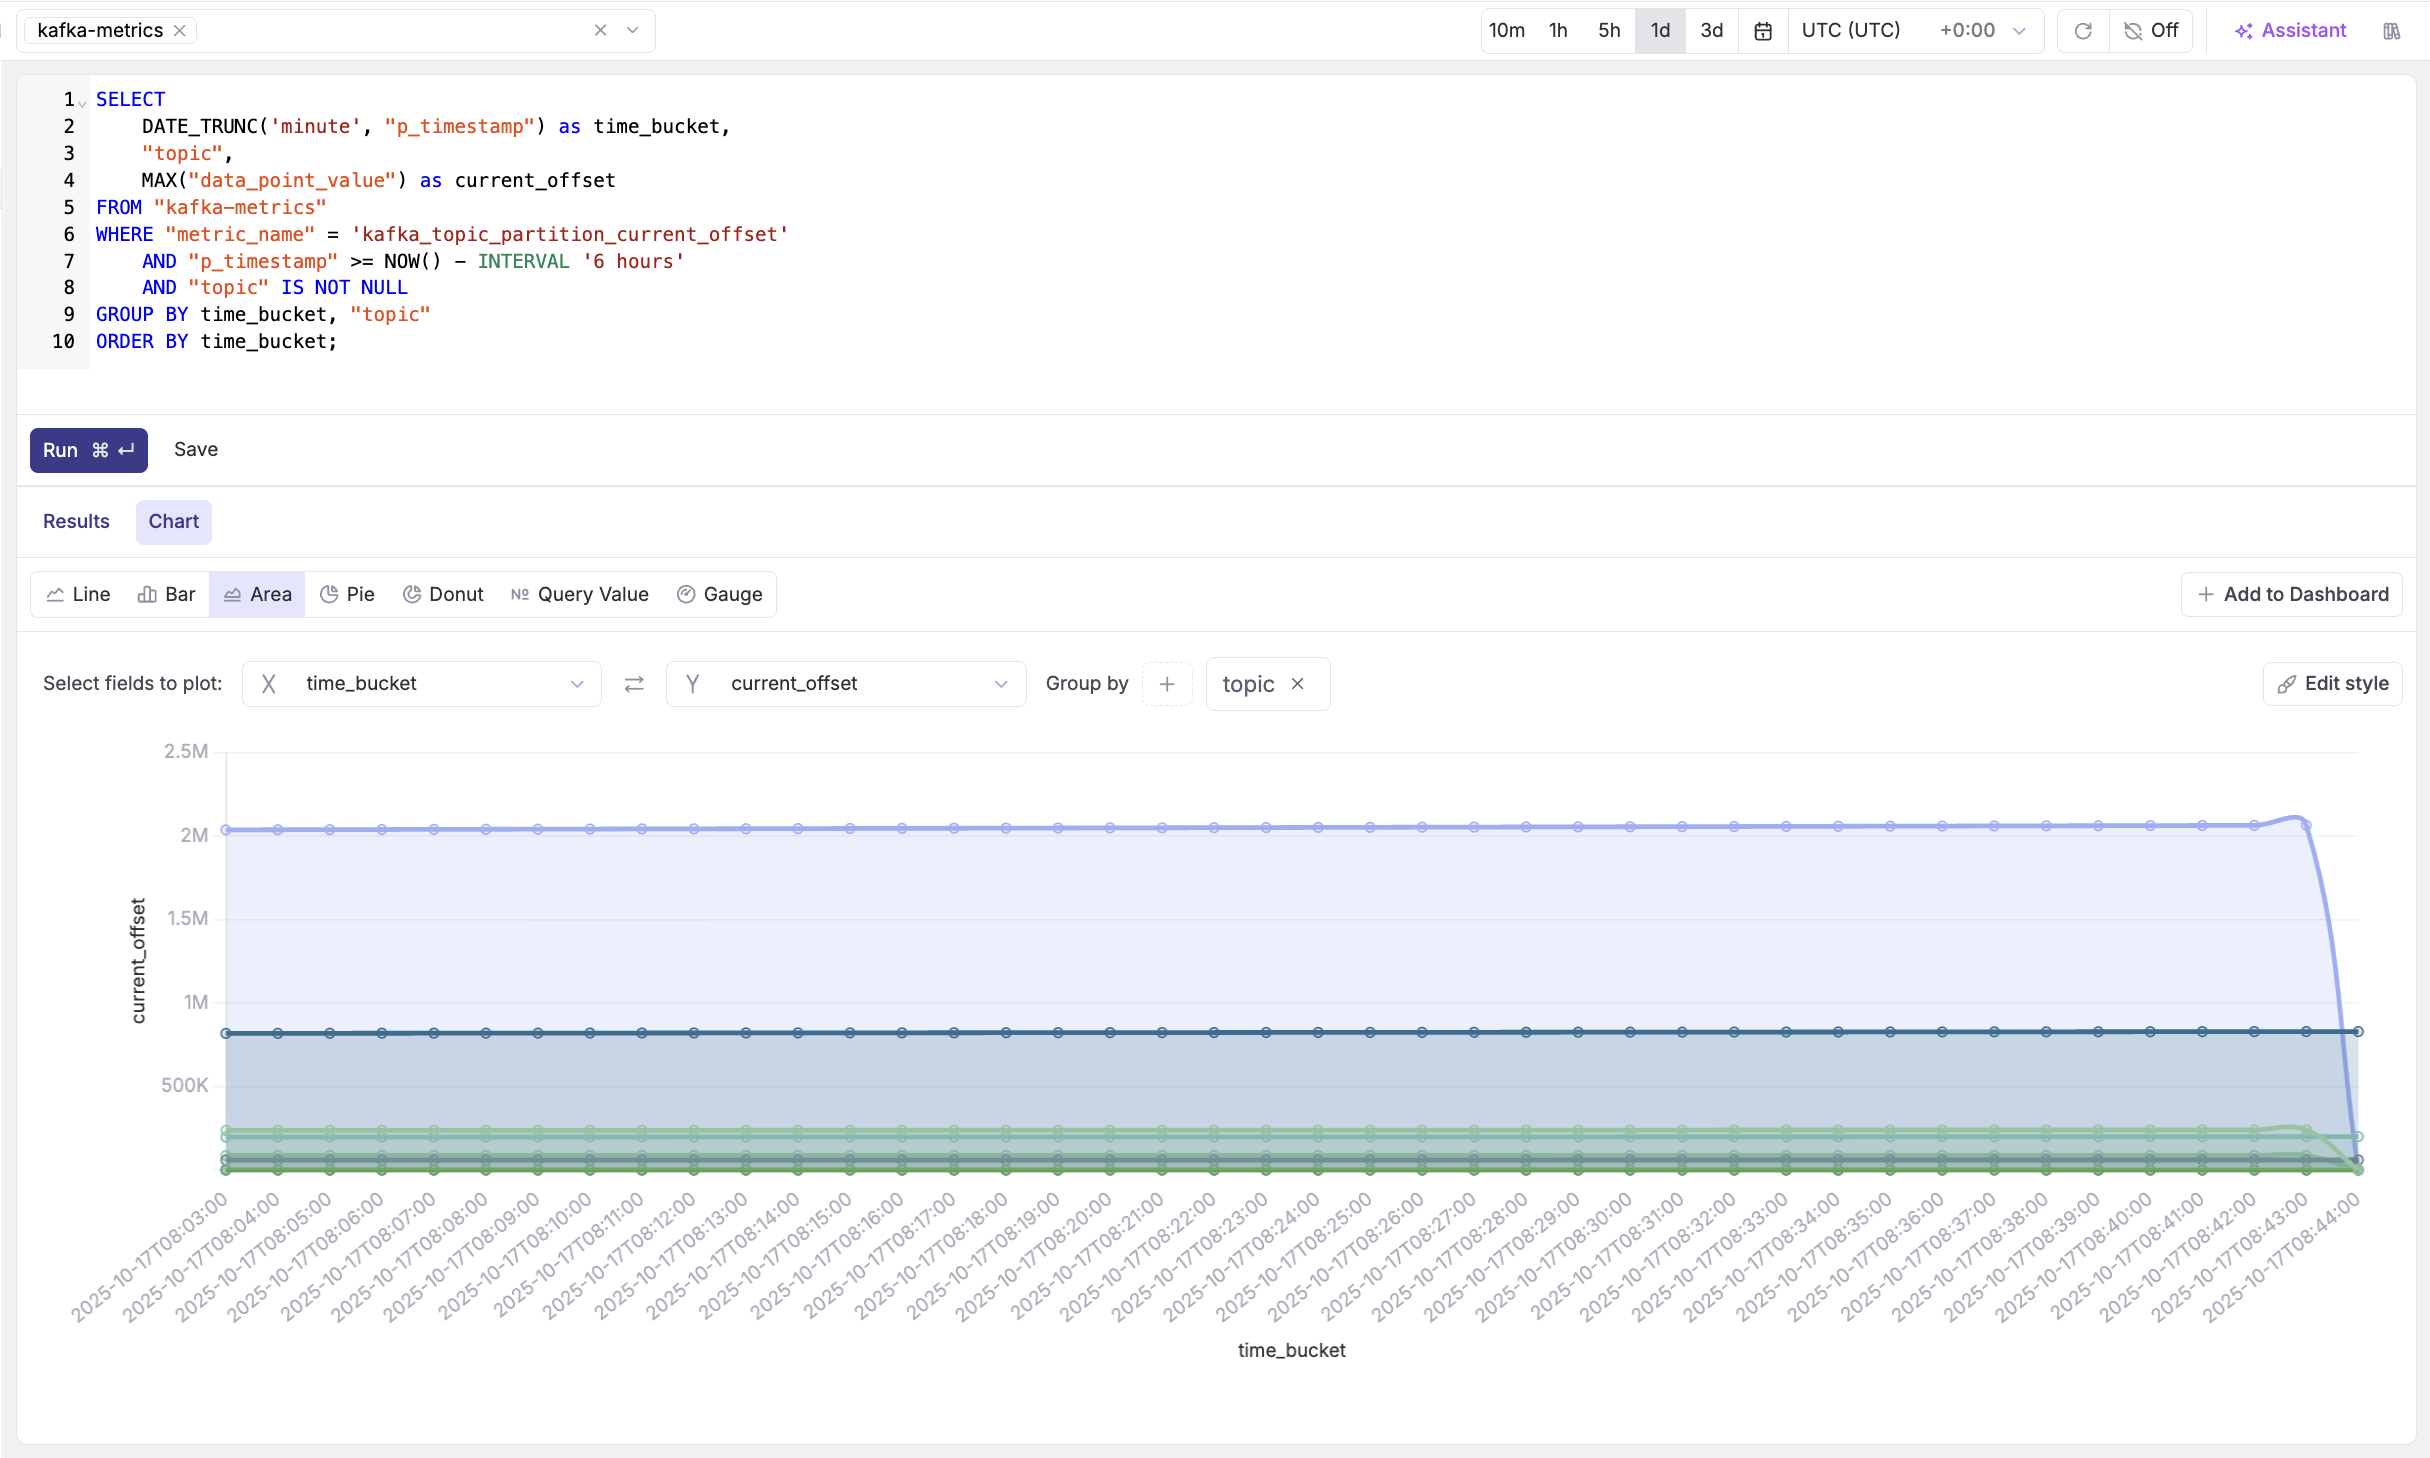
Area Chart: Message Throughput
SELECT
    DATE_TRUNC('minute', p_timestamp) as time_bucket,
    topic,
    MAX(data_point_value) as current_offset
FROM "kafka-metrics"
WHERE metric_name = 'kafka_topic_partition_current_offset'
    AND p_timestamp >= NOW() - INTERVAL '6 hours'
    AND topic IS NOT NULL
GROUP BY time_bucket, topic
ORDER BY time_bucket;
Configuration:
- Chart type: Area Chart (stacked)
- X-axis:
time_bucket - Y-axis:
current_offset - Stack by:
topic
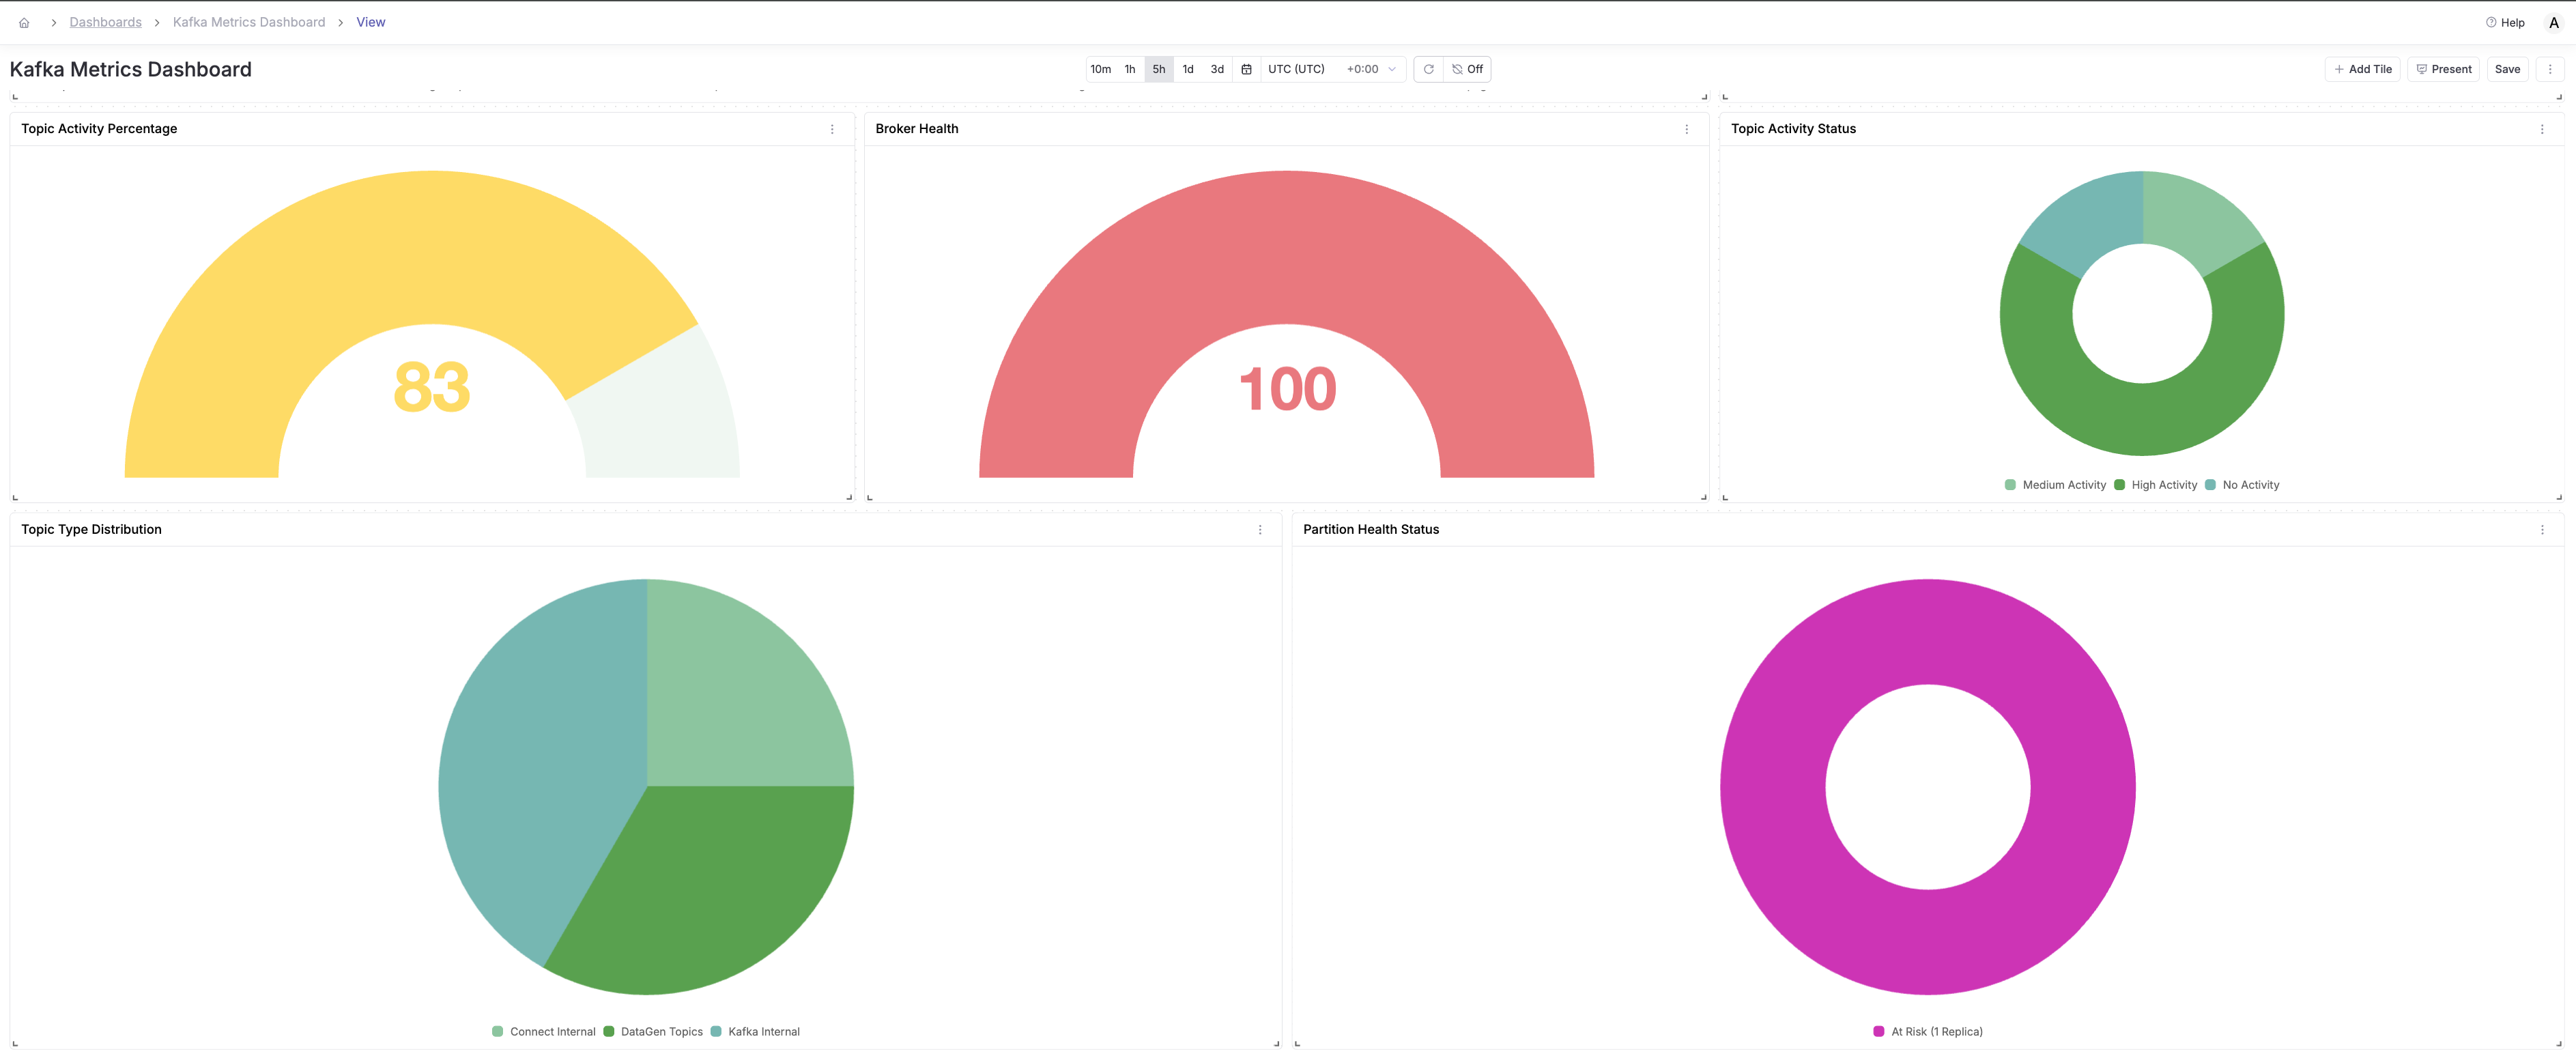
Building a Comprehensive Kafka Dashboard
Let's create a production-ready dashboard with multiple panels.
Dashboard Layout
- Click Dashboards in the navigation
- Click Create New Dashboard
- Name it "Kafka Cluster Overview"
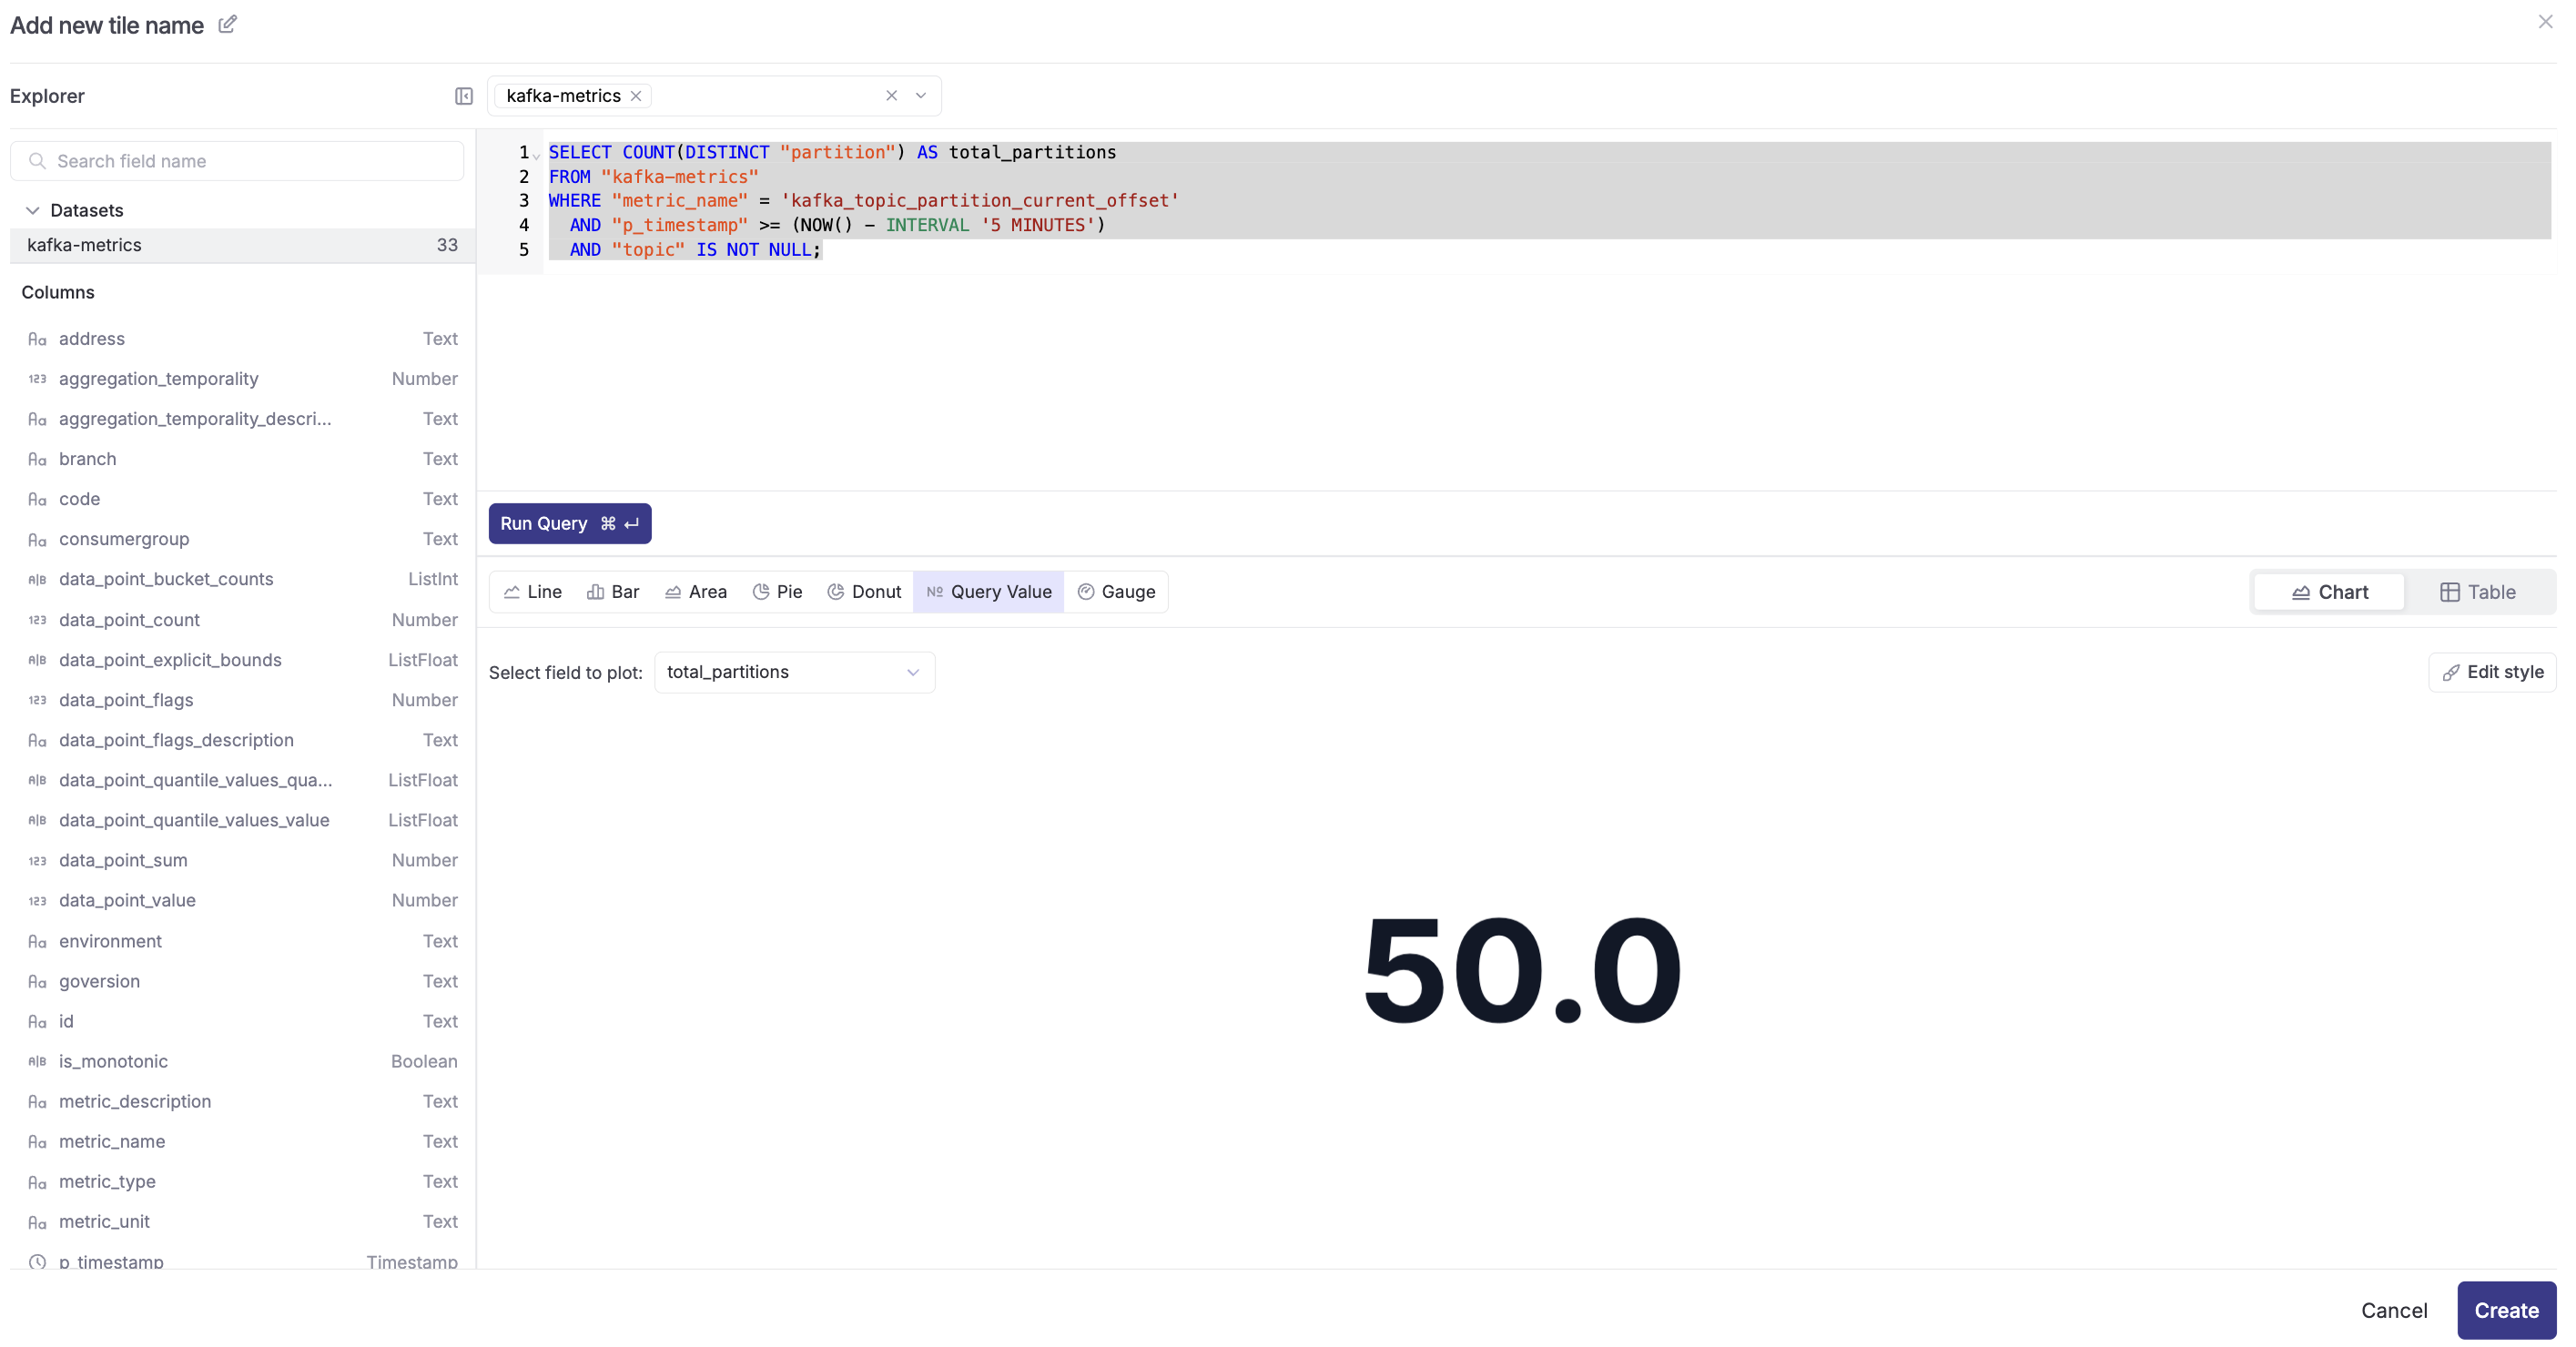
Panel 1: Total Partition Count (Top Row - Query Value)
- Click on "+Add Tile" and select "Create with SQL"
- Select the "kafka-metrics" dataset from the dropdown
- Copy and paste the following query:
SELECT COUNT(DISTINCT "partition") AS total_partitions
FROM "kafka-metrics"
WHERE "metric_name" = 'kafka_topic_partition_current_offset'
  AND "p_timestamp" >= (NOW() - INTERVAL '5 MINUTES')
AND "topic" IS NOT NULL;- Click Run Query
- Select chart type: Query Value
- Configure:
- Select Field to Plot:
total_partitions
- Select Field to Plot:
- Click Create
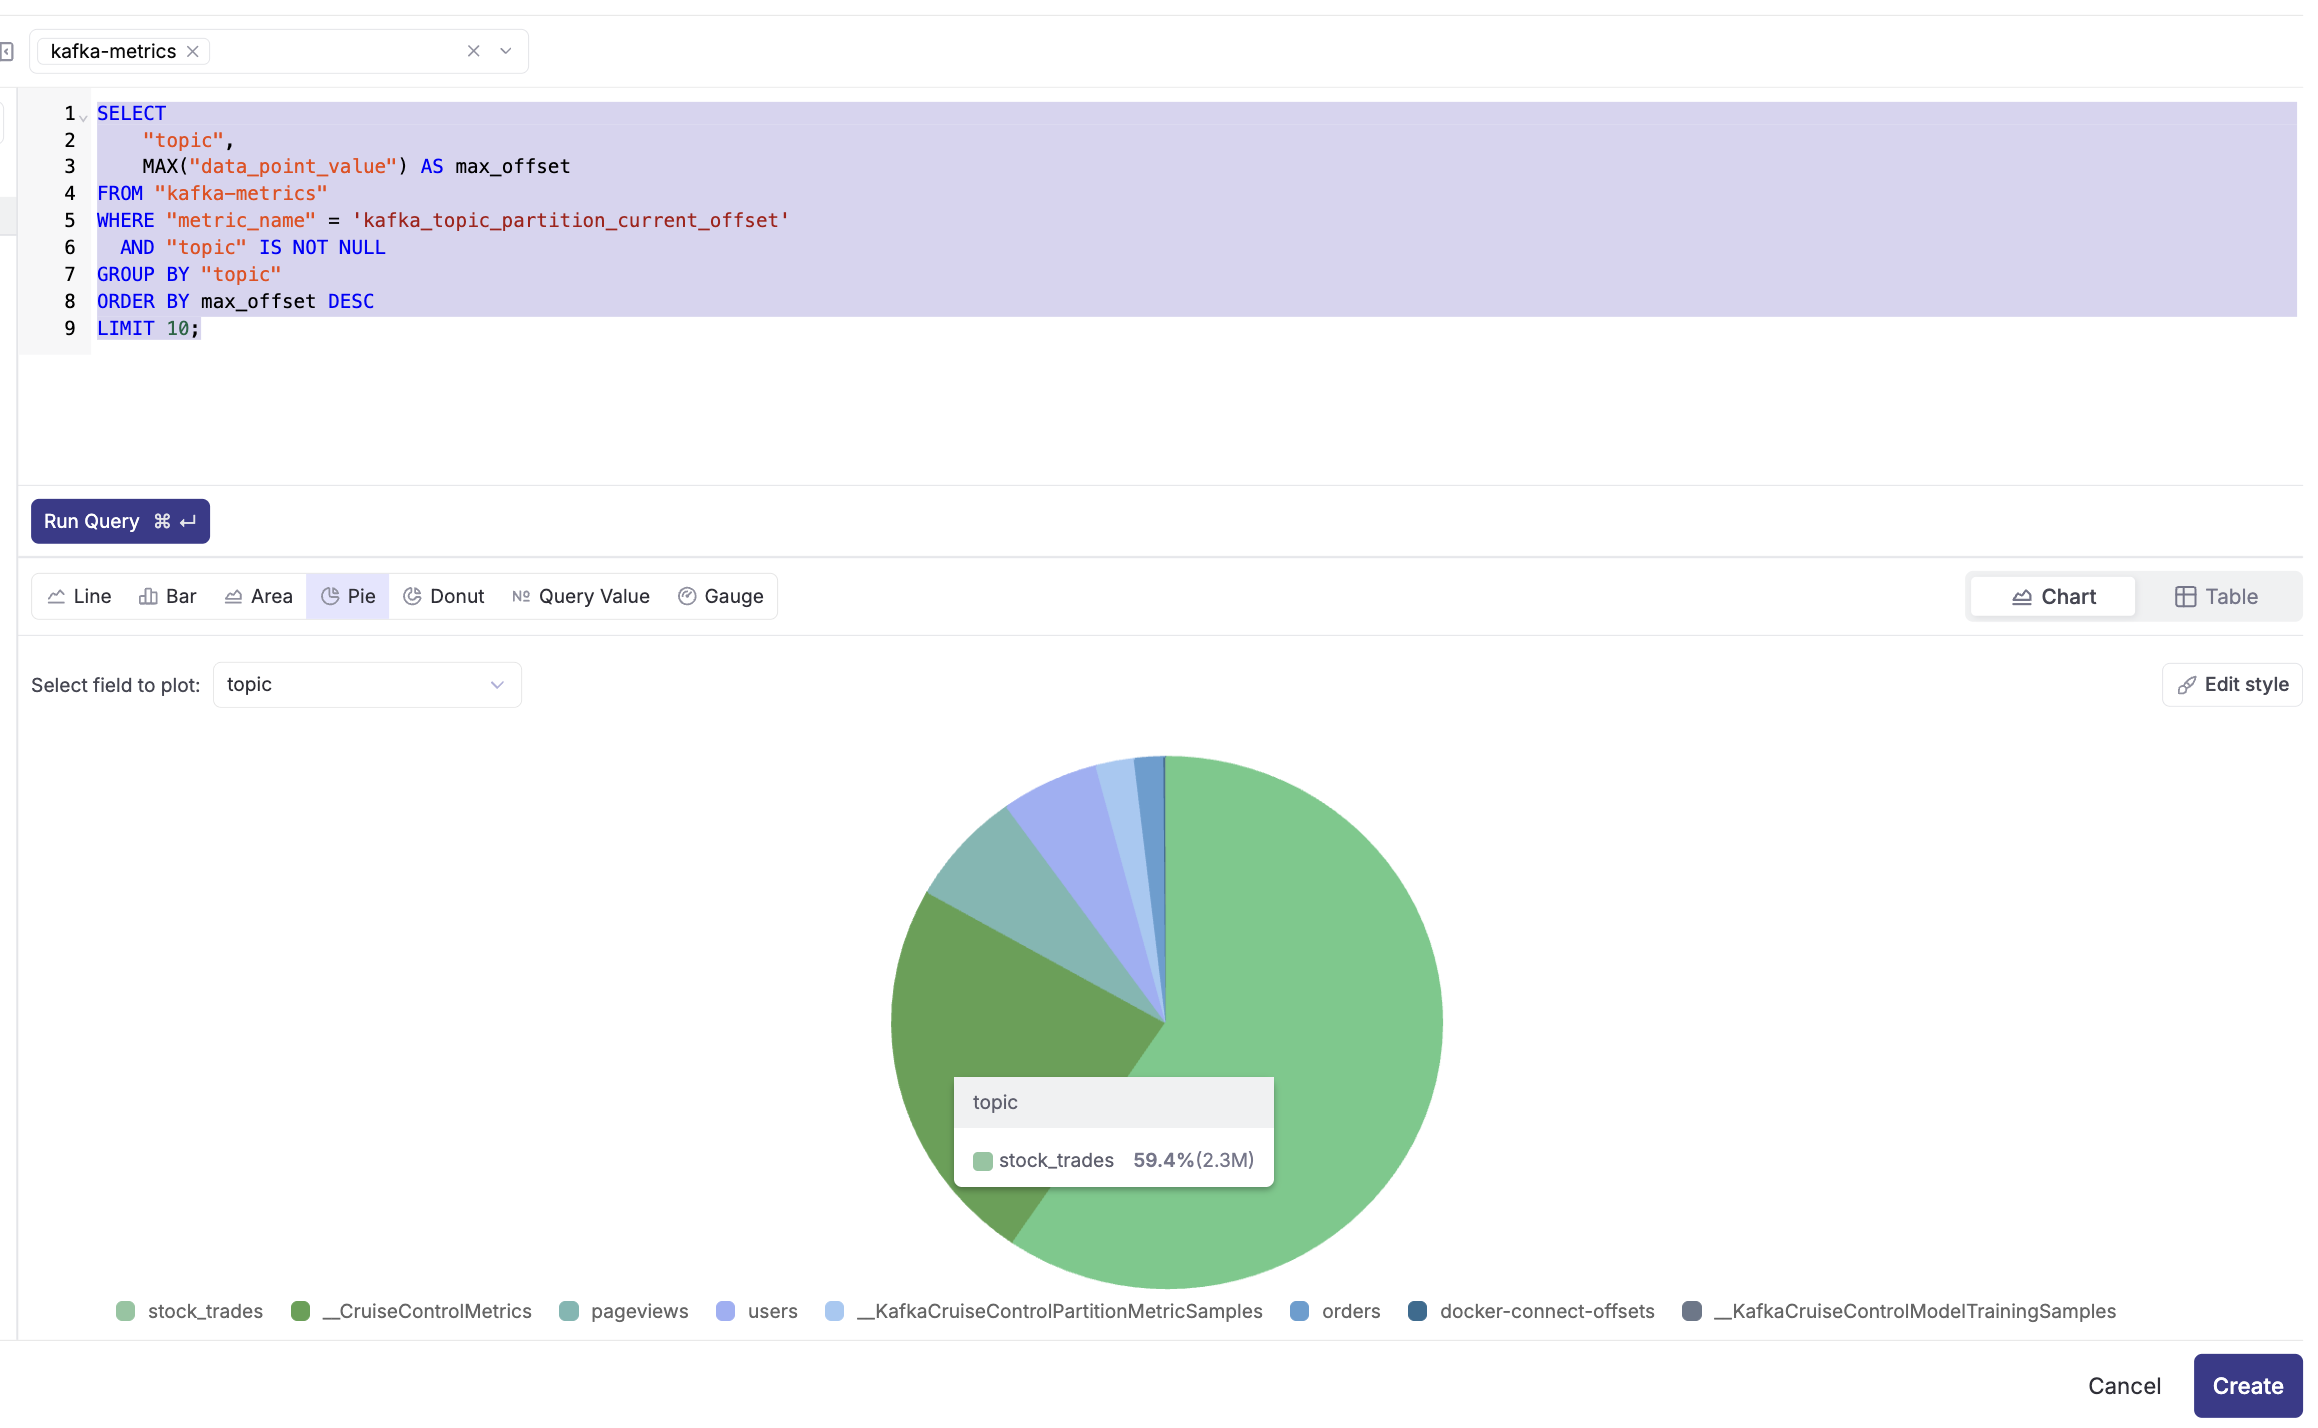
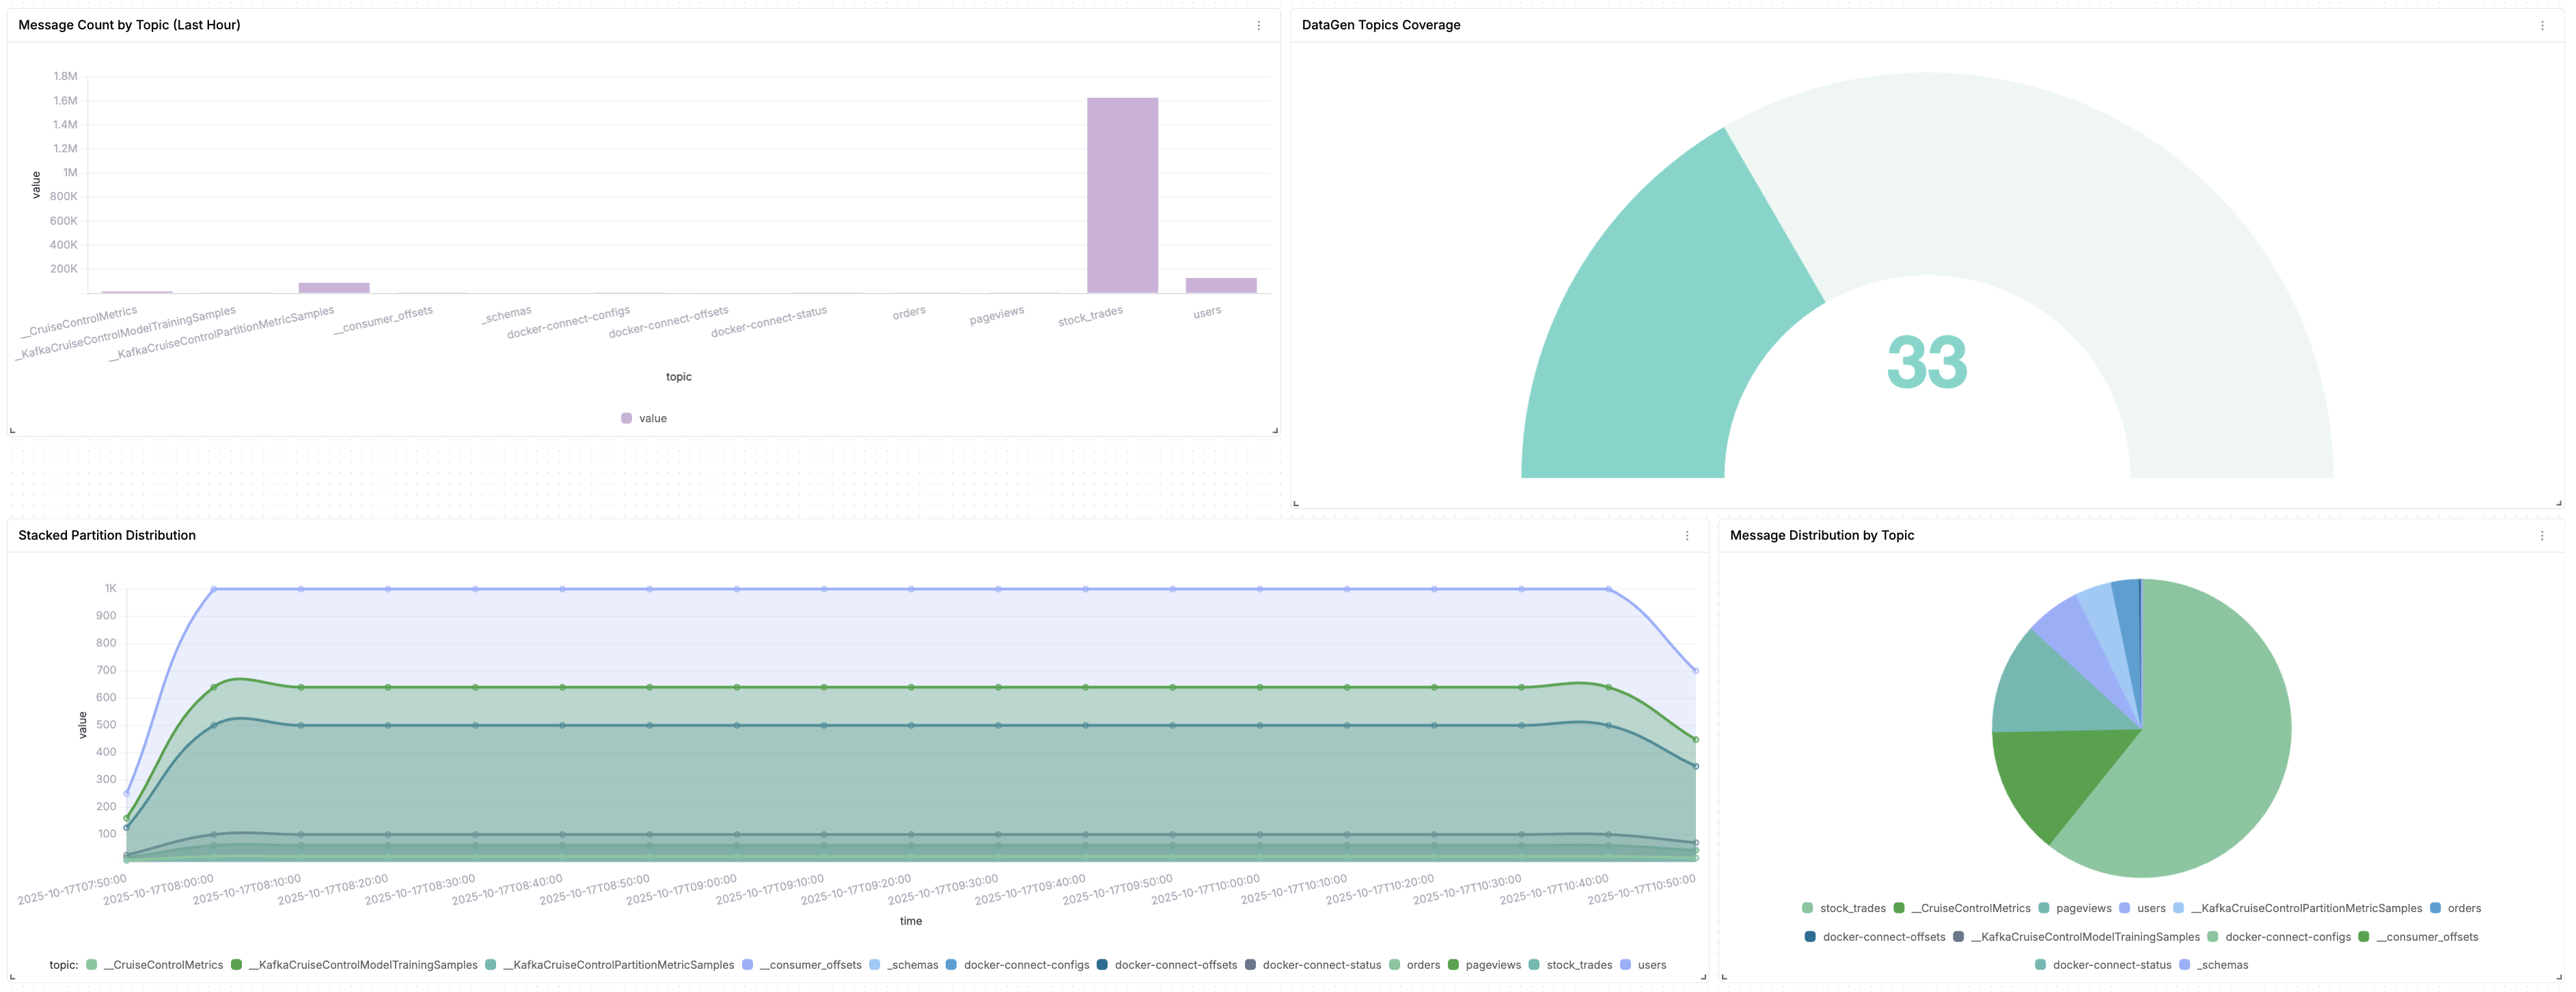
Panel 2: Topic Message Distribution (Top Row - Pie Chart)
- Click on "+Add Tile" and select "Create with SQL"
- Select "kafka-metrics" dataset
- Query:
SELECT
    "topic",
    MAX("data_point_value") AS max_offset
FROM "kafka-metrics"
WHERE "metric_name" = 'kafka_topic_partition_current_offset'
  AND "topic" IS NOT NULL
GROUP BY "topic"
ORDER BY max_offset DESC
LIMIT 10;- Chart type: Pie Chart
- Configure:
- Select Field to Plot:
topic
- Select Field to Plot:
- Click Create
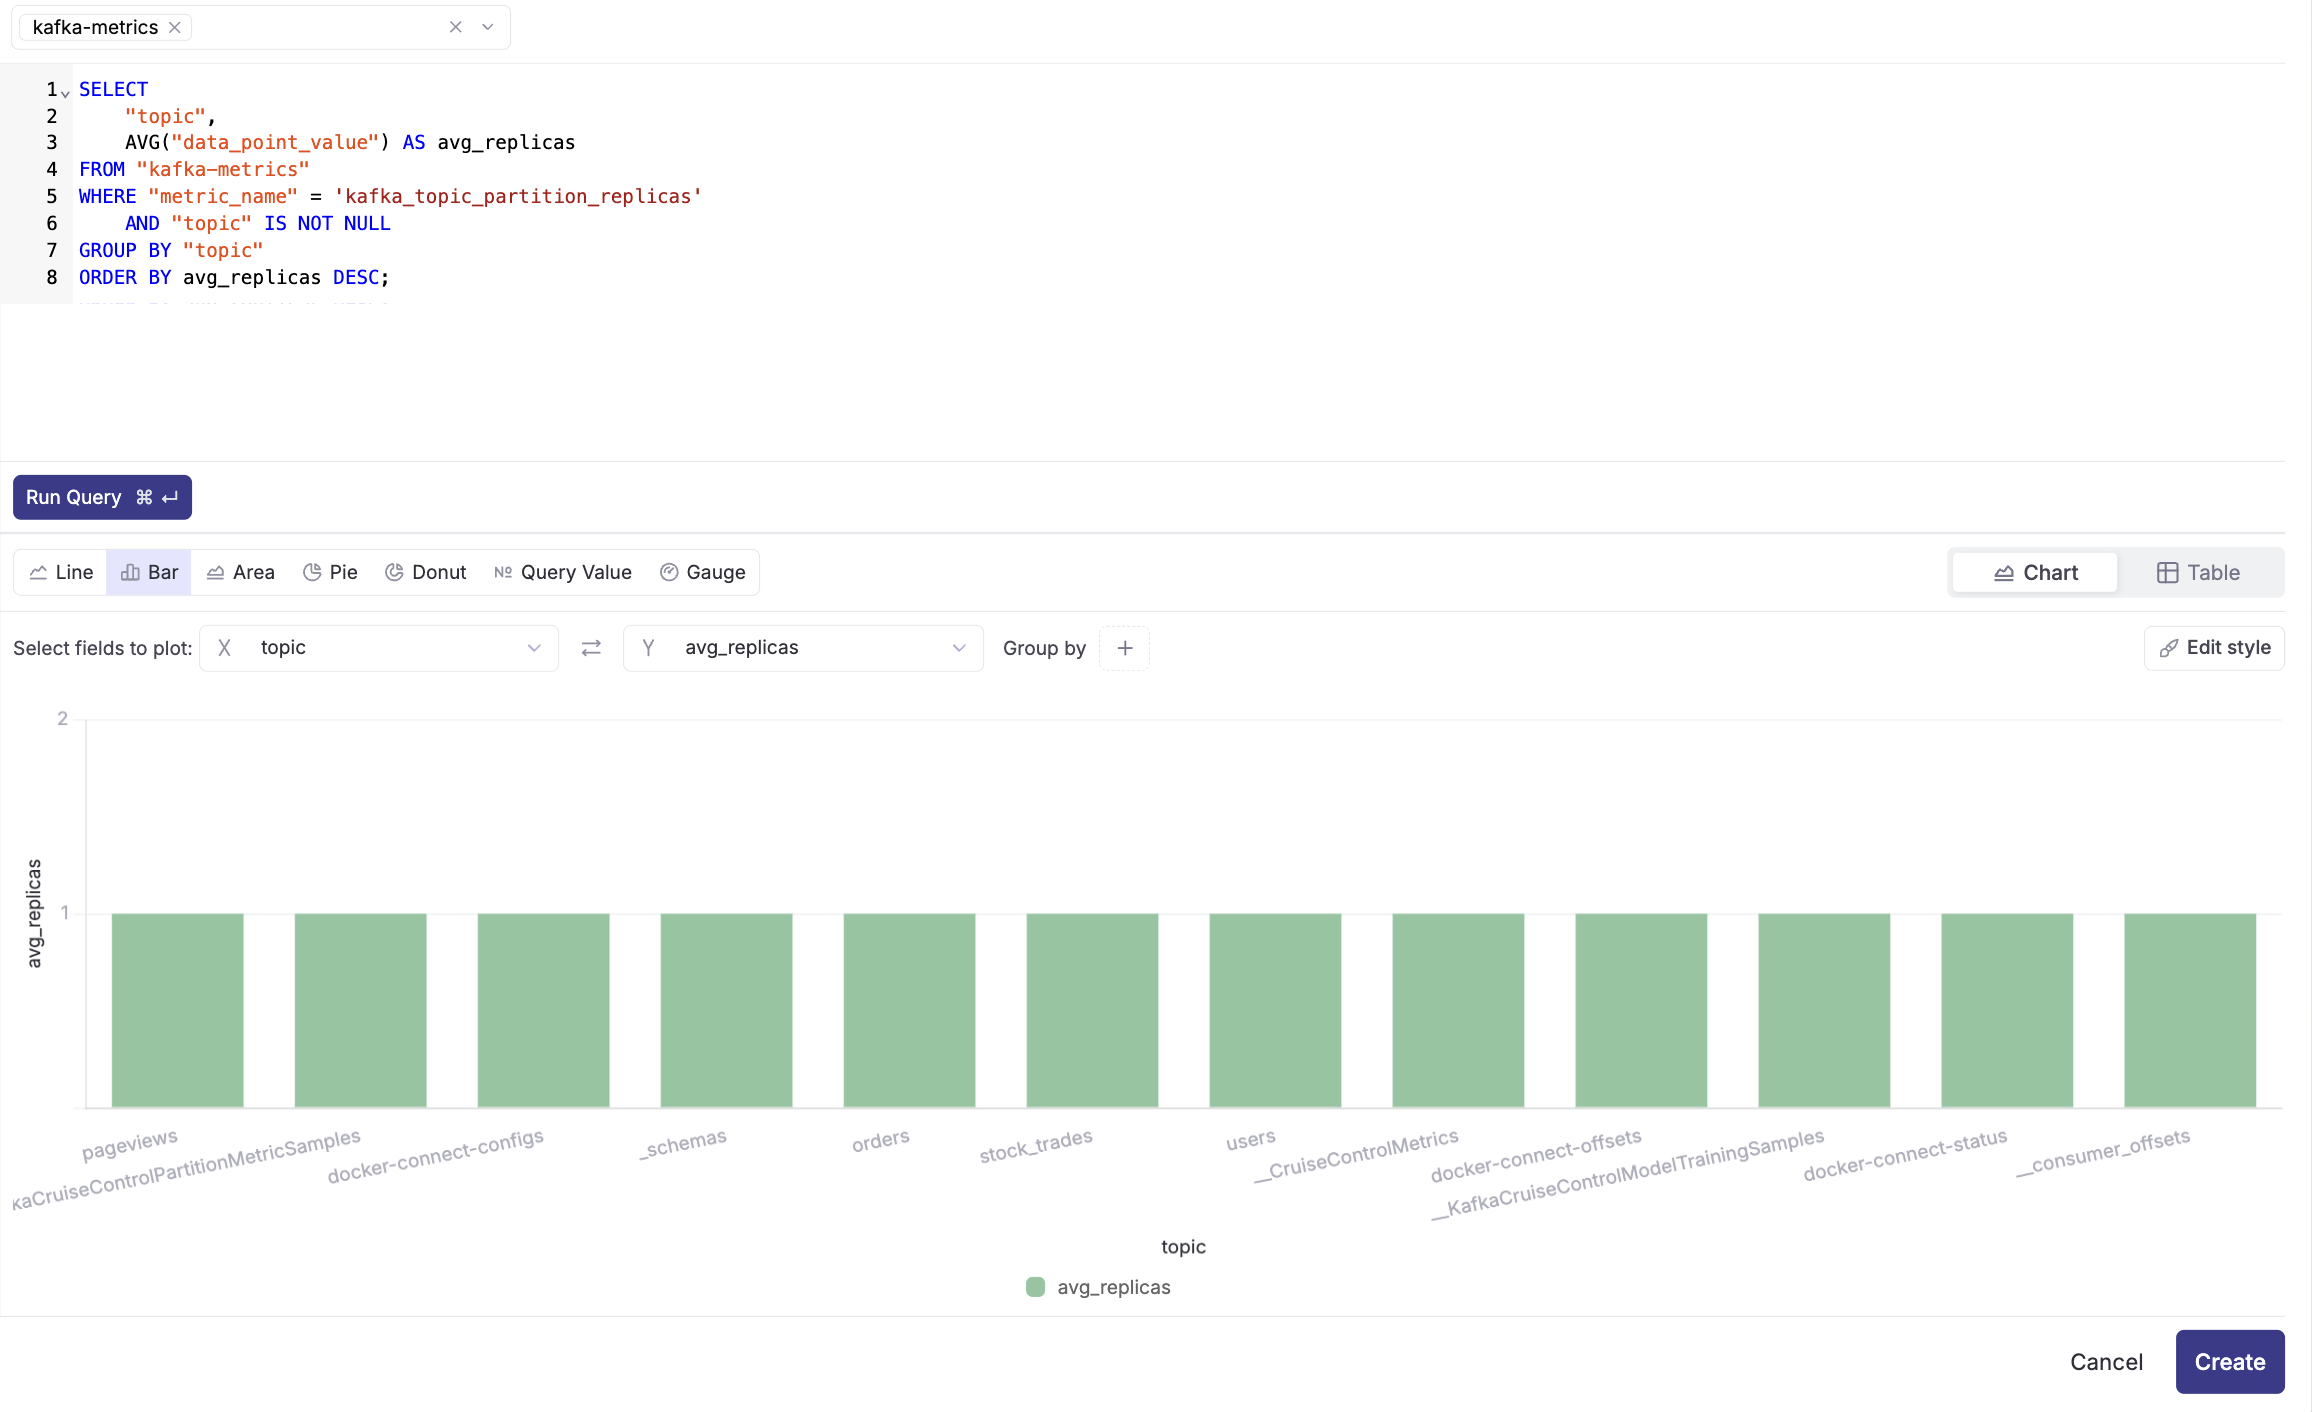
Panel 3: Partition Replicas by Topic (Top Row - Bar Chart)
- Click on "+Add Tile" and select "Create with SQL"
- Select "kafka-metrics" dataset
- Query:
SELECT
    "topic",
    AVG("data_point_value") AS avg_replicas
FROM "kafka-metrics"
WHERE "metric_name" = 'kafka_topic_partition_replicas'
    AND "p_timestamp" >= NOW() - INTERVAL '5' MINUTE
    AND "topic" IS NOT NULL
GROUP BY "topic"
ORDER BY avg_replicas DESC;- Chart type: Bar Chart
- Configure:
- X-axis:
topic - Y-axis:
avg_replicas
- X-axis:
- Click Create
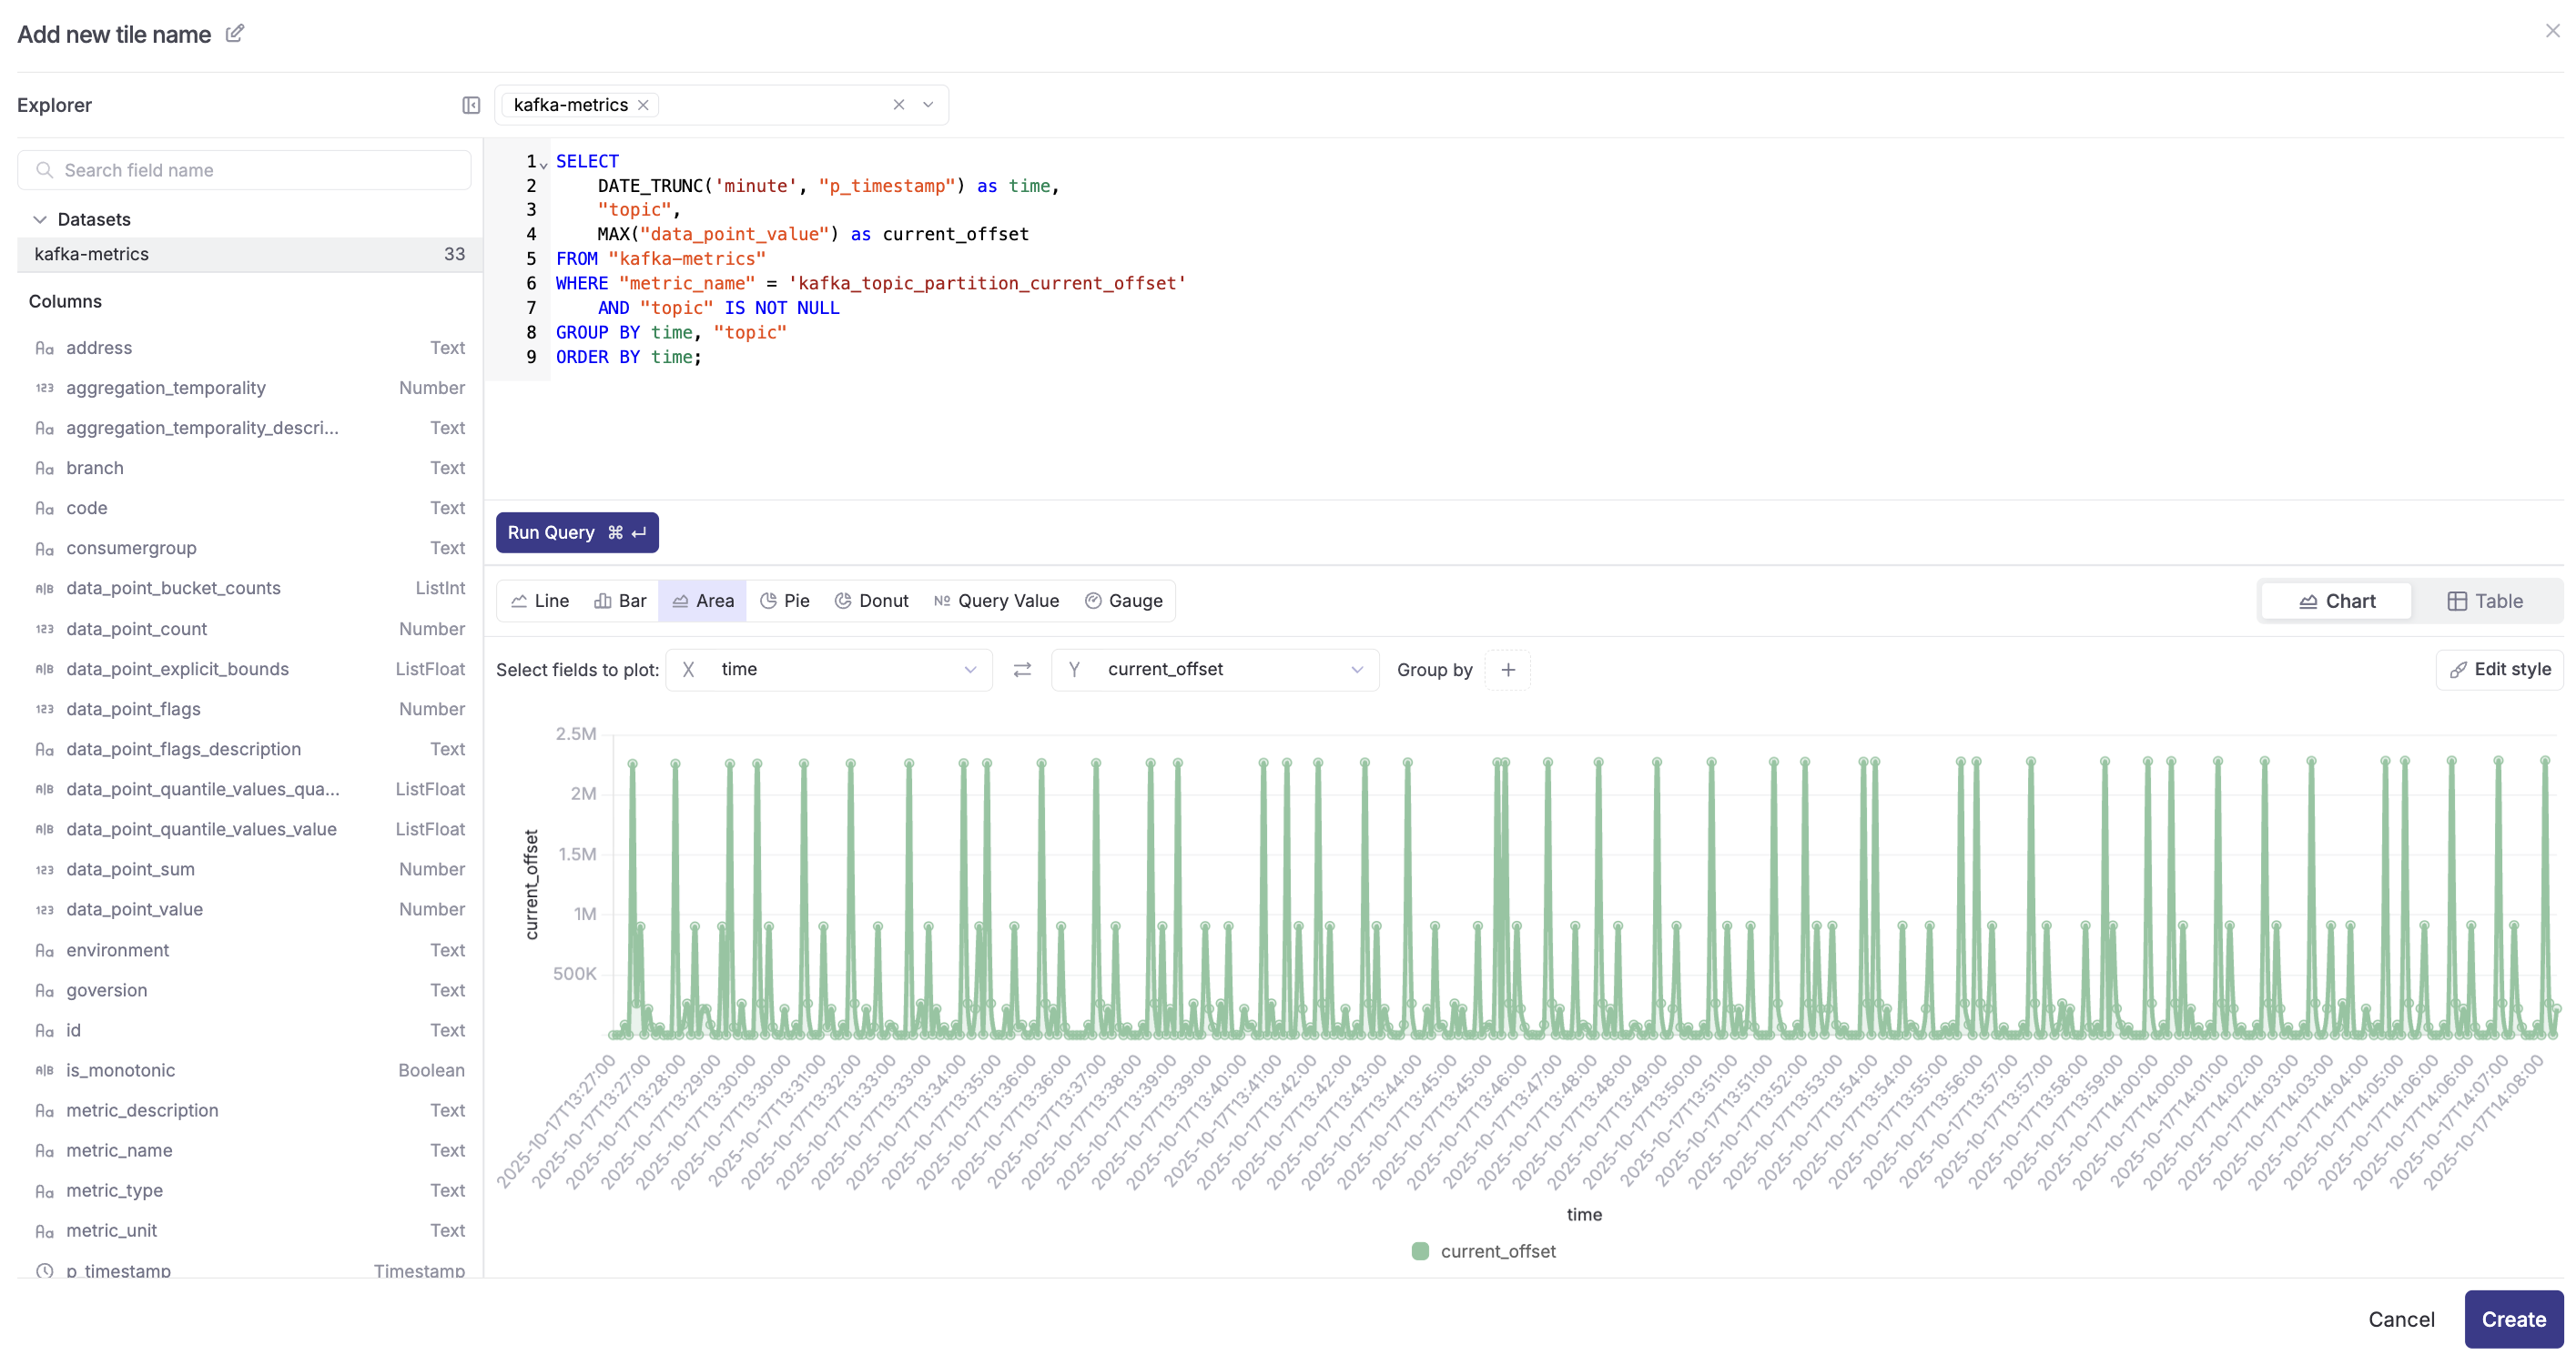
Panel 4: Message Throughput Over Time (Middle Row - Area Chart)
- Click "+Add Tile" and select "Create with SQL"
- Select "kafka-metrics" dataset
- Query:
SELECT
    DATE_TRUNC('minute', "p_timestamp") as time,
    "topic",
    MAX("data_point_value") as current_offset
FROM "kafka-metrics"
WHERE "metric_name" = 'kafka_topic_partition_current_offset'
    AND "p_timestamp" >= NOW() - INTERVAL '3' HOUR
    AND "topic" IS NOT NULL
GROUP BY time, "topic"
ORDER BY time;- Chart type: Area Chart
- Configure:
- X-axis:
time - Y-axis:
current_offset - Group by:
topic
- X-axis:
- Click Create
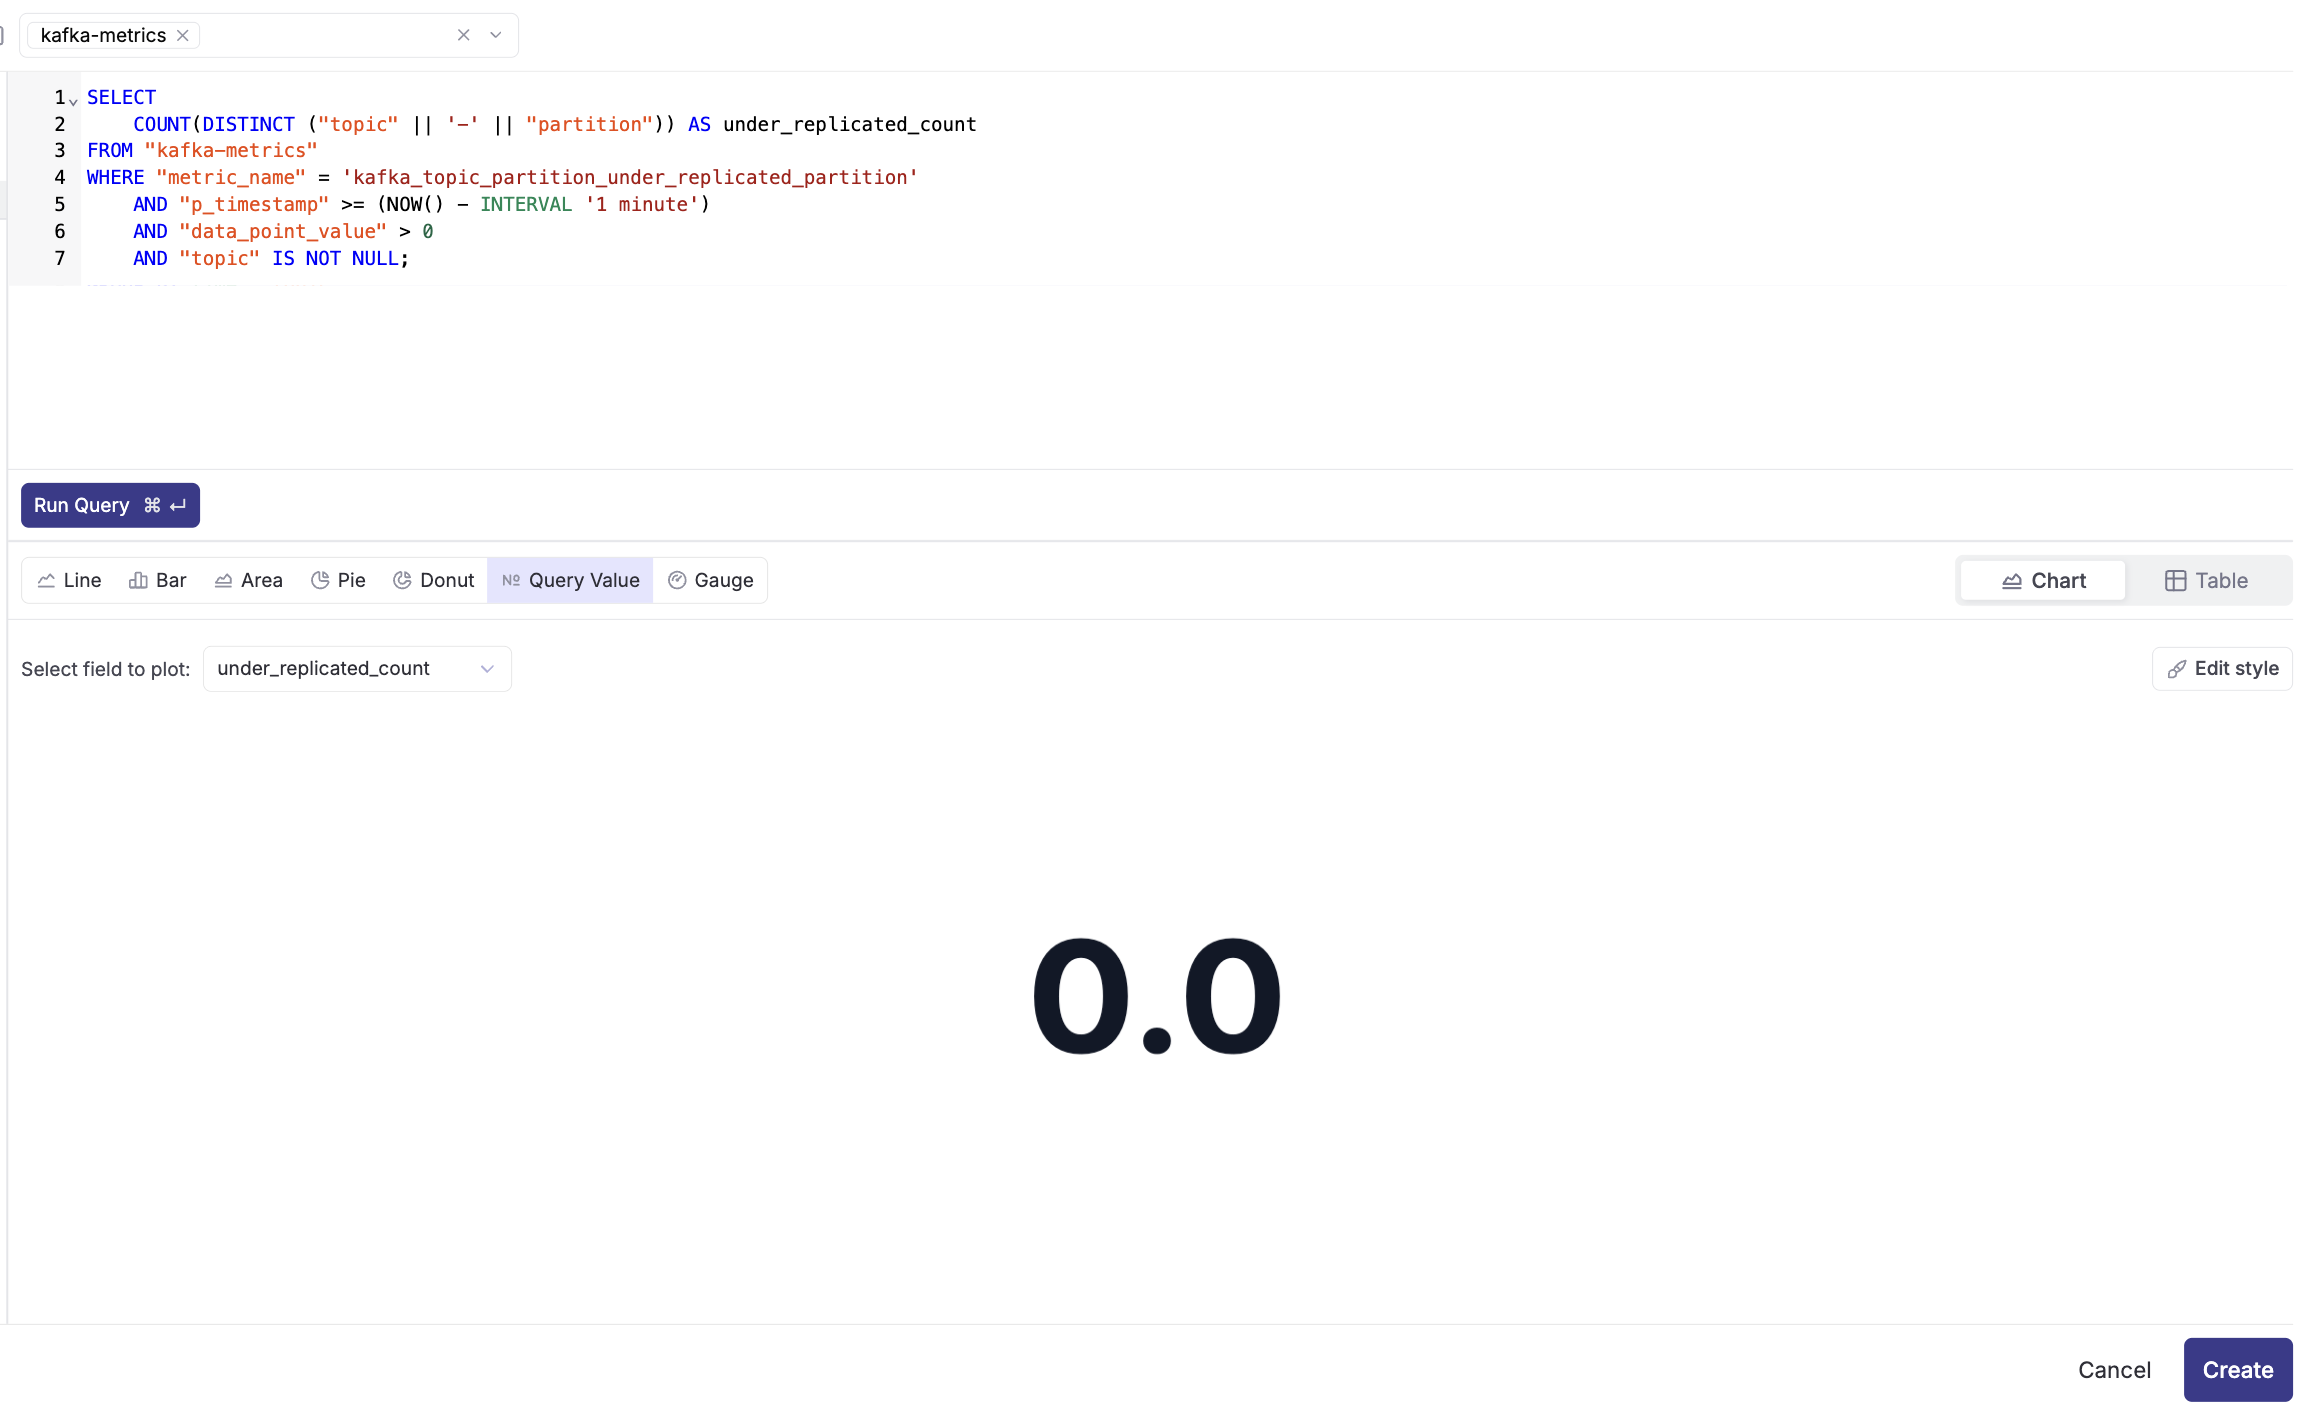
Panel 5: Under-Replicated Partitions Count (Bottom Row - Query Value)
- Click "+Add Tile" and select "Create with SQL"
- Select "kafka-metrics" dataset
- Query:
SELECT
    COUNT(DISTINCT ("topic" || '-' || "partition")) AS under_replicated_count
FROM "kafka-metrics"
WHERE "metric_name" = 'kafka_topic_partition_under_replicated_partition'
    AND "p_timestamp" >= (NOW() - INTERVAL '1 minute')
    AND "data_point_value" > 0
AND "topic" IS NOT NULL;- Chart type: Query Value
- Configure:
- Select Field to Plot:
under_replicated_count
- Select Field to Plot:
- Click Create
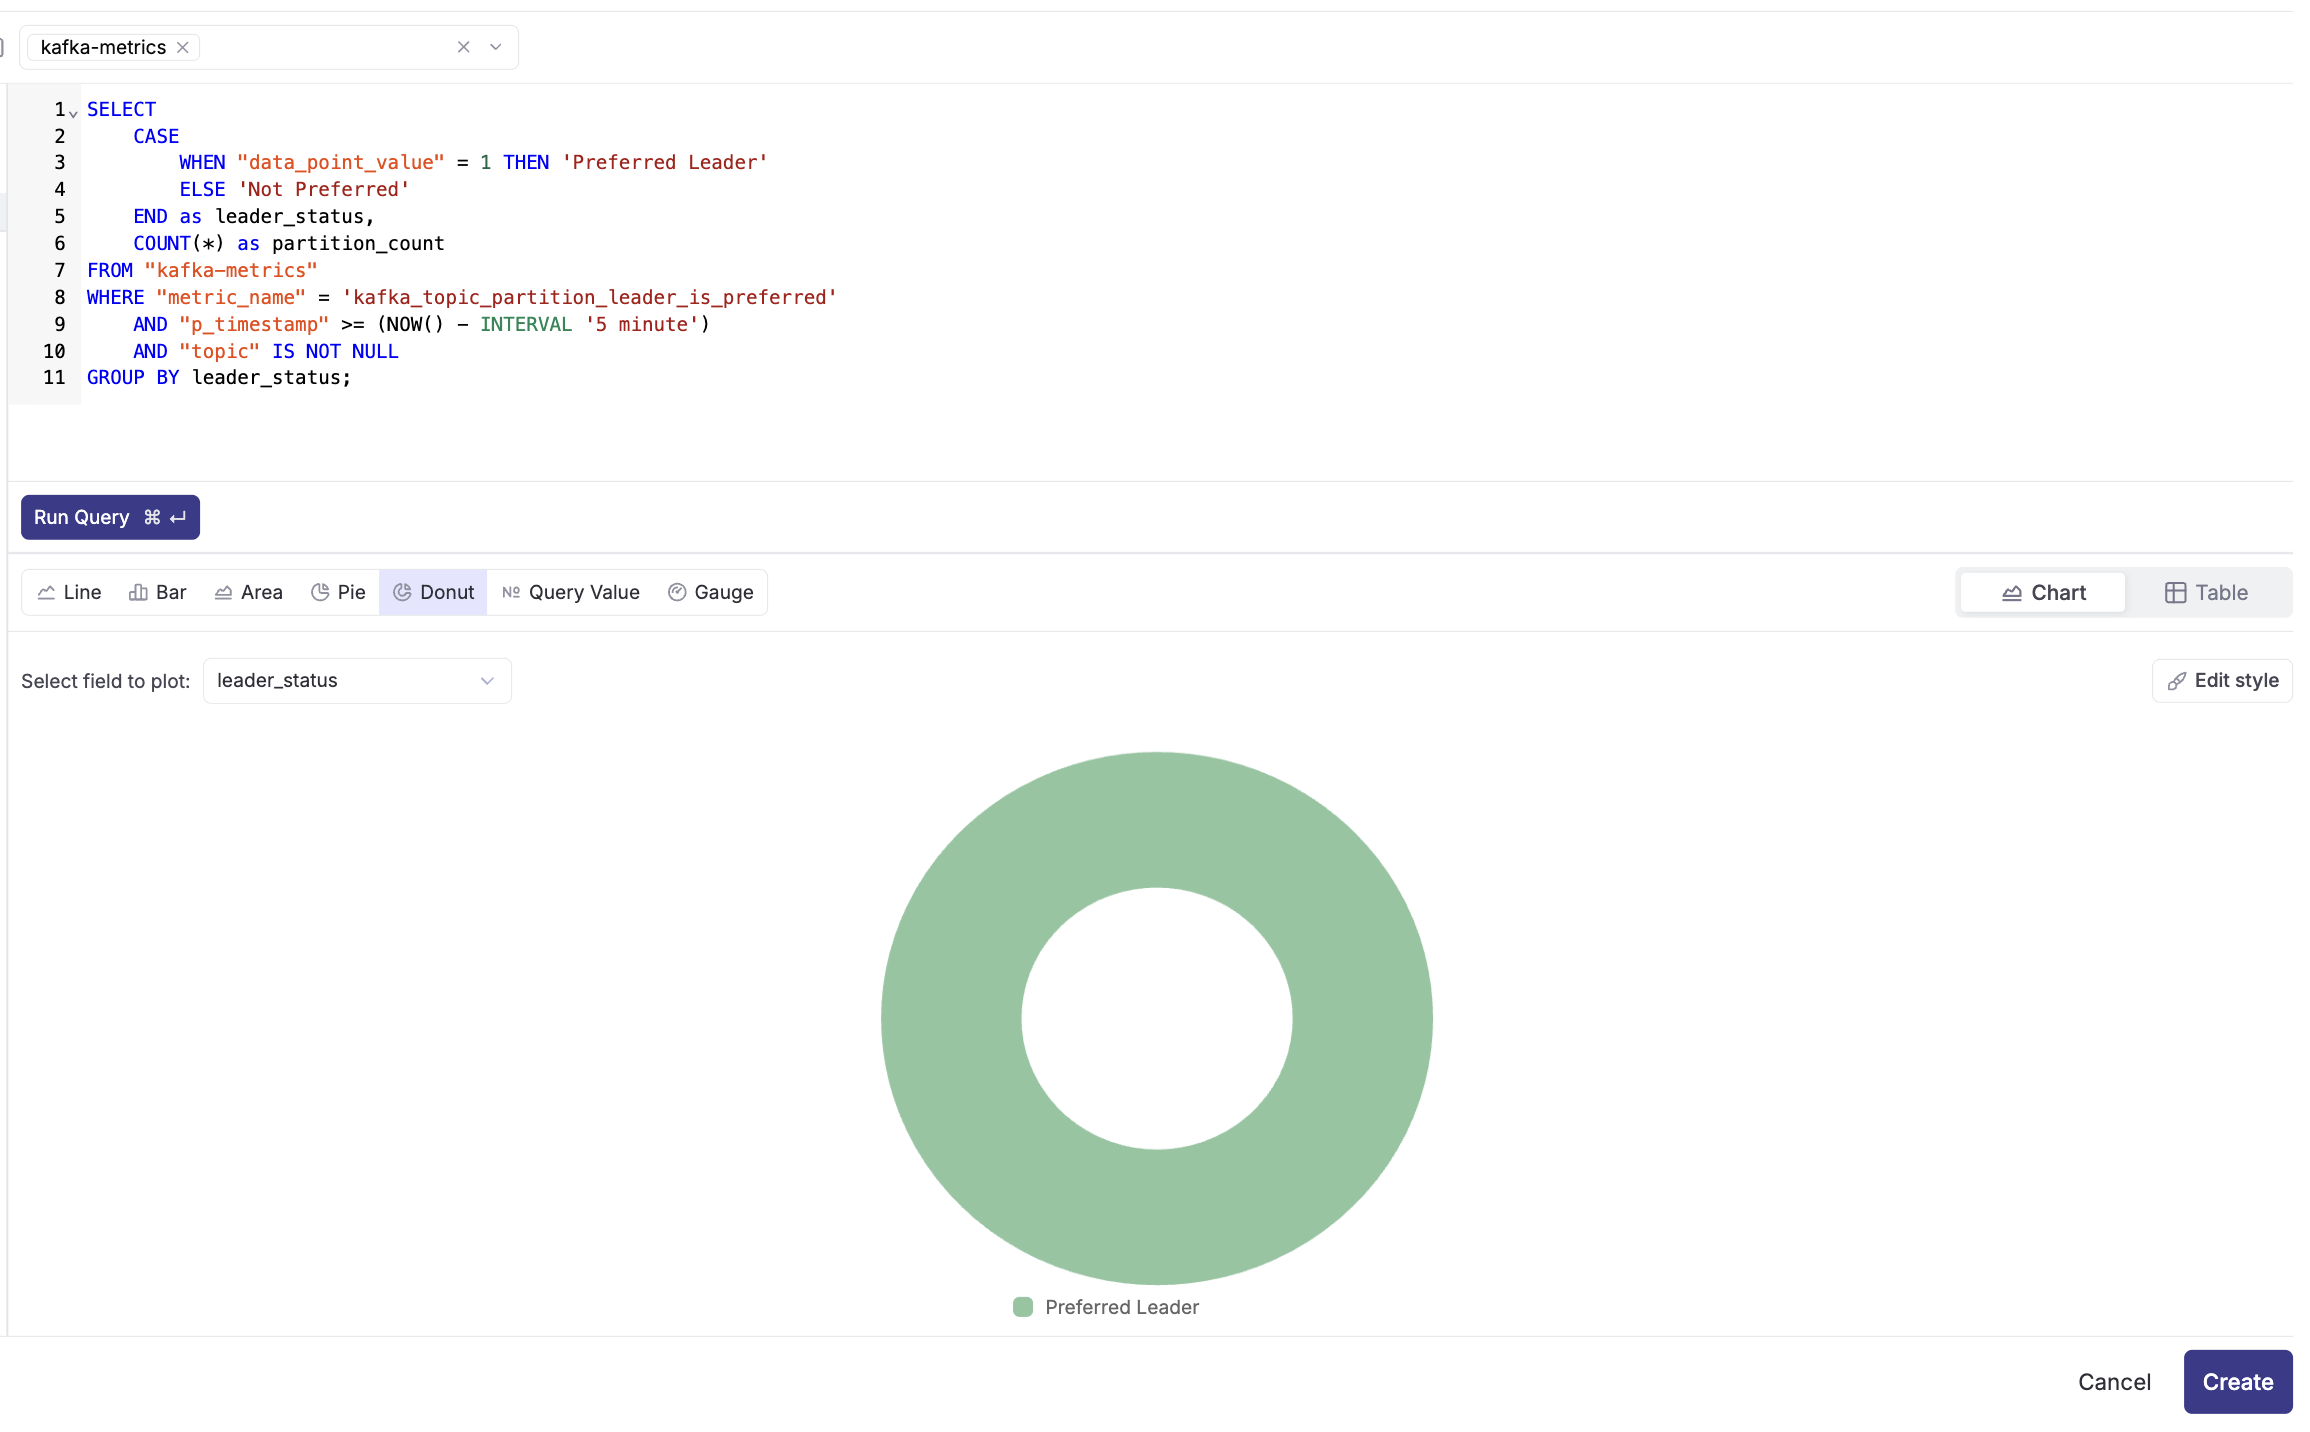
Panel 6: Partition Leader Status (Bottom Row - Donut Chart)
- Click "+Add Tile" and select "Create with SQL"
- Select "kafka-metrics" dataset
- Query:
SELECT
    CASE
        WHEN "data_point_value" = 1 THEN 'Preferred Leader'
        ELSE 'Not Preferred'
    END as leader_status,
    COUNT(*) as partition_count
FROM "kafka-metrics"
WHERE "metric_name" = 'kafka_topic_partition_leader_is_preferred'
    AND "p_timestamp" >= (NOW() - INTERVAL '5 minute')
    AND "topic" IS NOT NULL
GROUP BY leader_status;- Chart type: Donut Chart
- Configure:
- Select Field to Plot:
leader_status
- Select Field to Plot:
- Click Create
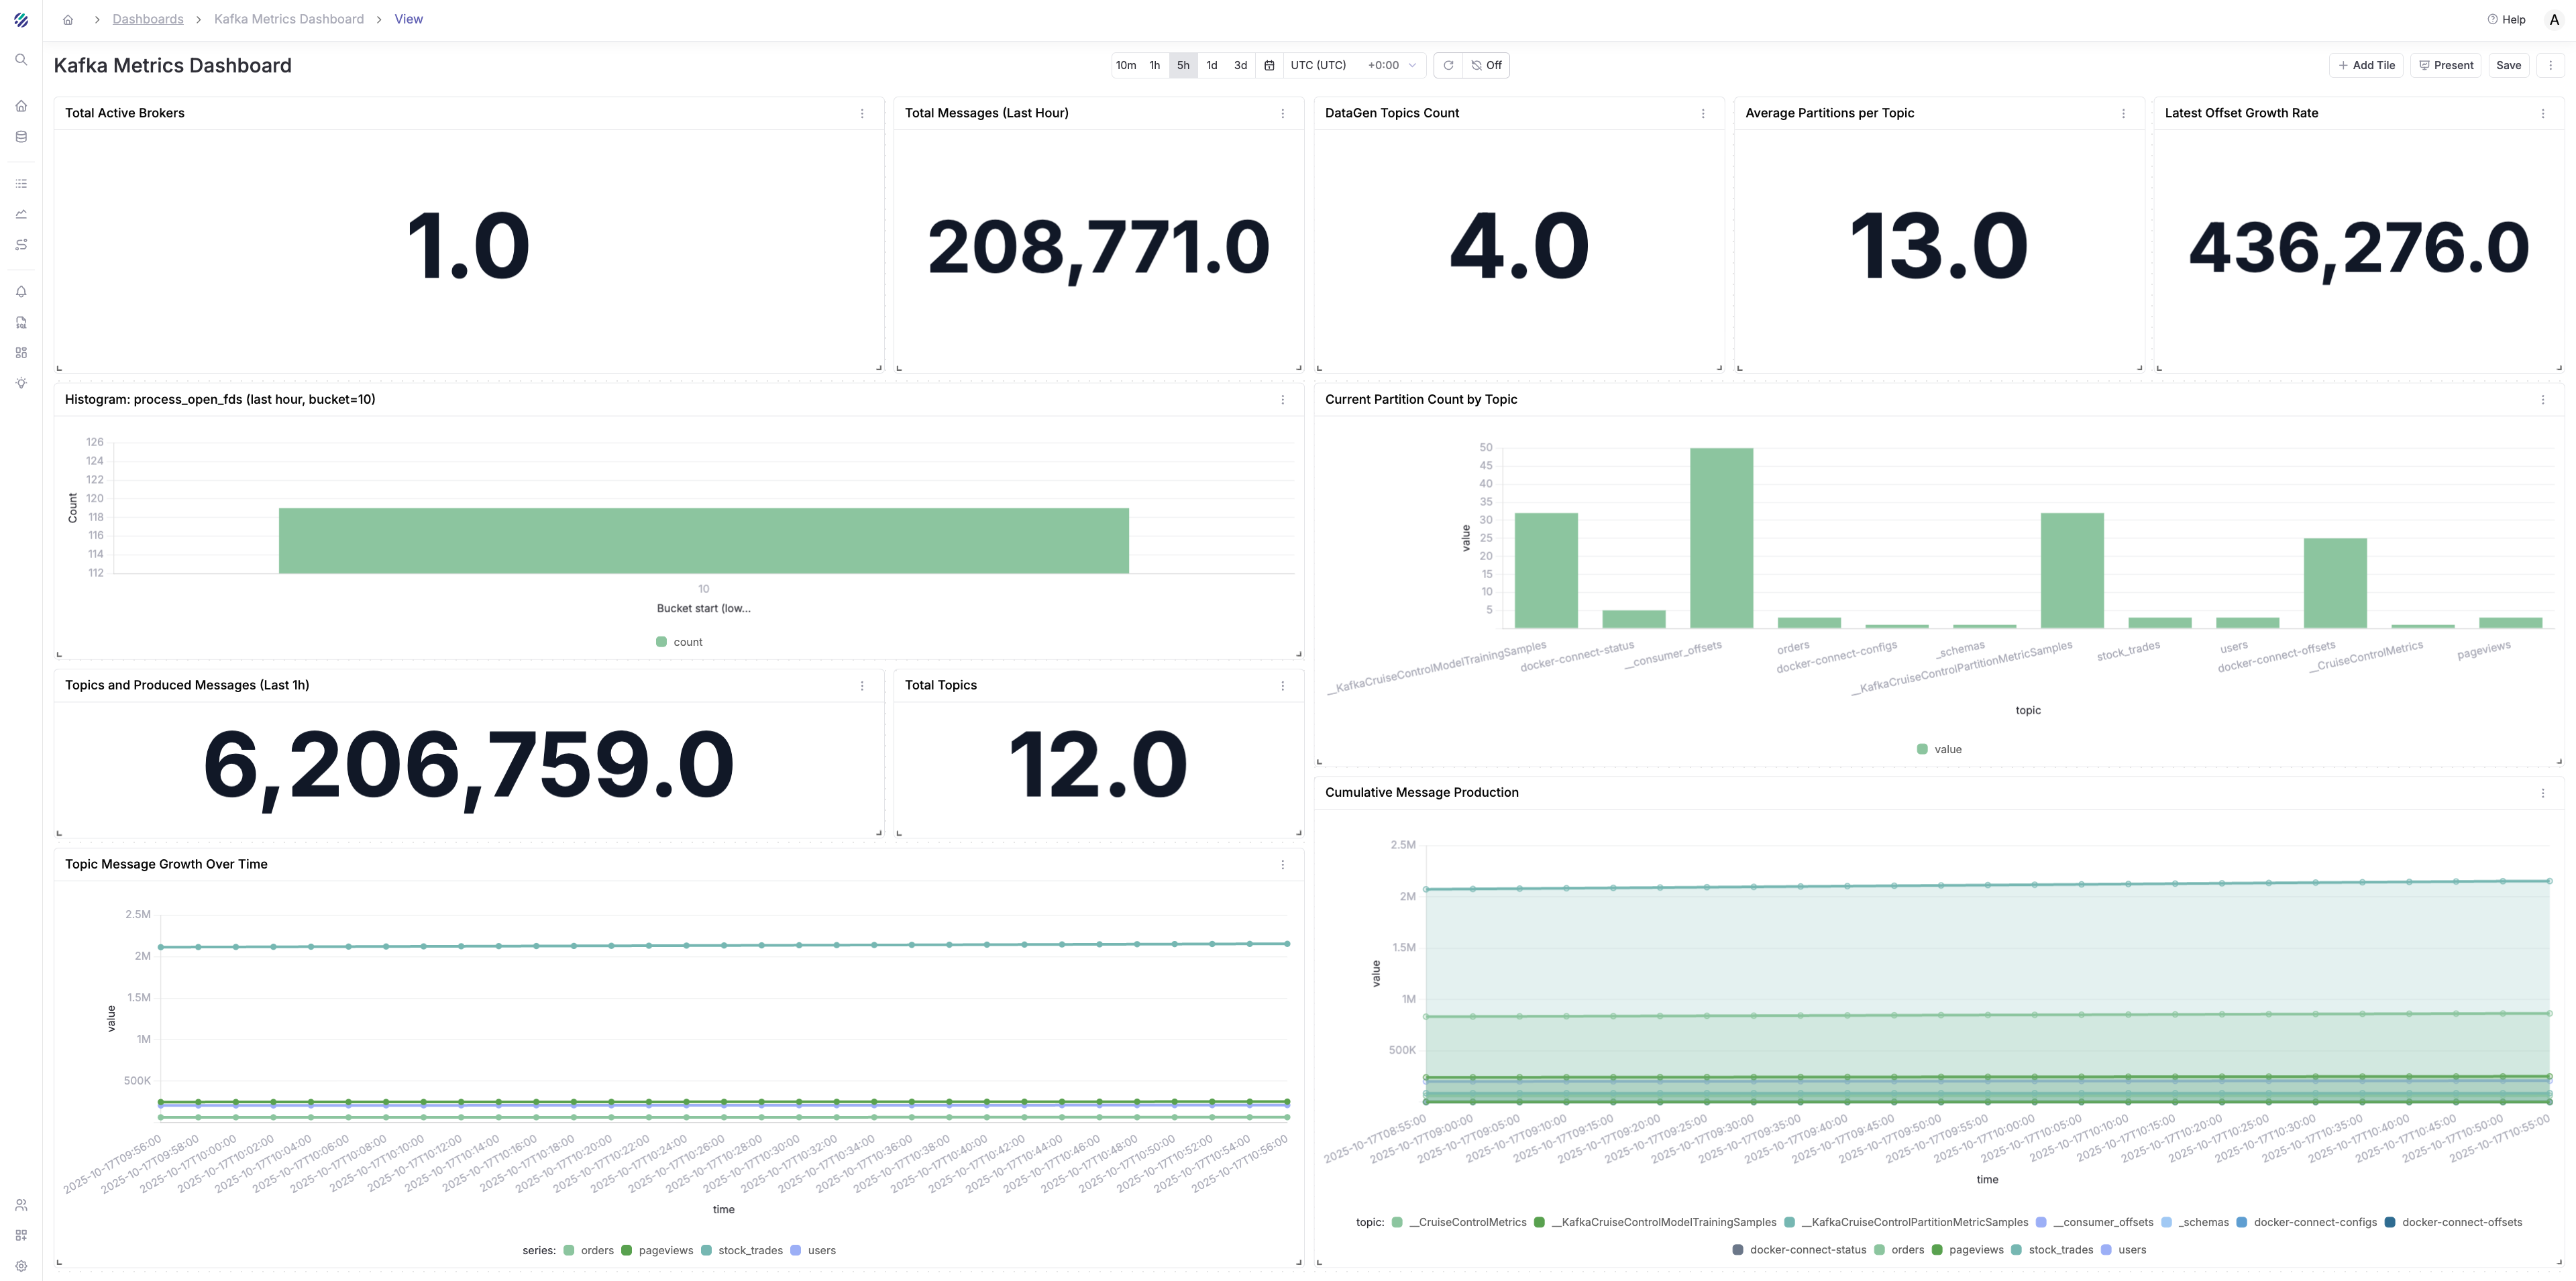
Final Dashboard
Setting Up Intelligent Alerts
Parseable provides three types of alerts to monitor your Kafka metrics: Threshold, Anomaly Detection, and Forecast. Let's set up one of each type.
Alert Type 1: Threshold Alert - Under-Replicated Partitions
Threshold alerts trigger when a metric crosses a specific value. This is ideal for monitoring critical conditions like under-replicated partitions.
Step 1: Set Rule
- Navigate to Alerts and click Create Alert
- Dataset: Select
kafka-metrics - Monitor: Select
All rows (*) - By: Select
COUNT - Filter (optional): Click + Add Filter
- Field:
metric_name - Operator:
= - Value:
kafka_topic_partition_under_replicated_partition - Add another filter:
- Field:
data_point_value - Operator:
> - Value:
0
- Field:
- Field:
- Group by (optional): Add
topicto group alerts by topic
Step 2: Set Evaluation
- Alert type: Select Threshold
- Evaluate the last:
10 minutes - Repeat evaluation every:
10 minutes - Trigger when result is:
> 0
Step 3: Set Targets
- Deliver notifications to: Add your notification channel (Email/Slack/Webhook)
- Repeat every:
10 minutes - Click Create Alert
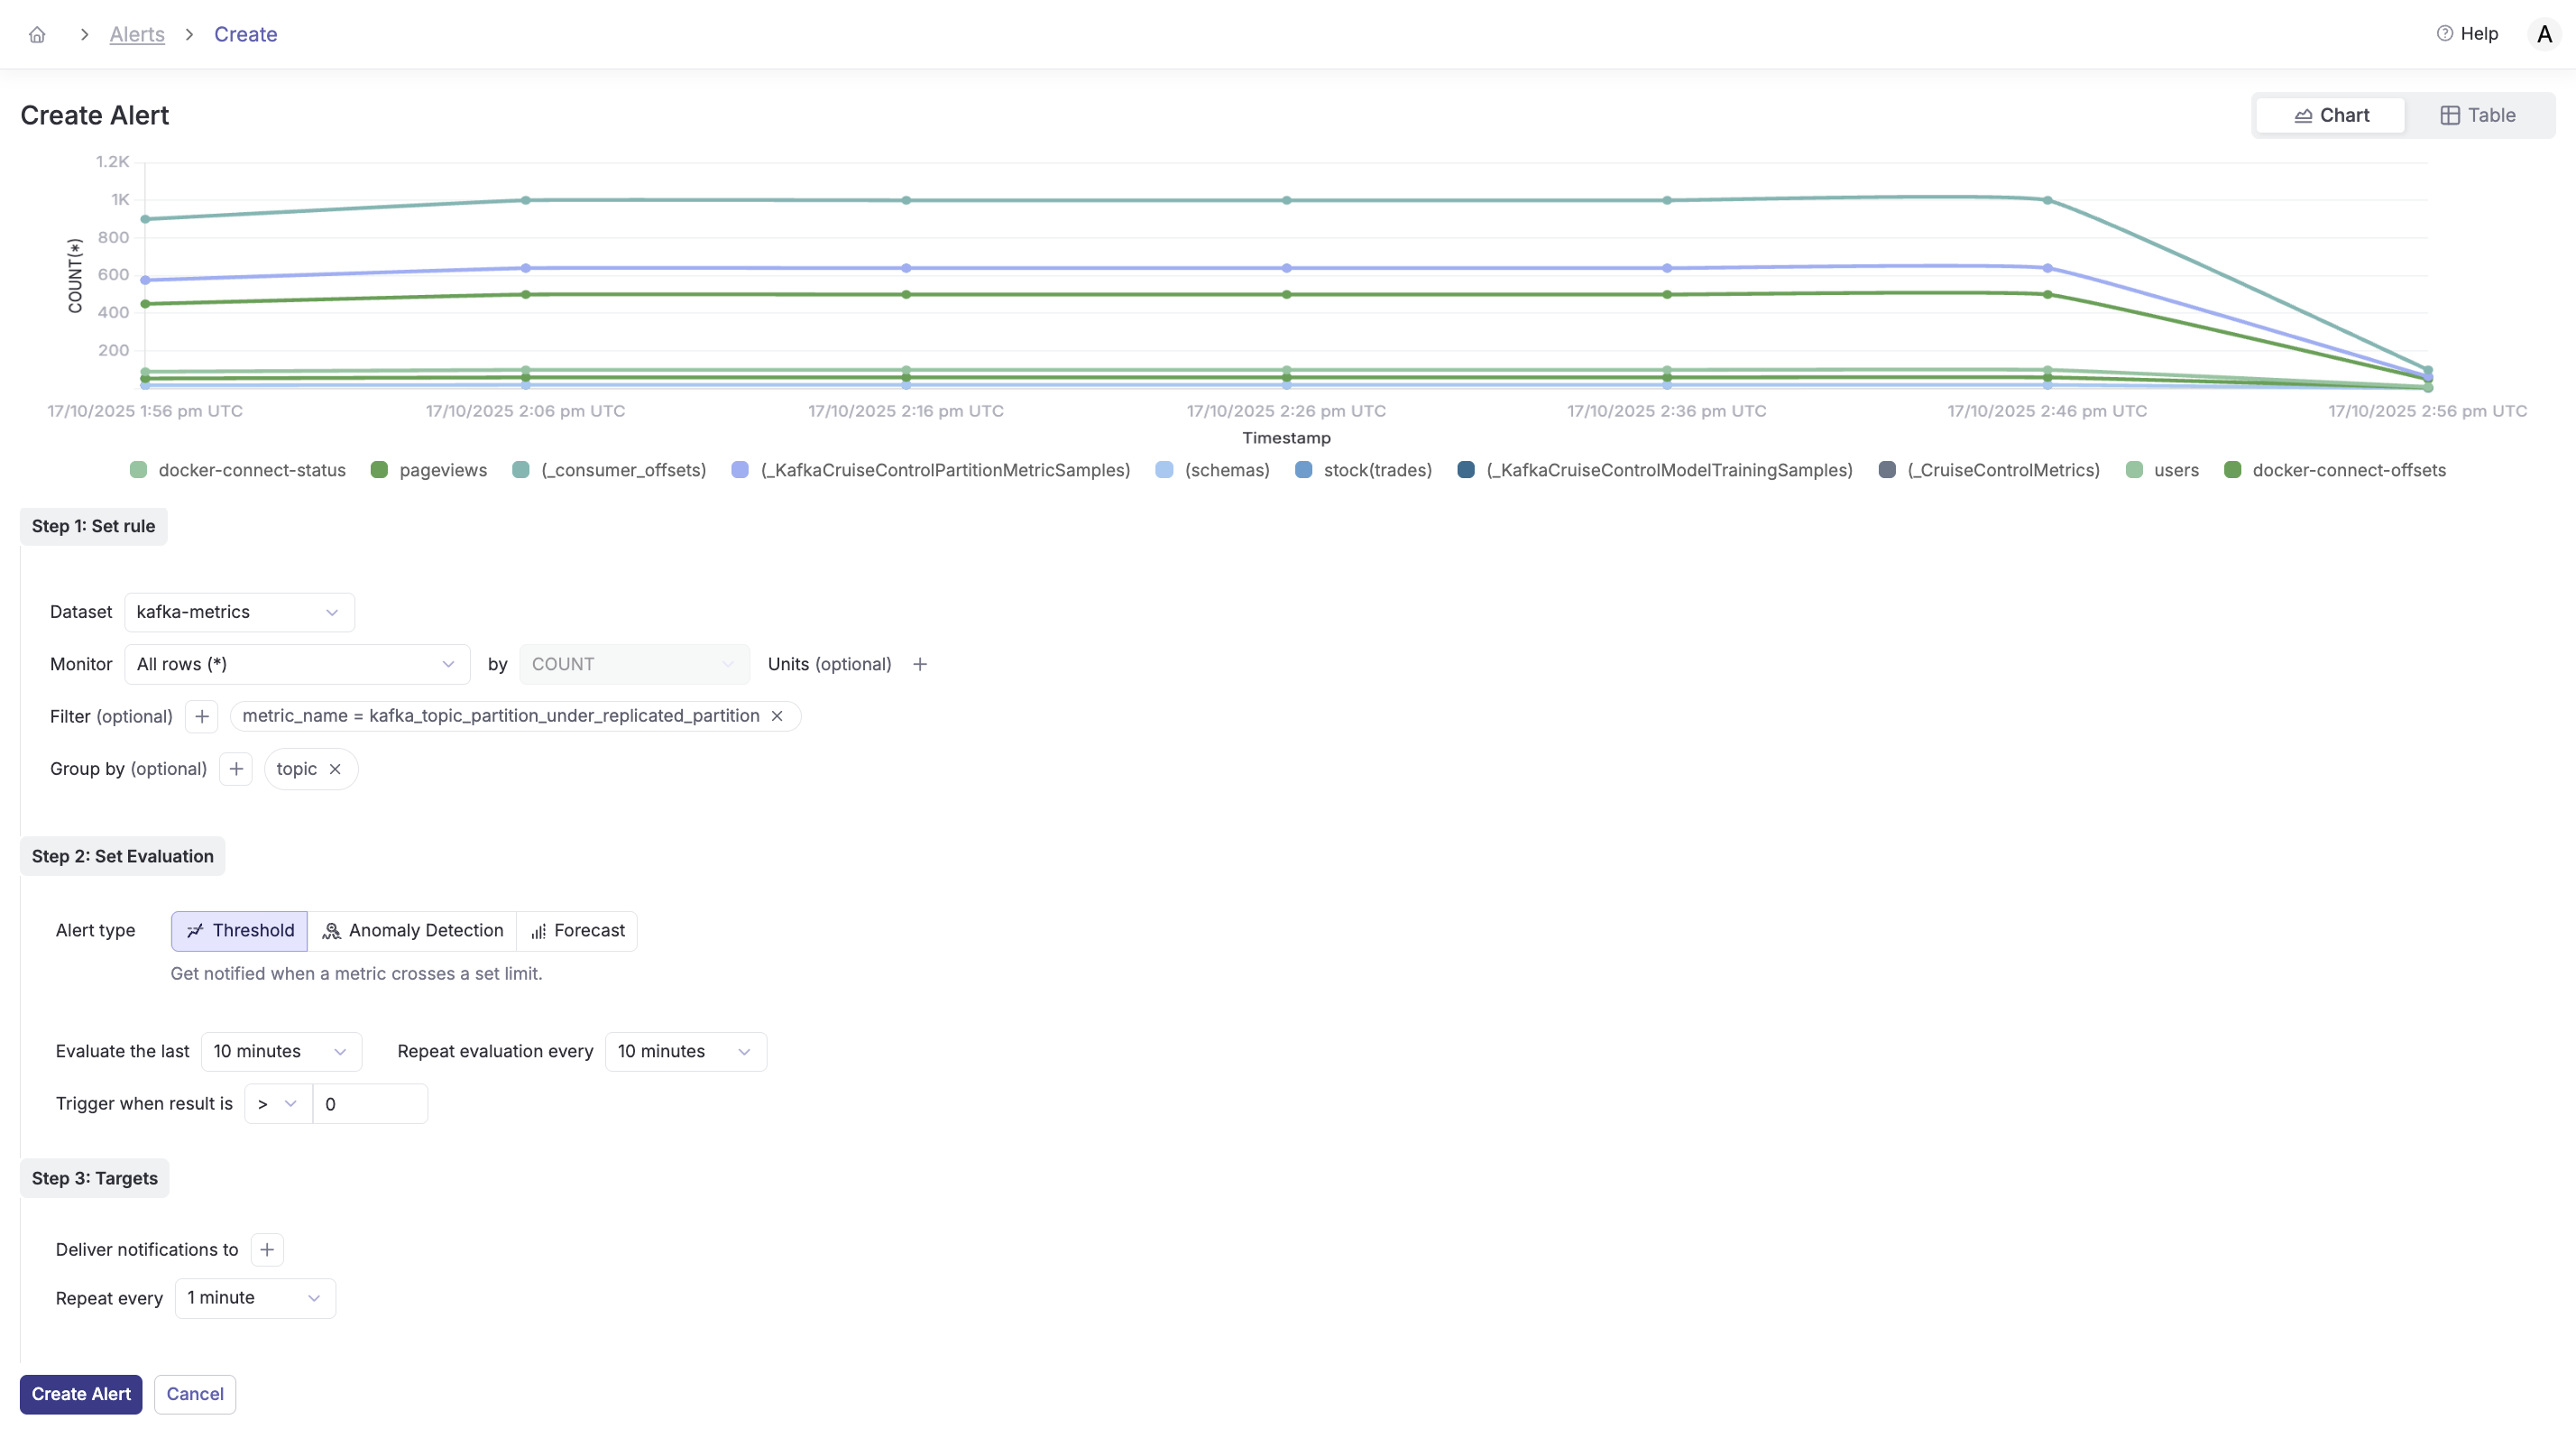
Use case: Get immediately notified when any partition loses replicas, which could lead to data loss.
Alert Type 2: Anomaly Detection - Unusual Partition Activity
Anomaly detection alerts use machine learning to detect unusual patterns in your metrics without setting specific thresholds.
Step 1: Set Rule
- Navigate to Alerts and click Create Alert
- Dataset: Select
kafka-metrics - Monitor: Select
All rows (*) - By: Select
COUNT - Filter (optional): Click + Add Filter
- Field:
metric_name - Operator:
= - Value:
kafka_topic_partition_oldest_offset
- Field:
- Group by (optional): Add
topicandpartition
Step 2: Set Evaluation
- Alert type: Select Anomaly Detection
- Evaluate the last:
30 minutes - Repeat evaluation every:
10 minutes - Parseable will automatically learn normal patterns and detect anomalies
Step 3: Set Targets
- Deliver notifications to: Add your notification channel
- Repeat every:
10 minutes - Click Create Alert
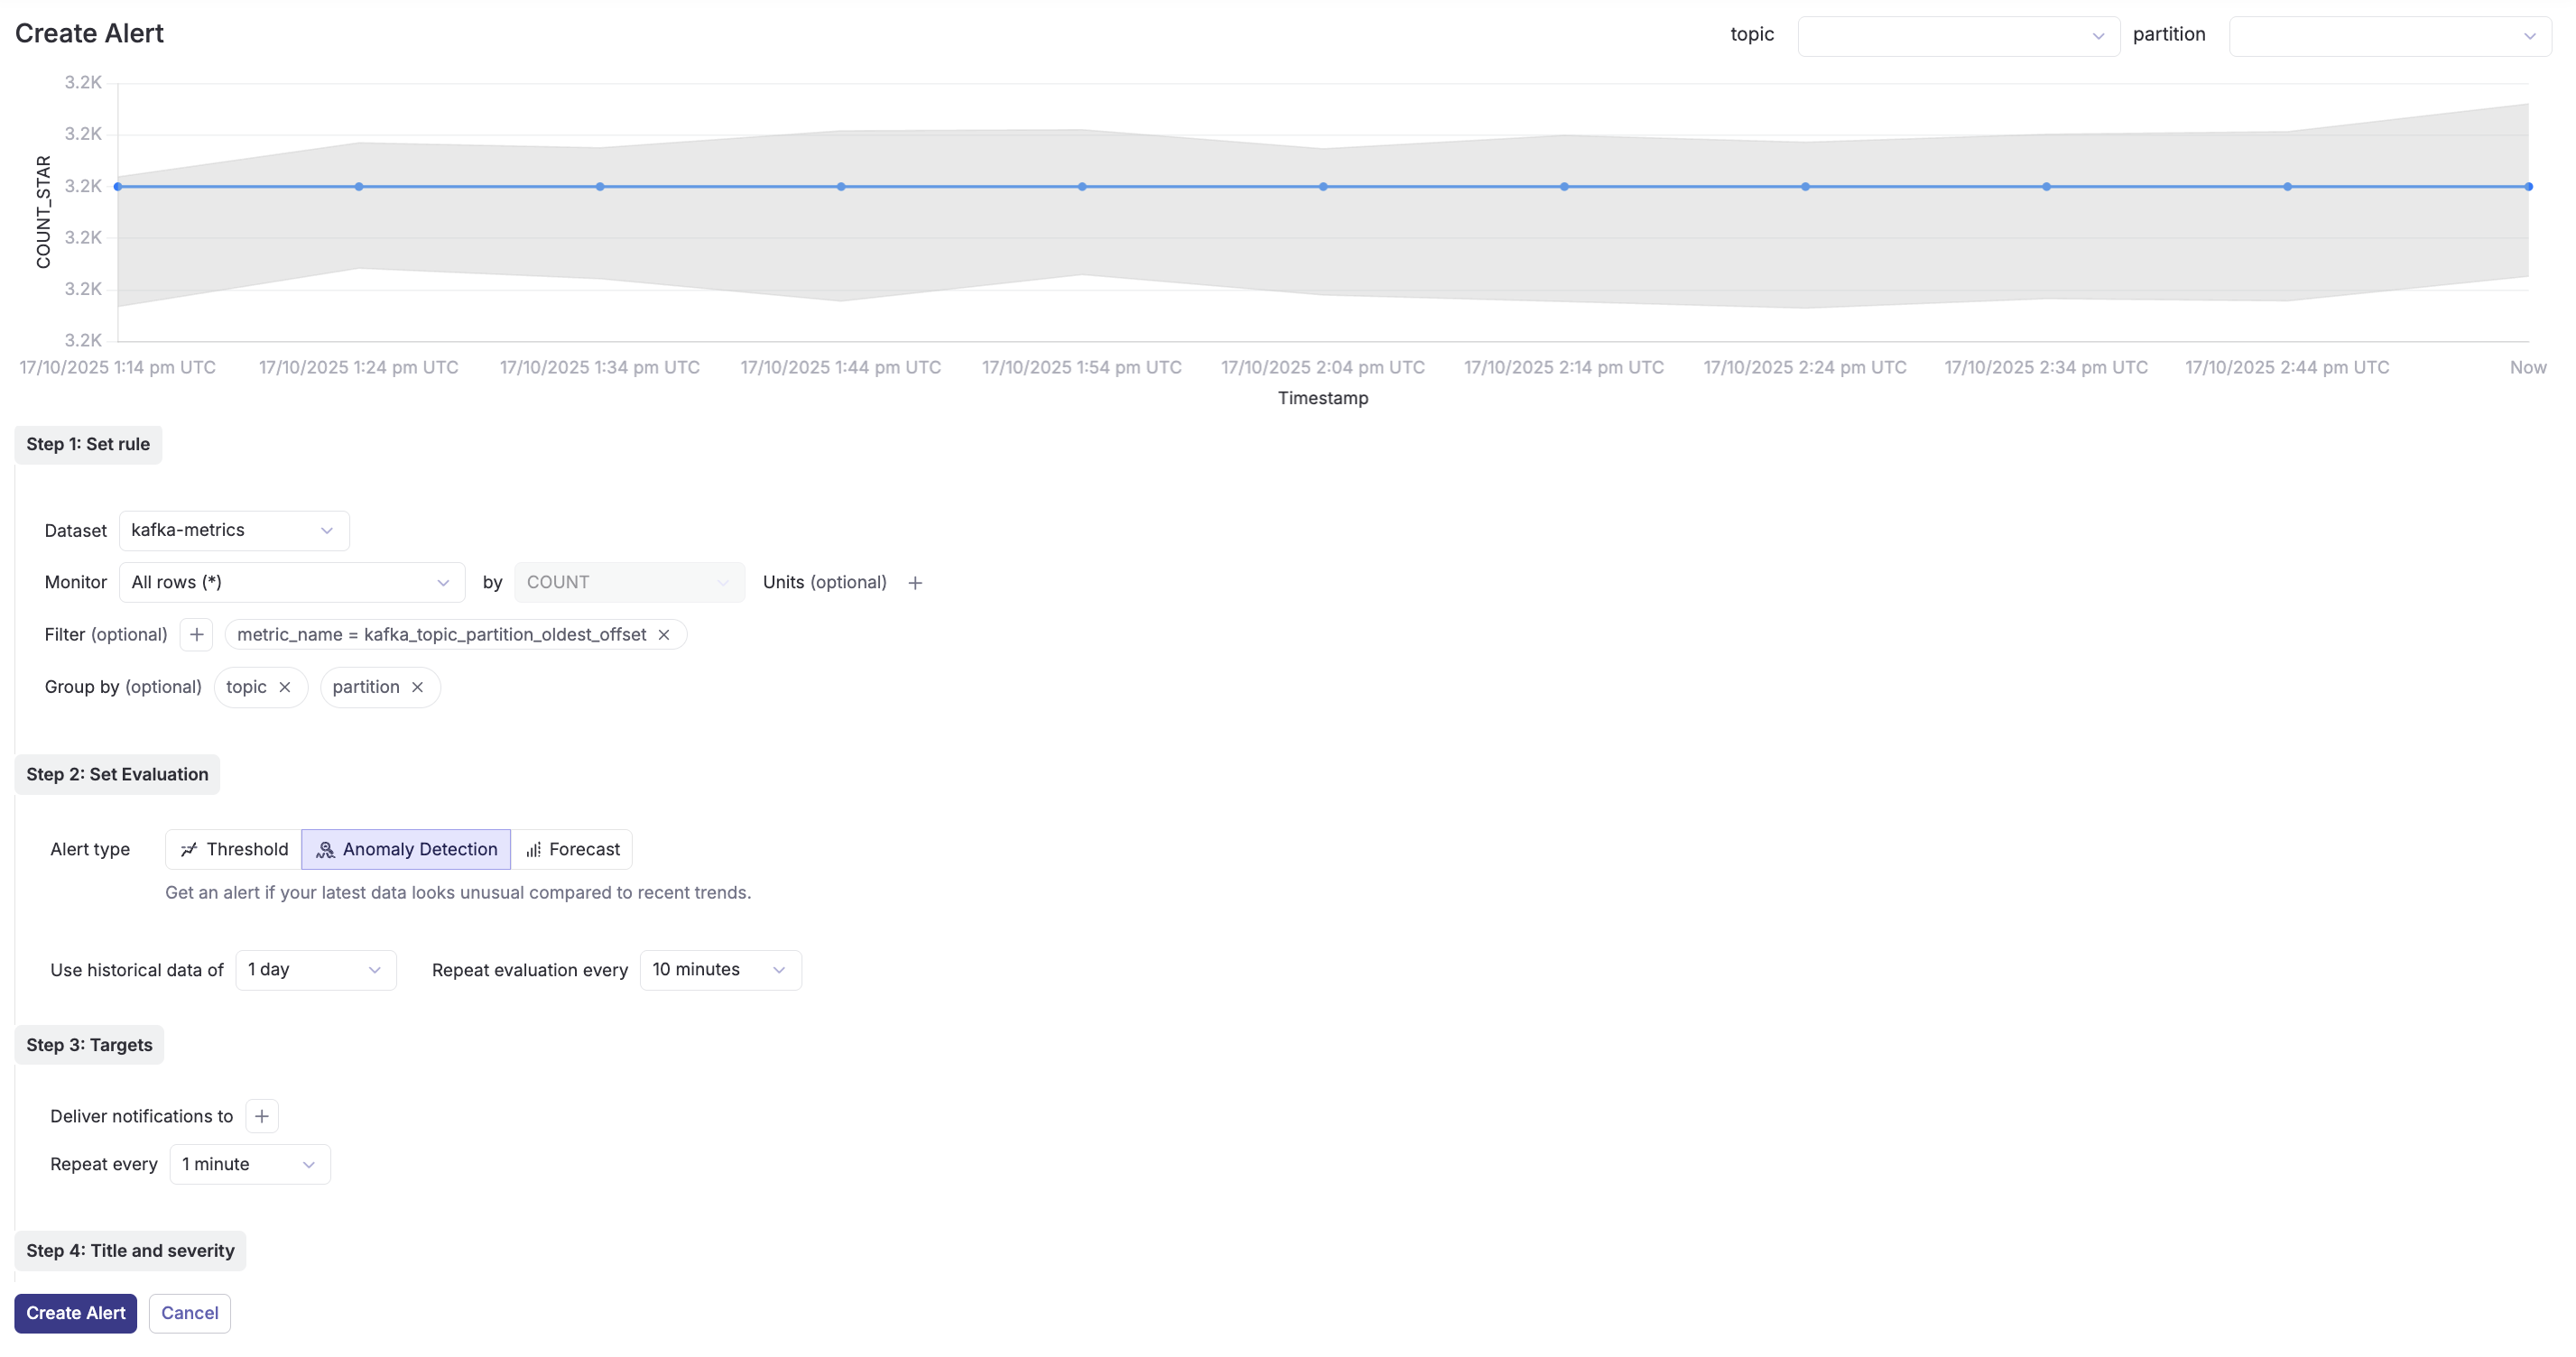
Use case: Detect unusual spikes or drops in partition activity that might indicate producer issues, broker problems, or unexpected traffic patterns.
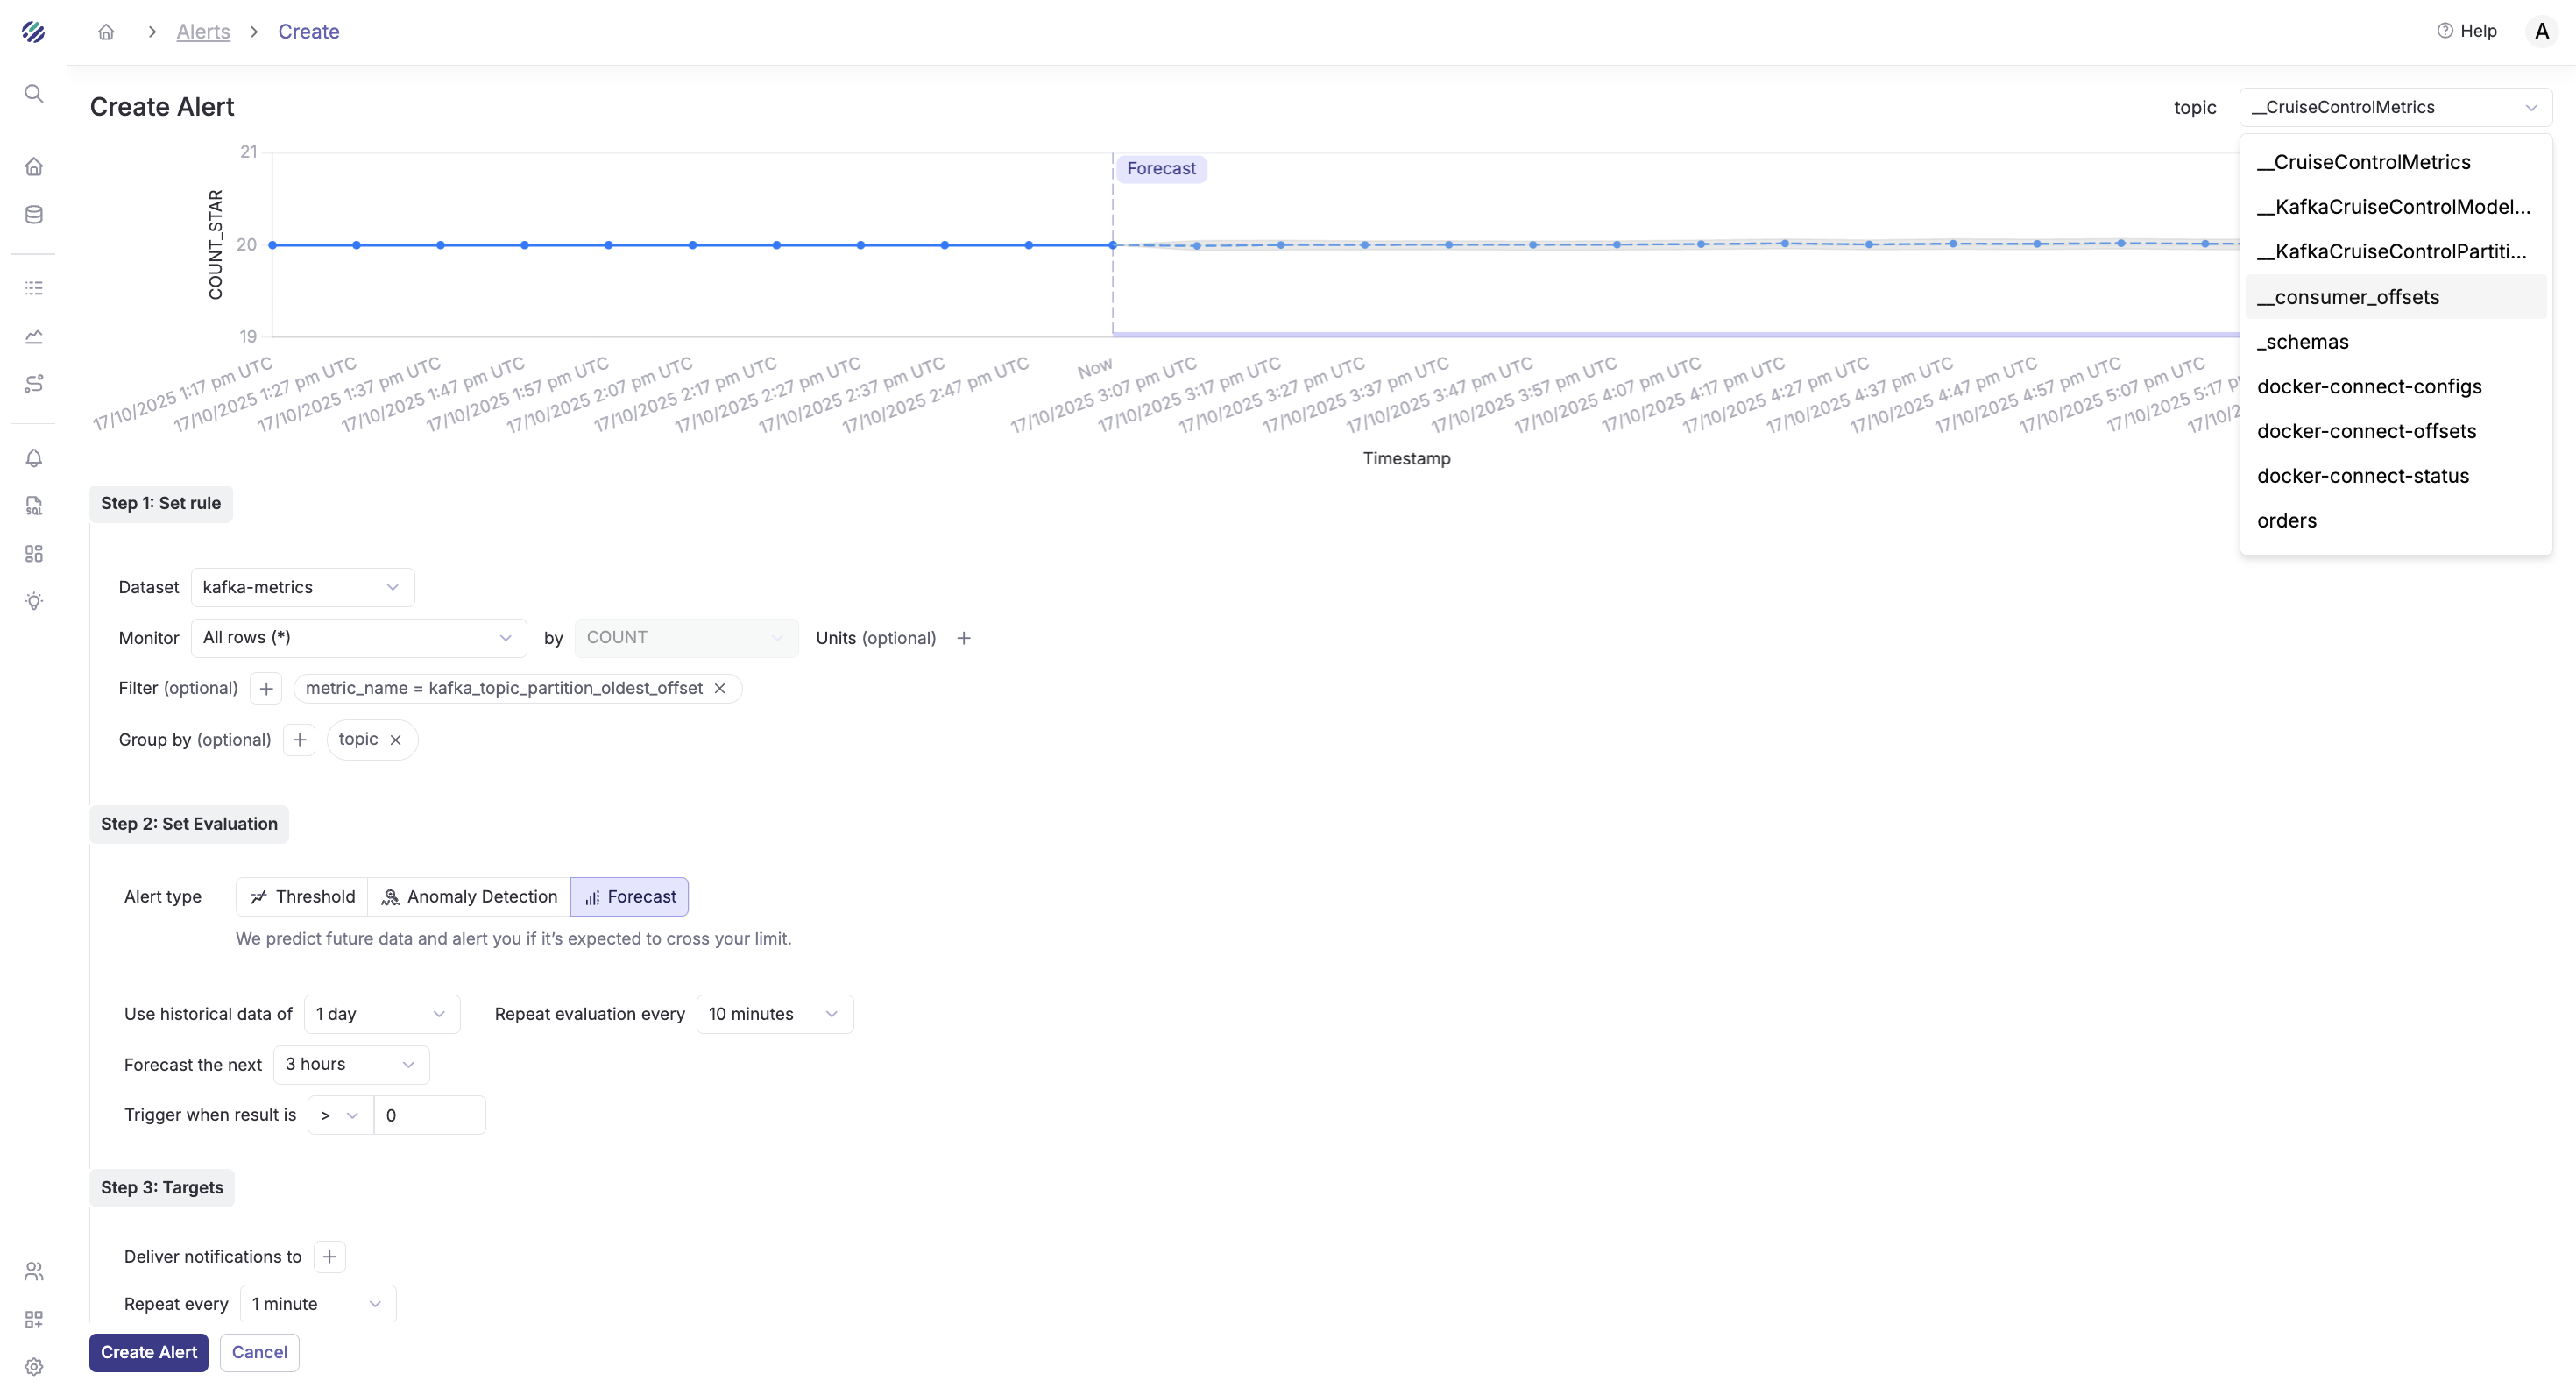
Alert Type 3: Forecast Alert - Predict Partition Growth Issues
Forecast alerts predict future metric values based on historical trends and alert you before problems occur.
Step 1: Set Rule
- Navigate to Alerts and click Create Alert
- Dataset: Select
kafka-metrics - Monitor: Select
All rows (*) - By: Select
MAX(data_point_value) - Filter (optional): Click + Add Filter
- Field:
metric_name - Operator:
= - Value:
kafka_topic_partition_oldest_offset
- Field:
- Group by (optional): Add
topic
Step 2: Set Evaluation
- Alert type: Select Forecast
- Evaluate the last:
1 hour(uses this data to predict future) - Repeat evaluation every:
15 minutes - Forecast horizon:
30 minutes(predicts 30 minutes ahead) - Trigger when forecasted value is: Set based on your capacity limits
Step 3: Set Targets
- Deliver notifications to: Add your notification channel
- Repeat every:
15 minutes - Click Create Alert
Use case: Proactively detect when partition offsets are growing at an unusual rate, allowing you to scale resources before issues occur.
Investigating Alerts with the Investigate Button
When an alert triggers, Parseable's Investigate feature helps you quickly understand the root cause.
How to Use the Investigate Feature
- When you receive an alert notification, click the Investigate button
- Parseable automatically redirects you to the explore page with appropriate filters applied.
Real-World Impact: Before and After
Before Parseable
Incident Response Time: 3-5 hours
- 30 minutes: Detect and mobilize team
- 90 minutes: Manual log analysis across multiple systems
- 60 minutes: Offset inspection and message examination
- 45 minutes: Root cause identification
- 15 minutes: Resolution
Team Involvement: 3-4 engineers (on-call, platform, application teams)
Visibility: Reactive, limited to what logs captured
After Parseable
Incident Response Time: 15-30 minutes
- 2 minutes: Alert triggers with context
- 5 minutes: Investigate button shows related metrics and trends
- 5 minutes: SQL queries pinpoint exact partition/consumer issue
- 3 minutes: Correlate with application logs
- 10 minutes: Resolution
Team Involvement: 1 engineer (on-call with full context)
Visibility: Proactive, comprehensive metrics and correlation
Conclusion
Kafka monitoring doesn't have to be a manual, time-consuming process. With Parseable and Kafka Exporter, you get the following:
- Complete visibility into consumer lag, partition health, and replication status
- Powerful querying with SQL for deep analysis
- Visual dashboards for real-time monitoring
- Intelligent alerts that notify you before issues escalate
- Fast investigation tools that reduce MTTR from hours to minutes
The combination of the Explore page for quick insights, SQL editor for deep analysis, customizable dashboards, and intelligent alerting creates a comprehensive monitoring solution that scales with your Kafka infrastructure.
Start monitoring your Kafka clusters with Parseable today and transform your operational efficiency.

