

When Your Kafka Consumer Goes Silent
It's 2 AM. Your Kafka consumer has stalled. Consumer lag is climbing into the millions. Customers are reporting delays. Your logs show nothing useful, and changing the log level requires a deployment approval that won't come until morning.
If you're operating Apache Kafka at scale, you know this scenario all too well. A consumer group stops progressing, and you're left playing detective with insufficient clues. The pressure builds as you manually dig through offsets, parse logs, and inspect messages, hoping to find the needle in the haystack before the business impact escalates.
This operational burden drains valuable engineering time that could be spent building features that matter.
Why Kafka Troubleshooting Takes So Long
The real challenge with Kafka operations isn't detecting that something broke—monitoring tools handle that well. The problem is answering the critical questions:
- Why did it break?
- When did it start?
- What changed?
- Who is impacted?
Consider the "poison pill" scenario as one of the most frustrating Kafka issues. A single malformed message brings an entire consumer group to its knees. These scenarios happen more often than you'd think:
- Schema evolution issues: Data format changes that break consumers
- Encoding problems: Character set mismatches or size violations
- Business logic failures: Messages that pass schema validation but fail processing
Even with a schema registry and strict enforcement, you're not protected against semantic errors or application-level processing failures that occur after successful deserialization.
Traditional debugging requires manually hunting through logs, inspecting offsets, and examining messages one by one, a process that can take hours for topics with millions of messages.
Comprehensive Kafka Monitoring with Parseable
This is a two-part tutorial that shows you how to set up complete Kafka monitoring using Parseable and Kafka Exporter. You'll learn to:
- Export Kafka metrics using Kafka Exporter to Parseable
- Explore your data with simple filters and group-by operations
In Part 2 of this tutorial, we'll explore the following:
- Query metrics using SQL for deep analysis
- Build visualizations and dashboards for real-time monitoring
- Set up intelligent alerts and investigate issues when they occur
By the end, you'll have a production-ready Kafka monitoring solution that reduces troubleshooting time from hours to minutes.
Prerequisites
Before we begin, ensure you have:
- A running Kafka cluster (Apache Kafka, MSK, or Confluent Cloud)
- An agent to collect metrics from Kafka Exporter and send them to Parseable
- Parseable instance (local, cloud, or self-hosted)
- Docker and Docker Compose installed
- Basic familiarity with Kafka concepts (topics, partitions, consumer groups)
Step 1: Setting Up the Complete Kafka Monitoring Stack
We'll set up a complete Kafka environment with Kafka Exporter to expose metrics and Fluent Bit to collect and forward them to Parseable.
Architecture Overview
The monitoring pipeline consists of:
- Kafka Cluster: Apache Kafka with KRaft mode (no Zookeeper needed)
- Schema Registry: For schema management
- Kafka Connect: For data integration (with Datagen connector for demo data)
- Kafka Exporter: Exposes Kafka metrics in Prometheus format
- Fluent Bit: Collects metrics from Kafka Exporter and sends to Parseable
Create the Docker Compose File
Create a docker-compose.yml file with the complete stack:
networks:
  kafka-network:
    driver: bridge

services:
  kafka:
    image: apache/kafka:3.8.0
    hostname: kafka
    container_name: kafka
    networks:
      - kafka-network
    ports:
      - "9092:9092"
      - "9093:9093"
      - "9999:9999"
    environment:
      KAFKA_NODE_ID: 1
      KAFKA_PROCESS_ROLES: 'broker,controller'
      KAFKA_CONTROLLER_QUORUM_VOTERS: '1@kafka:9093'
      KAFKA_LISTENERS: 'PLAINTEXT://kafka:29092,CONTROLLER://kafka:9093,PLAINTEXT_HOST://0.0.0.0:9092'
      KAFKA_ADVERTISED_LISTENERS: 'PLAINTEXT://kafka:29092,PLAINTEXT_HOST://localhost:9092'
      KAFKA_LISTENER_SECURITY_PROTOCOL_MAP: 'CONTROLLER:PLAINTEXT,PLAINTEXT:PLAINTEXT,PLAINTEXT_HOST:PLAINTEXT'
      KAFKA_CONTROLLER_LISTENER_NAMES: 'CONTROLLER'
      KAFKA_INTER_BROKER_LISTENER_NAME: 'PLAINTEXT'
      KAFKA_OFFSETS_TOPIC_REPLICATION_FACTOR: 1
      KAFKA_TRANSACTION_STATE_LOG_REPLICATION_FACTOR: 1
      KAFKA_TRANSACTION_STATE_LOG_MIN_ISR: 1
      KAFKA_GROUP_INITIAL_REBALANCE_DELAY_MS: 0
      KAFKA_AUTO_CREATE_TOPICS_ENABLE: 'true'
      KAFKA_JMX_PORT: 9999
      KAFKA_JMX_HOSTNAME: kafka
      CLUSTER_ID: 'MkU3OEVBNTcwNTJENDM2Qk'

  schema-registry:
    image: confluentinc/cp-schema-registry:7.6.0
    hostname: schema-registry
    container_name: schema-registry
    networks:
      - kafka-network
    depends_on:
      - kafka
    ports:
      - "8081:8081"
    environment:
      SCHEMA_REGISTRY_HOST_NAME: schema-registry
      SCHEMA_REGISTRY_KAFKASTORE_BOOTSTRAP_SERVERS: 'kafka:29092'
      SCHEMA_REGISTRY_LISTENERS: http://0.0.0.0:8081

  kafka-connect:
    image: confluentinc/cp-kafka-connect:7.6.0
    hostname: kafka-connect
    container_name: kafka-connect
    networks:
      - kafka-network
    depends_on:
      - kafka
      - schema-registry
    ports:
      - "8083:8083"
    environment:
      CONNECT_BOOTSTRAP_SERVERS: 'kafka:29092'
      CONNECT_REST_ADVERTISED_HOST_NAME: kafka-connect
      CONNECT_GROUP_ID: compose-connect-group
      CONNECT_CONFIG_STORAGE_TOPIC: docker-connect-configs
      CONNECT_CONFIG_STORAGE_REPLICATION_FACTOR: 1
      CONNECT_OFFSET_STORAGE_TOPIC: docker-connect-offsets
      CONNECT_OFFSET_STORAGE_REPLICATION_FACTOR: 1
      CONNECT_STATUS_STORAGE_TOPIC: docker-connect-status
      CONNECT_STATUS_STORAGE_REPLICATION_FACTOR: 1
      CONNECT_KEY_CONVERTER: org.apache.kafka.connect.storage.StringConverter
      CONNECT_VALUE_CONVERTER: io.confluent.connect.avro.AvroConverter
      CONNECT_VALUE_CONVERTER_SCHEMA_REGISTRY_URL: http://schema-registry:8081
      CONNECT_PLUGIN_PATH: "/usr/share/java,/usr/share/confluent-hub-components"
      # Disable JMX for Connect to avoid port conflict
      KAFKA_JMX_OPTS: " "
    command:
      - bash
      - -c
      - |
        confluent-hub install --no-prompt confluentinc/kafka-connect-datagen:latest
        /etc/confluent/docker/run

  kafka-exporter:
    image: danielqsj/kafka-exporter:v1.6.0
    hostname: kafka-exporter
    container_name: kafka-exporter
    networks:
      - kafka-network
    ports:
      - "9308:9308"
    command:
      - '--kafka.server=kafka:29092'
      - '--web.listen-address=:9308'
      - '--log.level=info'
    depends_on:
      - kafka

  fluent-bit:
    image: fluent/fluent-bit:3.0.7
    hostname: fluent-bit
    container_name: fluent-bit
    networks:
      - kafka-network
    ports:
      - "2020:2020"
    volumes:
      - ./fluent-bit.conf:/fluent-bit/etc/fluent-bit.conf:ro
      - ./parsers.conf:/fluent-bit/etc/parsers.conf:ro
    environment:
      - FLB_LOG_LEVEL=info
    depends_on:
      - kafka-exporter
    extra_hosts:
      - "host.docker.internal:host-gateway"
Configure Fluent Bit to Collect and Send Metrics
Create a fluent-bit.conf file to scrape metrics from Kafka Exporter and send them to Parseable:
[SERVICE]
    Flush        5
    Daemon       Off
    Log_Level    info
    Parsers_File parsers.conf

[INPUT]
    Name              prometheus_scrape
    Host              kafka-exporter
    Port              9308
    Tag               kafka_metrics
    Scrape_Interval   30s

[OUTPUT]
    Name              opentelemetry
    Match             kafka_metrics
    Host              your-parseable-instance.com
    Port              443
    URI               /v1/metrics
    Format            json
    Header            Authorization Basic <your-base64-encoded-credentials>
    Header            X-P-Stream kafka_metrics
    tls               On
    tls.verify        On
    Retry_Limit       3
Configuration Breakdown:
- INPUT: Scrapes Prometheus metrics from Kafka Exporter every 30 seconds
- OUTPUT: Sends metrics to Parseable via HTTP
- Replace
your-parseable-instance.comwith your Parseable host - Replace
<your-base64-encoded-credentials>with base64-encodedusername:password X-P-Streamheader specifies the stream name in Parseable
- Replace
Create Parsers Configuration
Create a parsers.conf file (required by Fluent Bit):
[PARSER]
    Name        json
    Format      json
    Time_Key    time
    Time_Format %Y-%m-%dT%H:%M:%S.%L
    Time_Keep   On
Configure Parseable Credentials
To generate the base64-encoded credentials:
echo -n "username:password" | base64Replace username and password with your Parseable credentials, then update the Authorization header in fluent-bit.conf.
Start the Complete Stack
Start all services:
docker-compose up -dVerify all containers are running:
docker-compose psYou should see all services in the "Up" state.
Verify Metrics Collection
1. Check Kafka Exporter is exposing metrics:
curl http://localhost:9308/metrics | grep kafka_consumergroup_lagYou should see metrics like:
kafka_consumergroup_lagkafka_topic_partition_current_offsetkafka_topic_partition_under_replicated_partition
2. Check Fluent Bit is running:
docker logs fluent-bitLook for successful scraping messages like:
[info] [input:prometheus_scrape:prometheus_scrape.0] scraping metrics from kafka-exporter:93083. Verify metrics in Parseable:
Log into your Parseable instance and check that the kafka_metrics stream exists and is receiving data.
Generate Sample Data (Optional)
To generate sample Kafka traffic for testing, create a Kafka Connect Datagen source:
curl -X POST http://localhost:8083/connectors -H "Content-Type: application/json" -d '{
  "name": "datagen-orders",
  "config": {
    "connector.class": "io.confluent.kafka.connect.datagen.DatagenConnector",
    "kafka.topic": "orders",
    "quickstart": "orders",
    "key.converter": "org.apache.kafka.connect.storage.StringConverter",
    "value.converter": "org.apache.kafka.connect.json.JsonConverter",
    "value.converter.schemas.enable": "false",
    "max.interval": 1000,
    "iterations": -1,
    "tasks.max": "1"
  }
}'
This creates an orders topic with continuous sample data generation.
Create a Consumer Group for Testing
Create a simple consumer to generate consumer lag metrics:
# Start a console consumer
docker exec -it kafka kafka-console-consumer \
  --bootstrap-server kafka:29092 \
  --topic orders \
  --group order-processor \
  --from-beginning
Press Ctrl+C after a few seconds to stop the consumer. This creates a consumer group with lag that you can monitor.
Step 2: Exploring Kafka Metrics with the Explore Page
Now that metrics are flowing into Parseable, let's start with the Explore page for quick insights.
Navigate to the Explore Page
- Log into your Parseable instance
- Select the
kafka_metricsdataset from the dropdown - Click on the Explore tab
Understanding the Kafka Metrics Schema
The kafka_metrics dataset contains the following key fields:
1.Metric Identification:
metric_name: Name of the metric (e.g.,kafka_consumergroup_lag,kafka_topic_partition_current_offset)metric_type: Type of metric (gauge, sum, histogram, summary)metric_description: Human-readable descriptionmetric_unit: Unit of measurement
2.Kafka Dimensions:
consumergroup: Consumer group nametopic: Kafka topic namepartition: Partition number
3.Metric Values:
data_point_value: The actual metric value (for gauge and sum types)data_point_sum: Sum value (for histogram and summary types)data_point_count: Count of observations
4.Timestamps:
p_timestamp: Parseable ingestion timestamptime_unix_nano: Metric collection timestampstart_time_unix_nano: Start time for cumulative metrics
Quick Filtering and Grouping
The Explore page lets you quickly filter and group metrics without writing SQL. Start with filters to narrow down the data, then use group-by to aggregate.
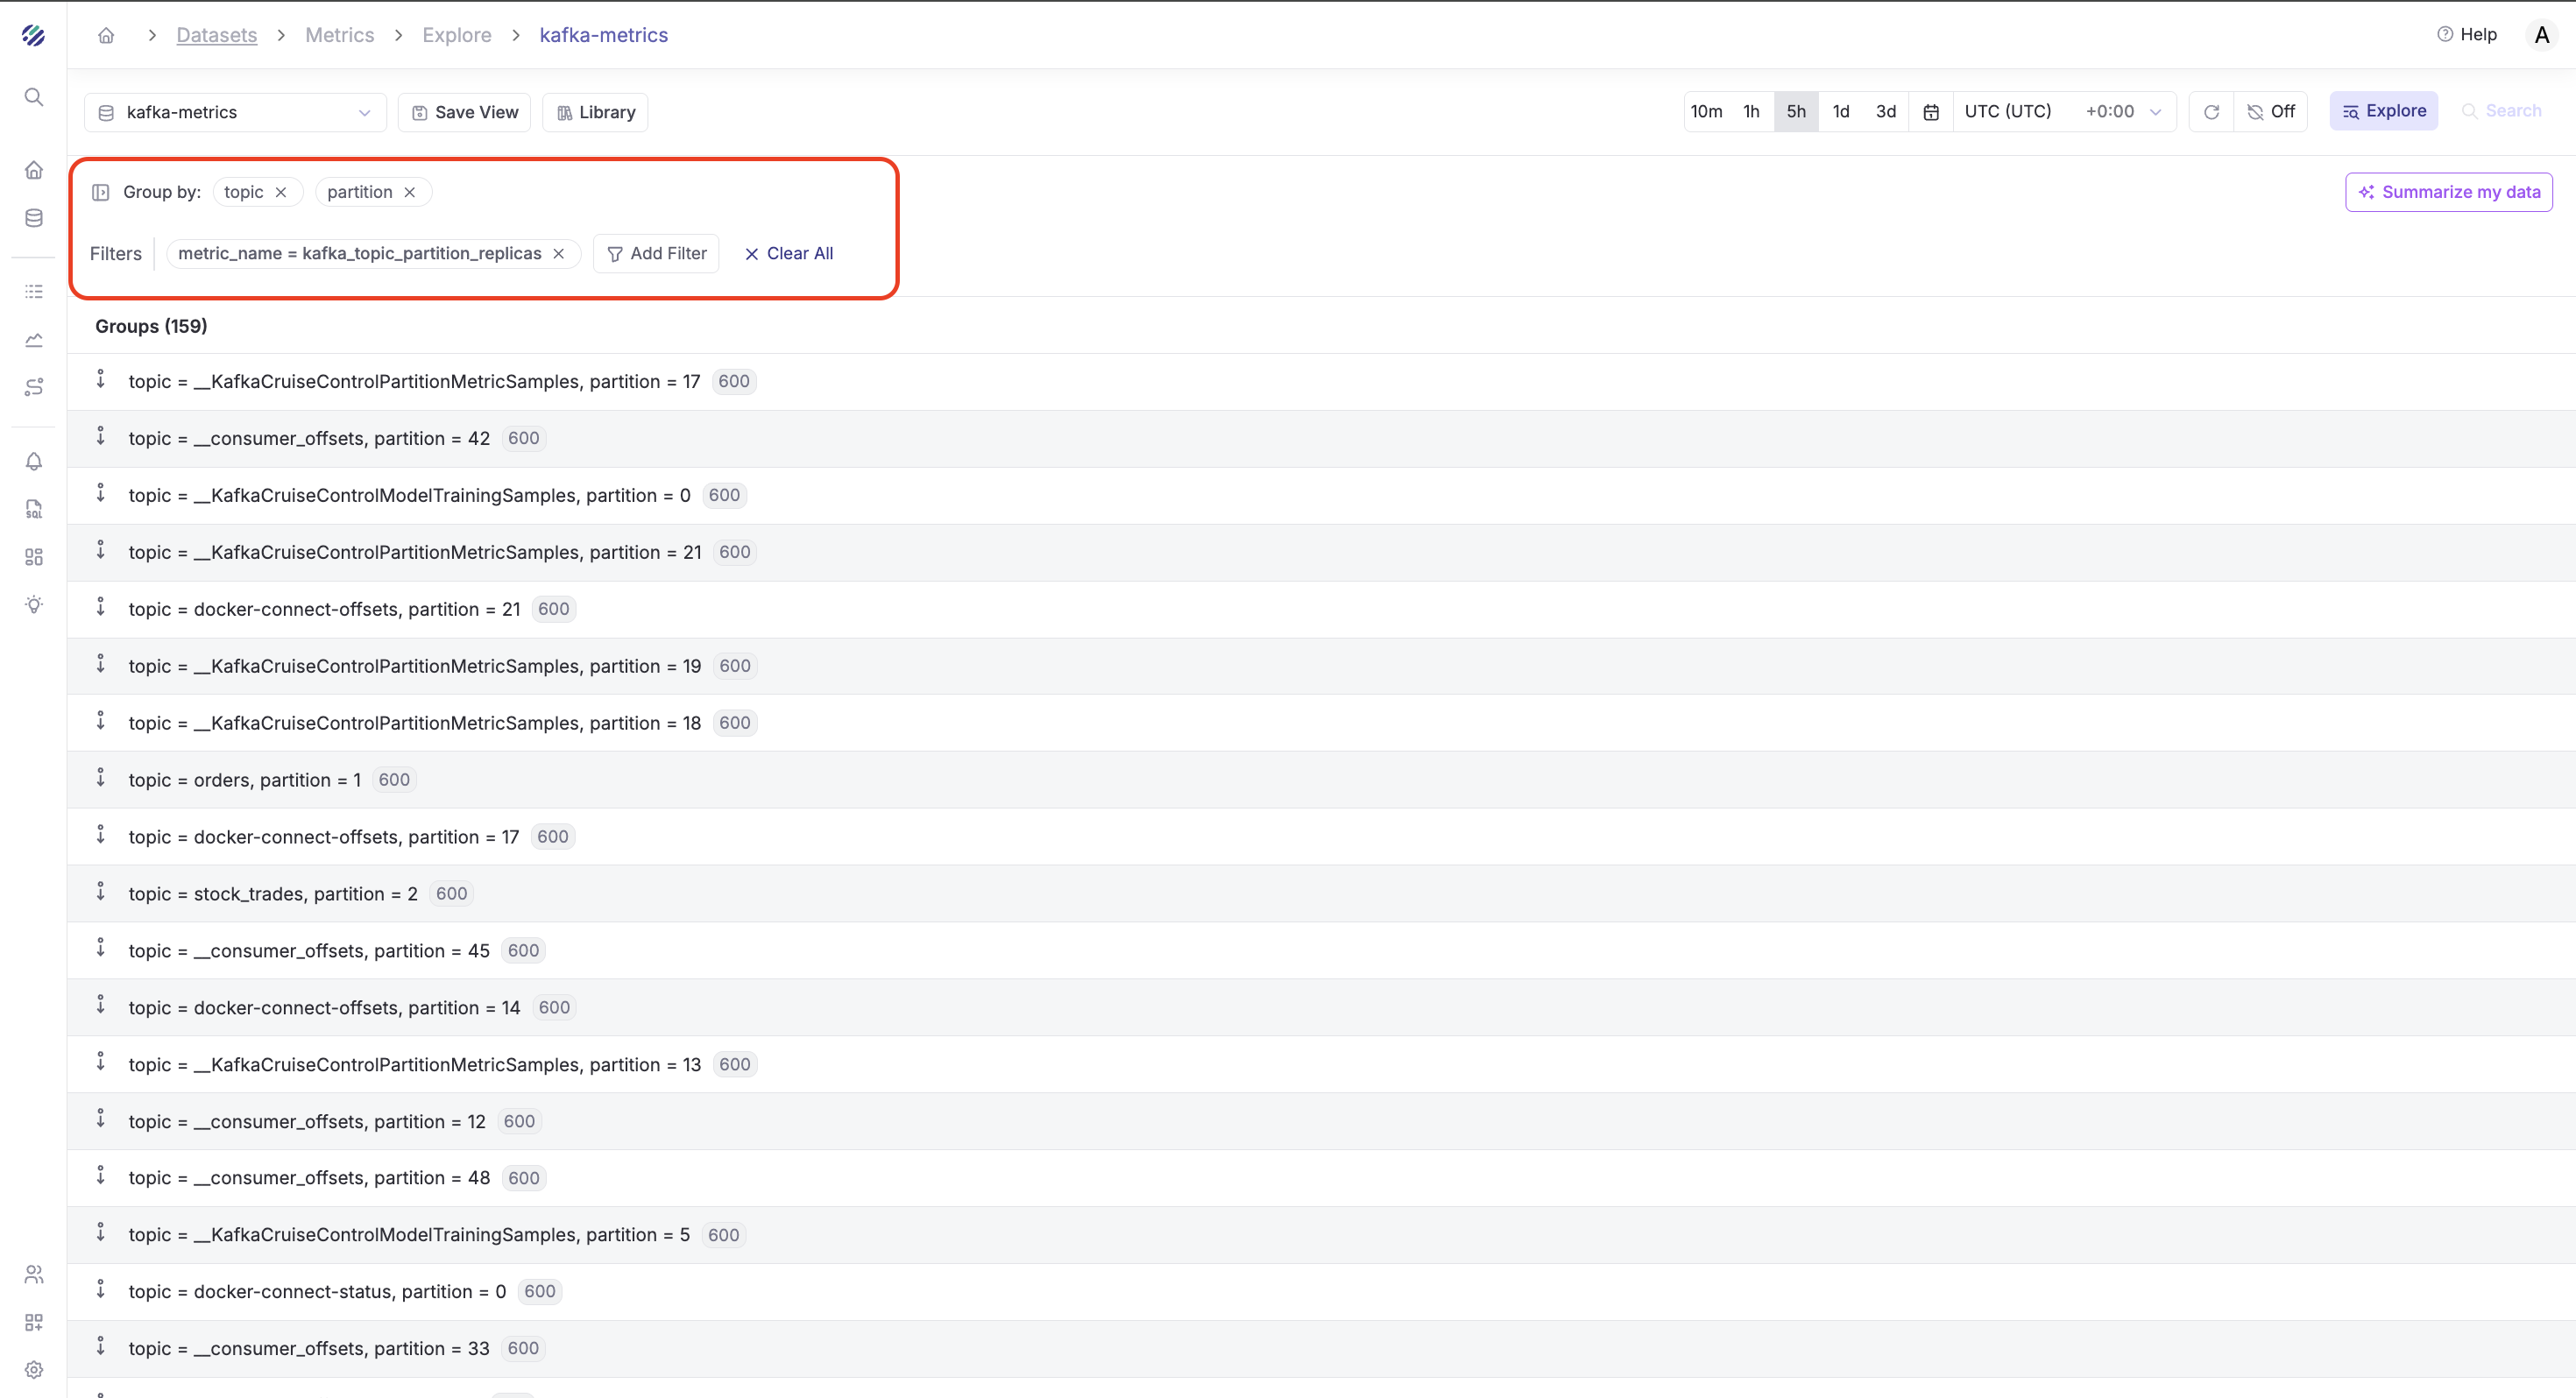
Example 1: View Kafka Partitons Replicas by Topic and Partition
Step 1 - Add Filters:
- Click Add Filter
- Field:
metric_name - Operator:
= - Value:
kafka_topic_partition_replicas - Set time range to "Last 1 hour"
Step 2 - Group By:
- In the Group By section, select
topic,partition
Result: You'll see the maximum replicas for each partition, immediately showing which partitions are falling behind.
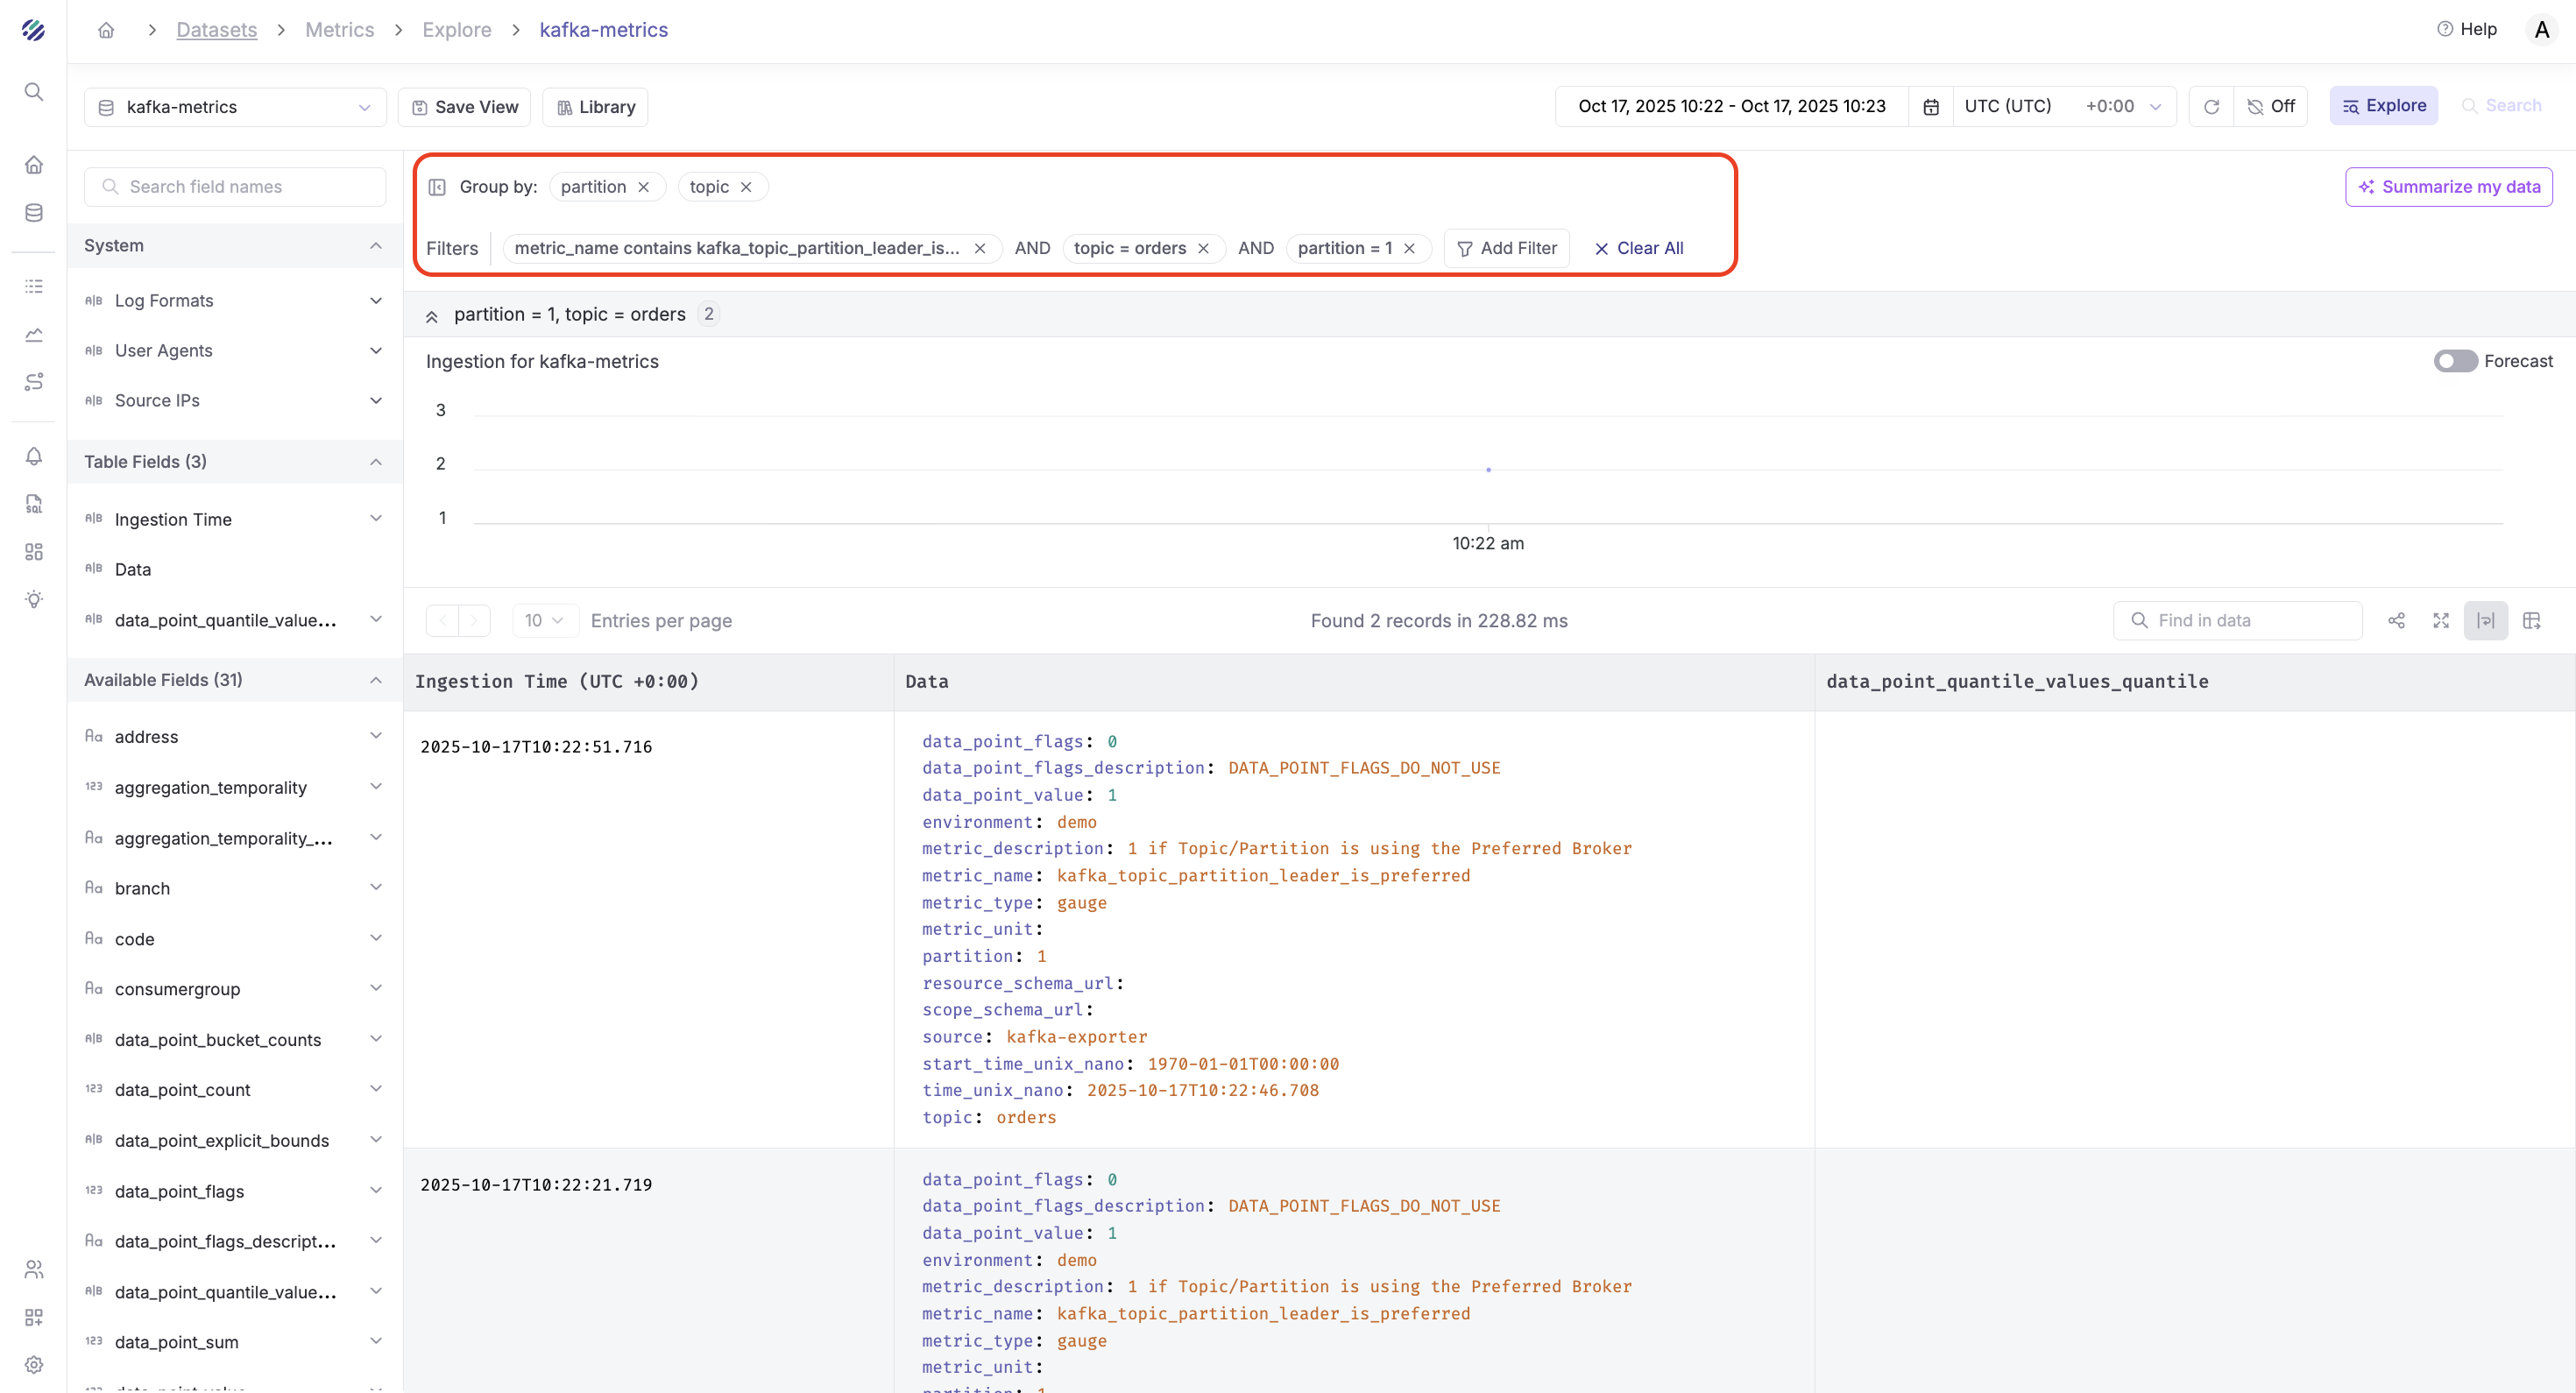
Example 2: Monitor Topic Partition Leader Is Preferred
Step 1 - Add Filters:
- Filter 1:
metric_name=kafka_topic_partition_leader_is_preferred - Filter 2:
topic=orders(or your topic name) - Time range: "Last 1 hour"
Step 2 - Group By:
- Group by:
topic,partition - Aggregation:
MAX(data_point_value)
Result: This shows the leader is preferred for each partition in your topic, helping you understand data distribution and partition activity.
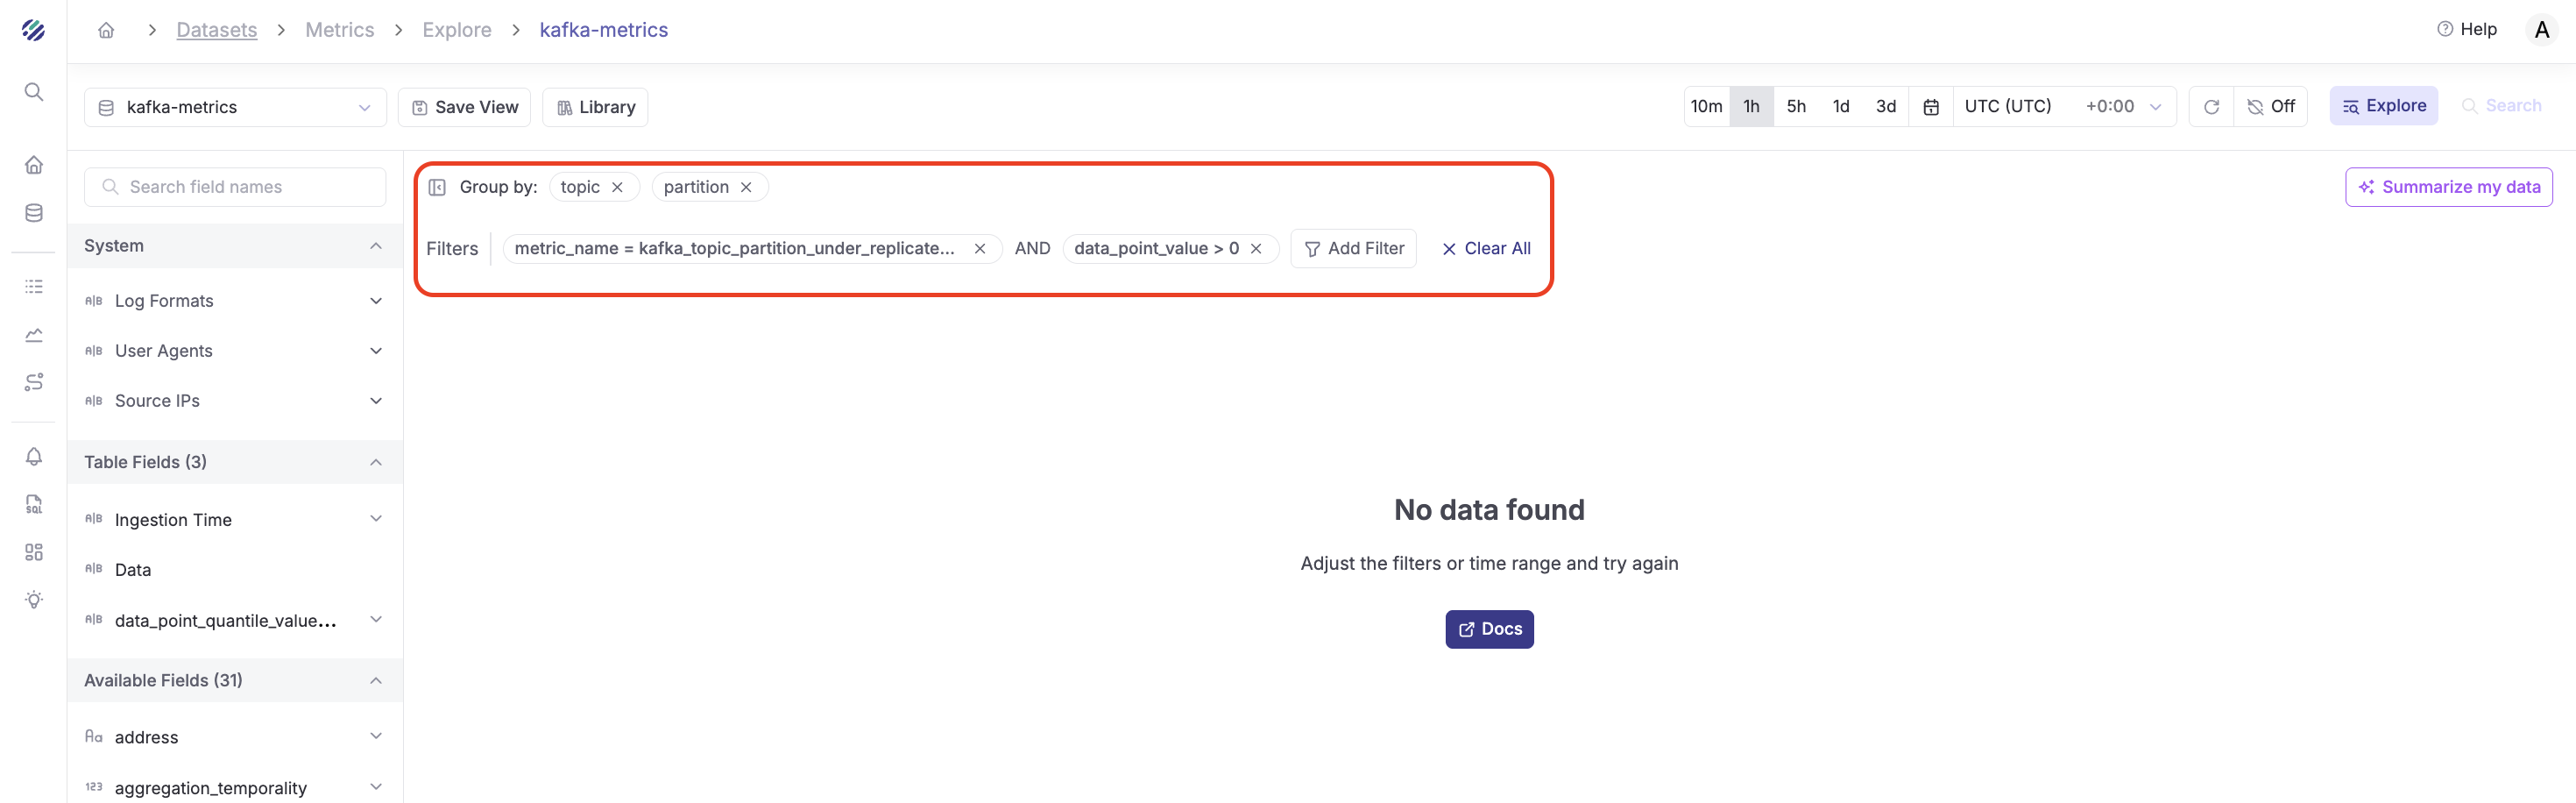
Example 3: Identify Under-Replicated Partitions
Step 1 - Add Filters:
- Filter 1:
metric_name=kafka_topic_partition_under_replicated_partition - Filter 2:
data_point_value>0 - Time range: "Last 15 minutes"
Step 2 - Group By:
- Group by:
topic,partition - Aggregation:
MAX(data_point_value)
Result: This immediately highlights any partitions with replication issues that need attention.
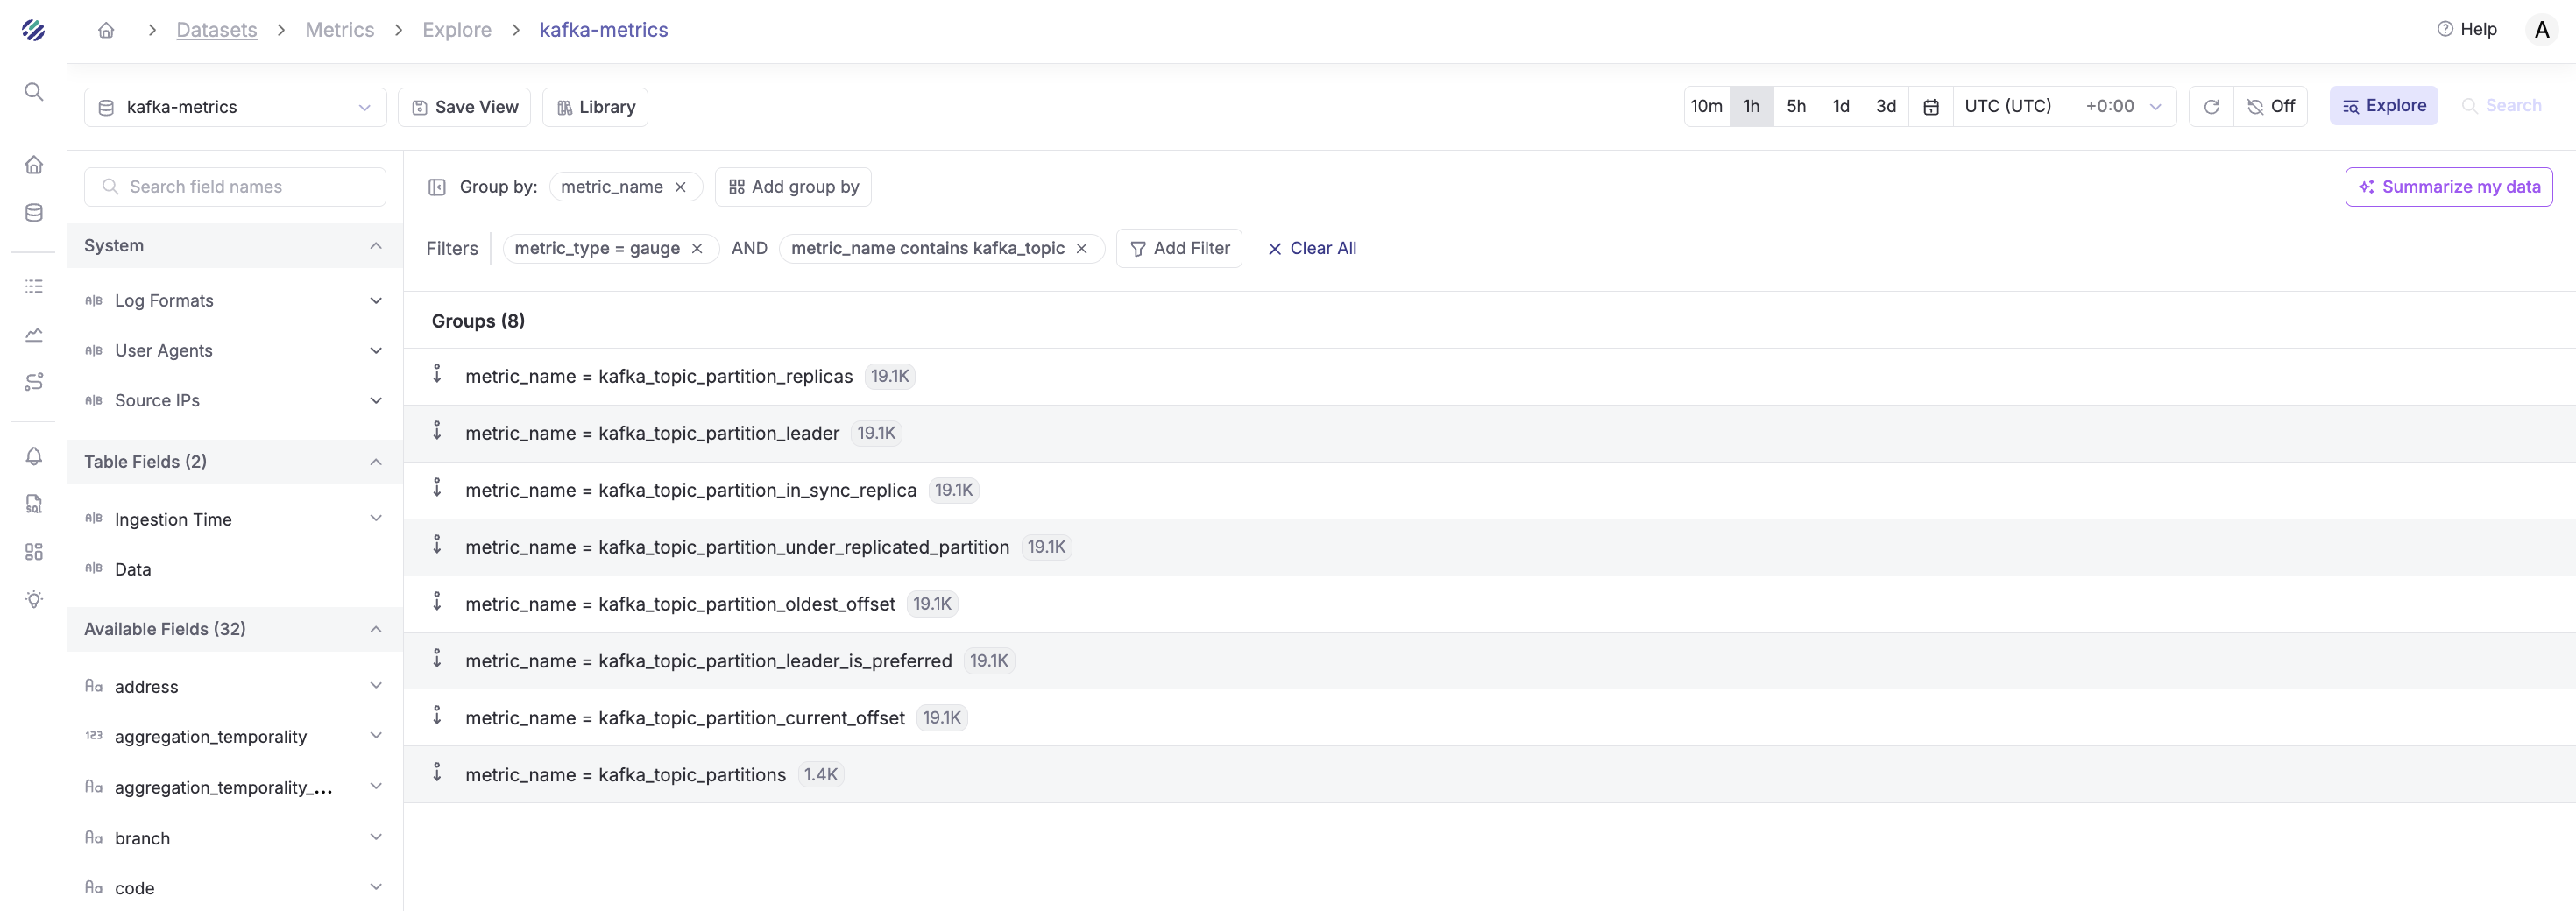
Example 4: Monitor Specific Metric Types
Step 1 - Add Filters:
- Filter 1:
metric_type=gauge - Filter 2:
metric_nameCONTAINSkafka_topic - Time range: "Last 30 minutes"
Step 2 - Group By:
- Group by:
metric_name
Result: Shows all gauge-type metrics related to Kafka topics and their data point counts.
Understanding the Data
The Explore page is perfect for:
- Quick health checks: Filter by metric name and view aggregated values
- Identifying trends: Use time range filters to spot patterns
- Filtering by dimensions: Narrow down to specific consumer groups, topics, or partitions
- Aggregating metrics: Group by multiple dimensions to understand relationships
However, for more complex analysis and deepdives we need the SQL editor, dashboards and setting up alerts. The details of this is available in Part 2 of this tutorial.
Conclusion
Setting up comprehensive Kafka monitoring doesn't require complex tool sprawl or extensive configuration. With just Parseable and Kafka Exporter, you can quickly get meaningful insights into your Kafka cluster's health—partition status, replication health, and topic metrics, all in one place.
The Explore page makes it simple to filter and group your Kafka metrics without writing any code.
Start monitoring your Kafka clusters with Parseable today and transform your operational efficiency.

