Introduction
The OpenTelemetry Demo is a microservice‑based application that mirrors the complexities you'd find in a real‑world distributed system. It's packed with production grade HTTP calls, message queues, and database interactions, all instrumented with OpenTelemetry so you can see traces, metrics, and logs in action.
In this post, we'll show you how to send the OTel Demo's telemetry to Parseable, an open-source unified observability platform, to query, search, and correlate all your data in one place.
Before we begin, a huge shout out to the OTel community for maintaining the demo app. Read more about how you can contribute and add to it.
Why Parseable?
Parseable is an open-source, unified observability platform built to ingest, store, and query all types of telemetry data, logs, metrics, traces, and events,in one place. Parseable leverages object storage as the source of truth and delivers fast performance through a single, lightweight binary.
Even the best demo only tells half the story if your backend can't keep up. Here's why Parseable makes all your OpenTelemetry data actually useful:
What is Zero‑Stack Architecture?
No more tools sprawl across various telemetry data types. Parseable treats your object store (S3, MinIO, whatever) as the source of truth, with a single binary that does ingestion, indexing, and querying. Read More on Zero Stack Architecture.
All‑In‑One Telemetry
With schema auto‑detection, Logs, metrics, traces, events live side‑by‑side. You can pivot from a slow HTTP span to the exact log line or metric spike that caused it, without bouncing between tools.
SQL‑First Querying
You already know SQL. Parseable layers a familiar, ANSI‑compliant engine on top of your telemetry lake, so you're writing simple SELECTs instead of learning yet another query language.
By the end of this tutorial, you'll not only have your OpenTelemetry Demo hooked into Parseable, you'll see exactly why a zero‑stack, SQL‑driven observability platform changes the game.
Pre-Requisites
Currently we are using Docker Compose to install and run both OTel Demo App and Parseable. Hence you should have the following requirements in your system:
- Docker
- Docker Compose v2.0.0+
- System Requirements:
- Linux/macOS/Windows
- 6 GB of RAM for the application
Read More on detailed requirements.
Get and run the demo
Step-1: Clone the Demo repository:
git clone https://github.com/parseablehq/opentelemetry-demo/tree/mainStep-2: Change to the demo folder:
cd opentelemetry-demo/Step-3: Start the demo
docker compose up --force-recreate --remove-orphans --detachVerify the web store and Telemetry
Once the images are built and containers are started you can access:
- Demo Application: http://localhost:8080/
- Parseable Observability Platform: http://localhost:8000/
Exploring OpenTelemetry data in Parseable
When the OTel Demo is running, the built-in load generator simulates traffic in the application. After a couple of seconds you can see data arriving in Parseable.
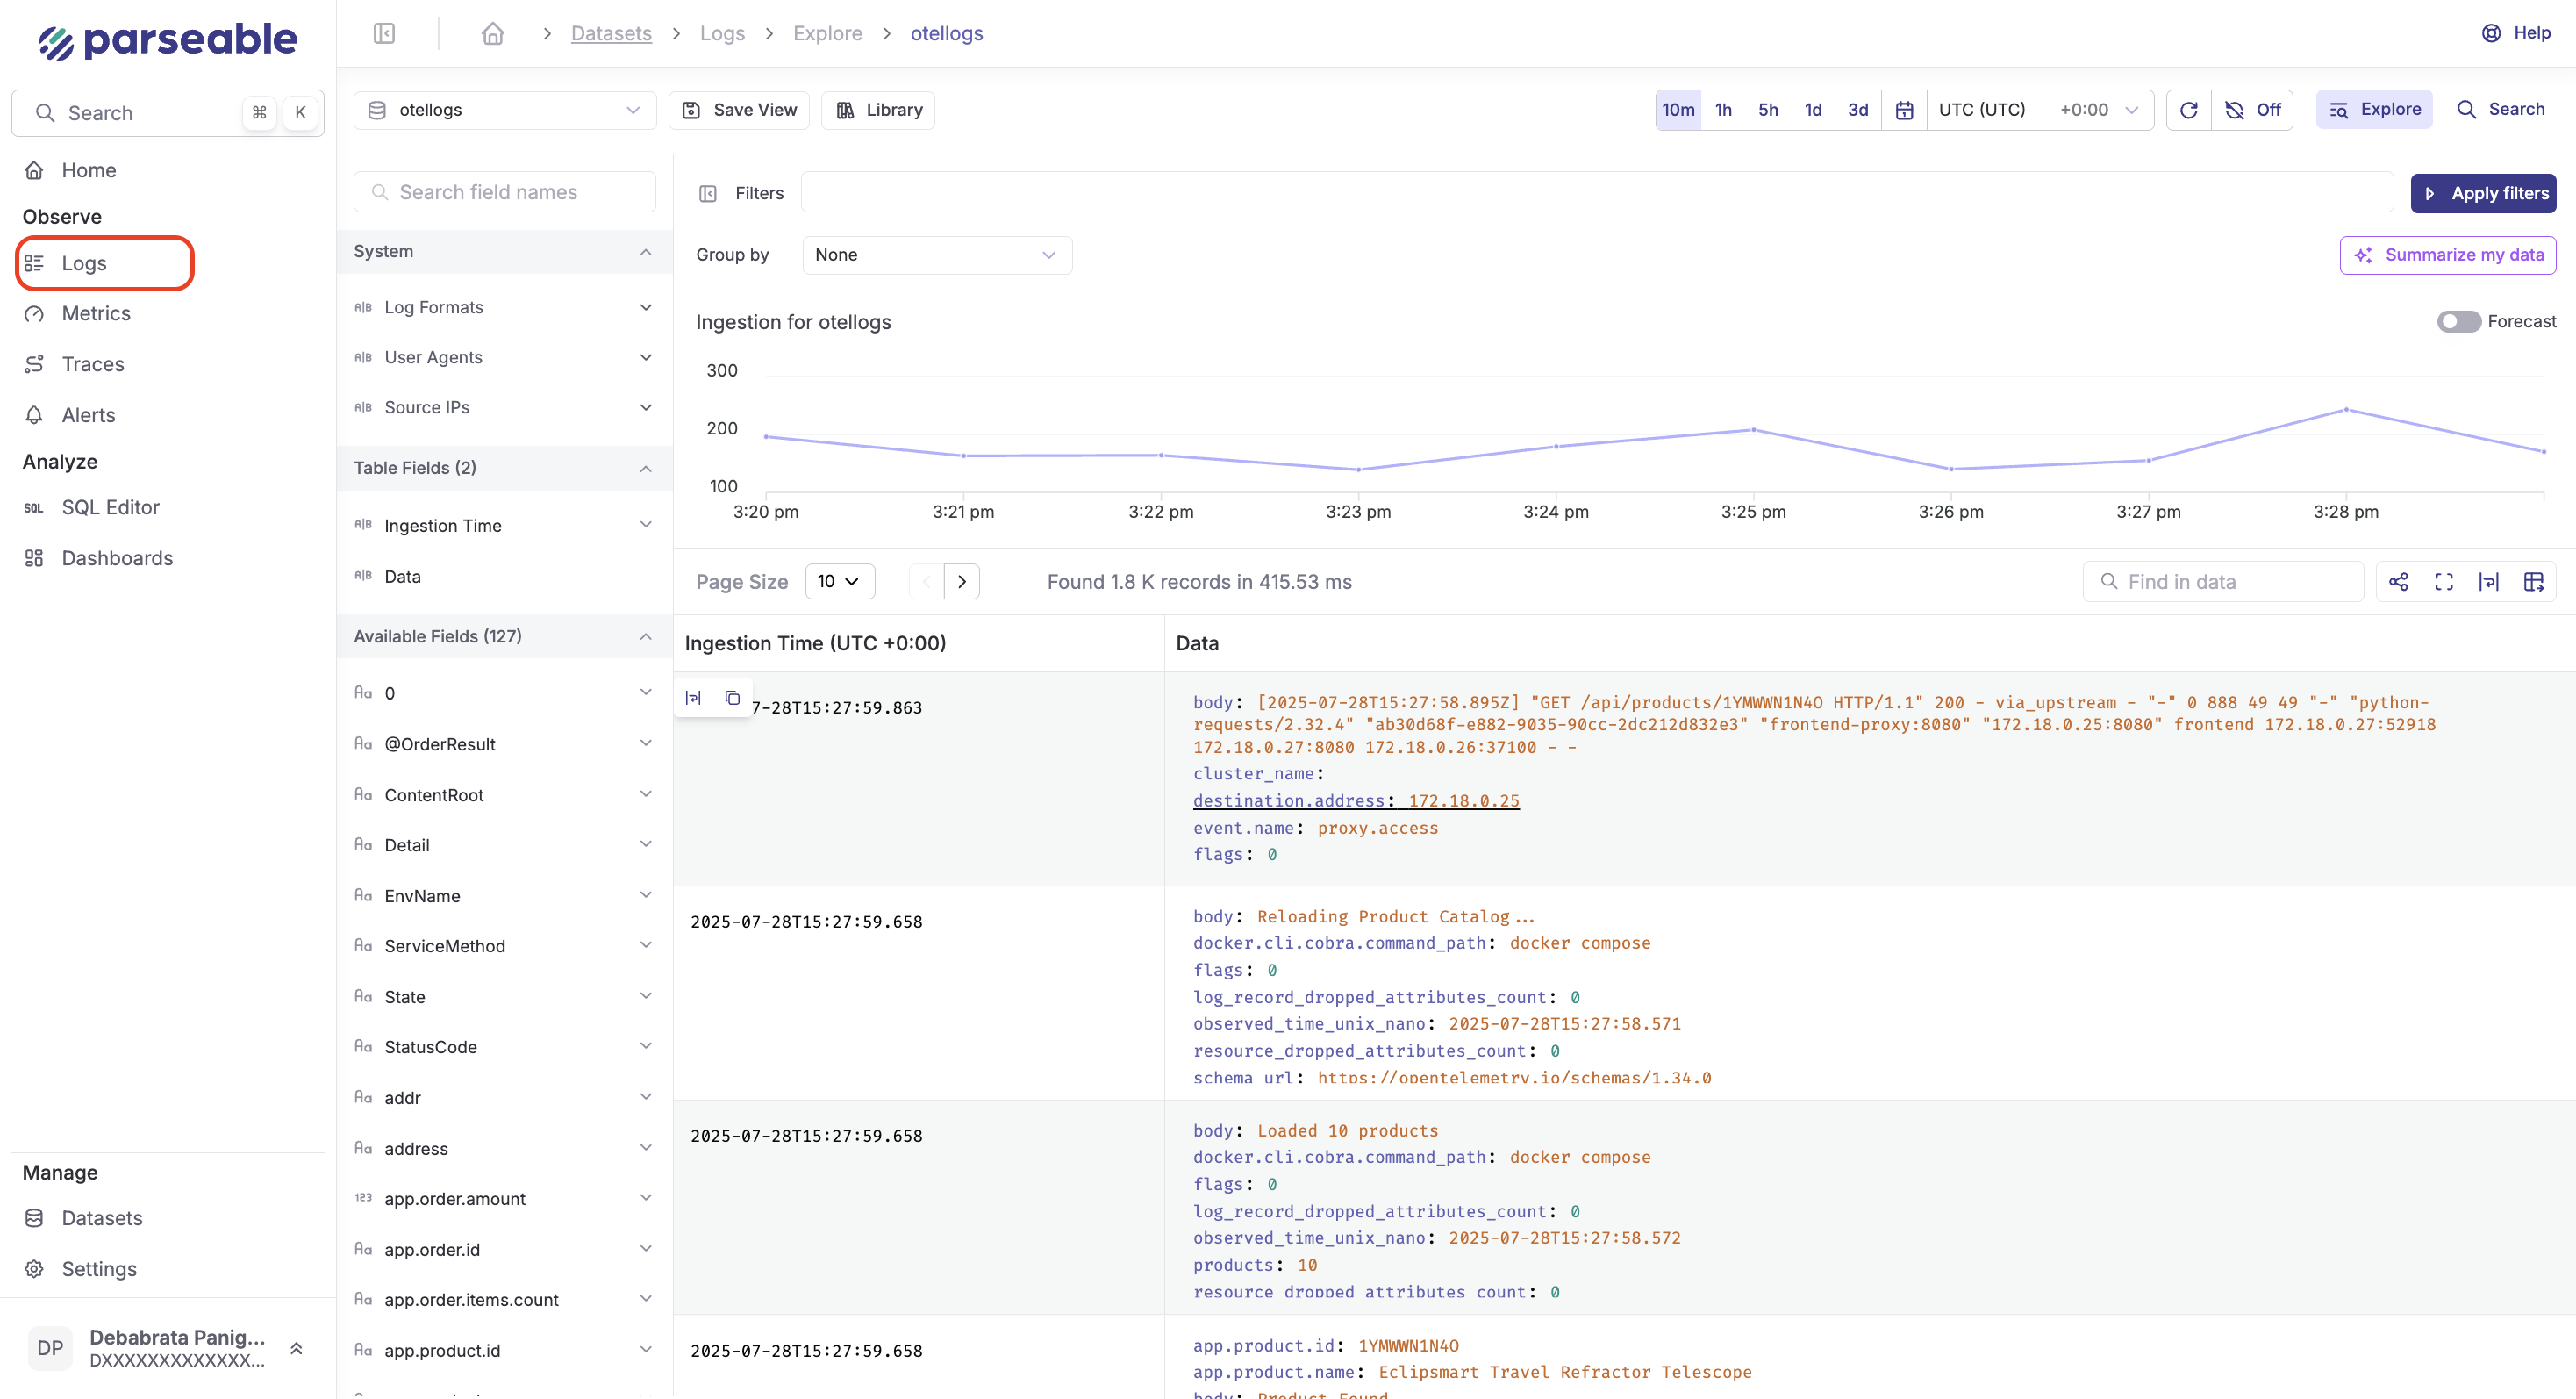
Log Explorer
Navigate to Logs tab on the sidenav, and you will get an intutive view of your logs loading the ingestion trend and the detailed log messages.
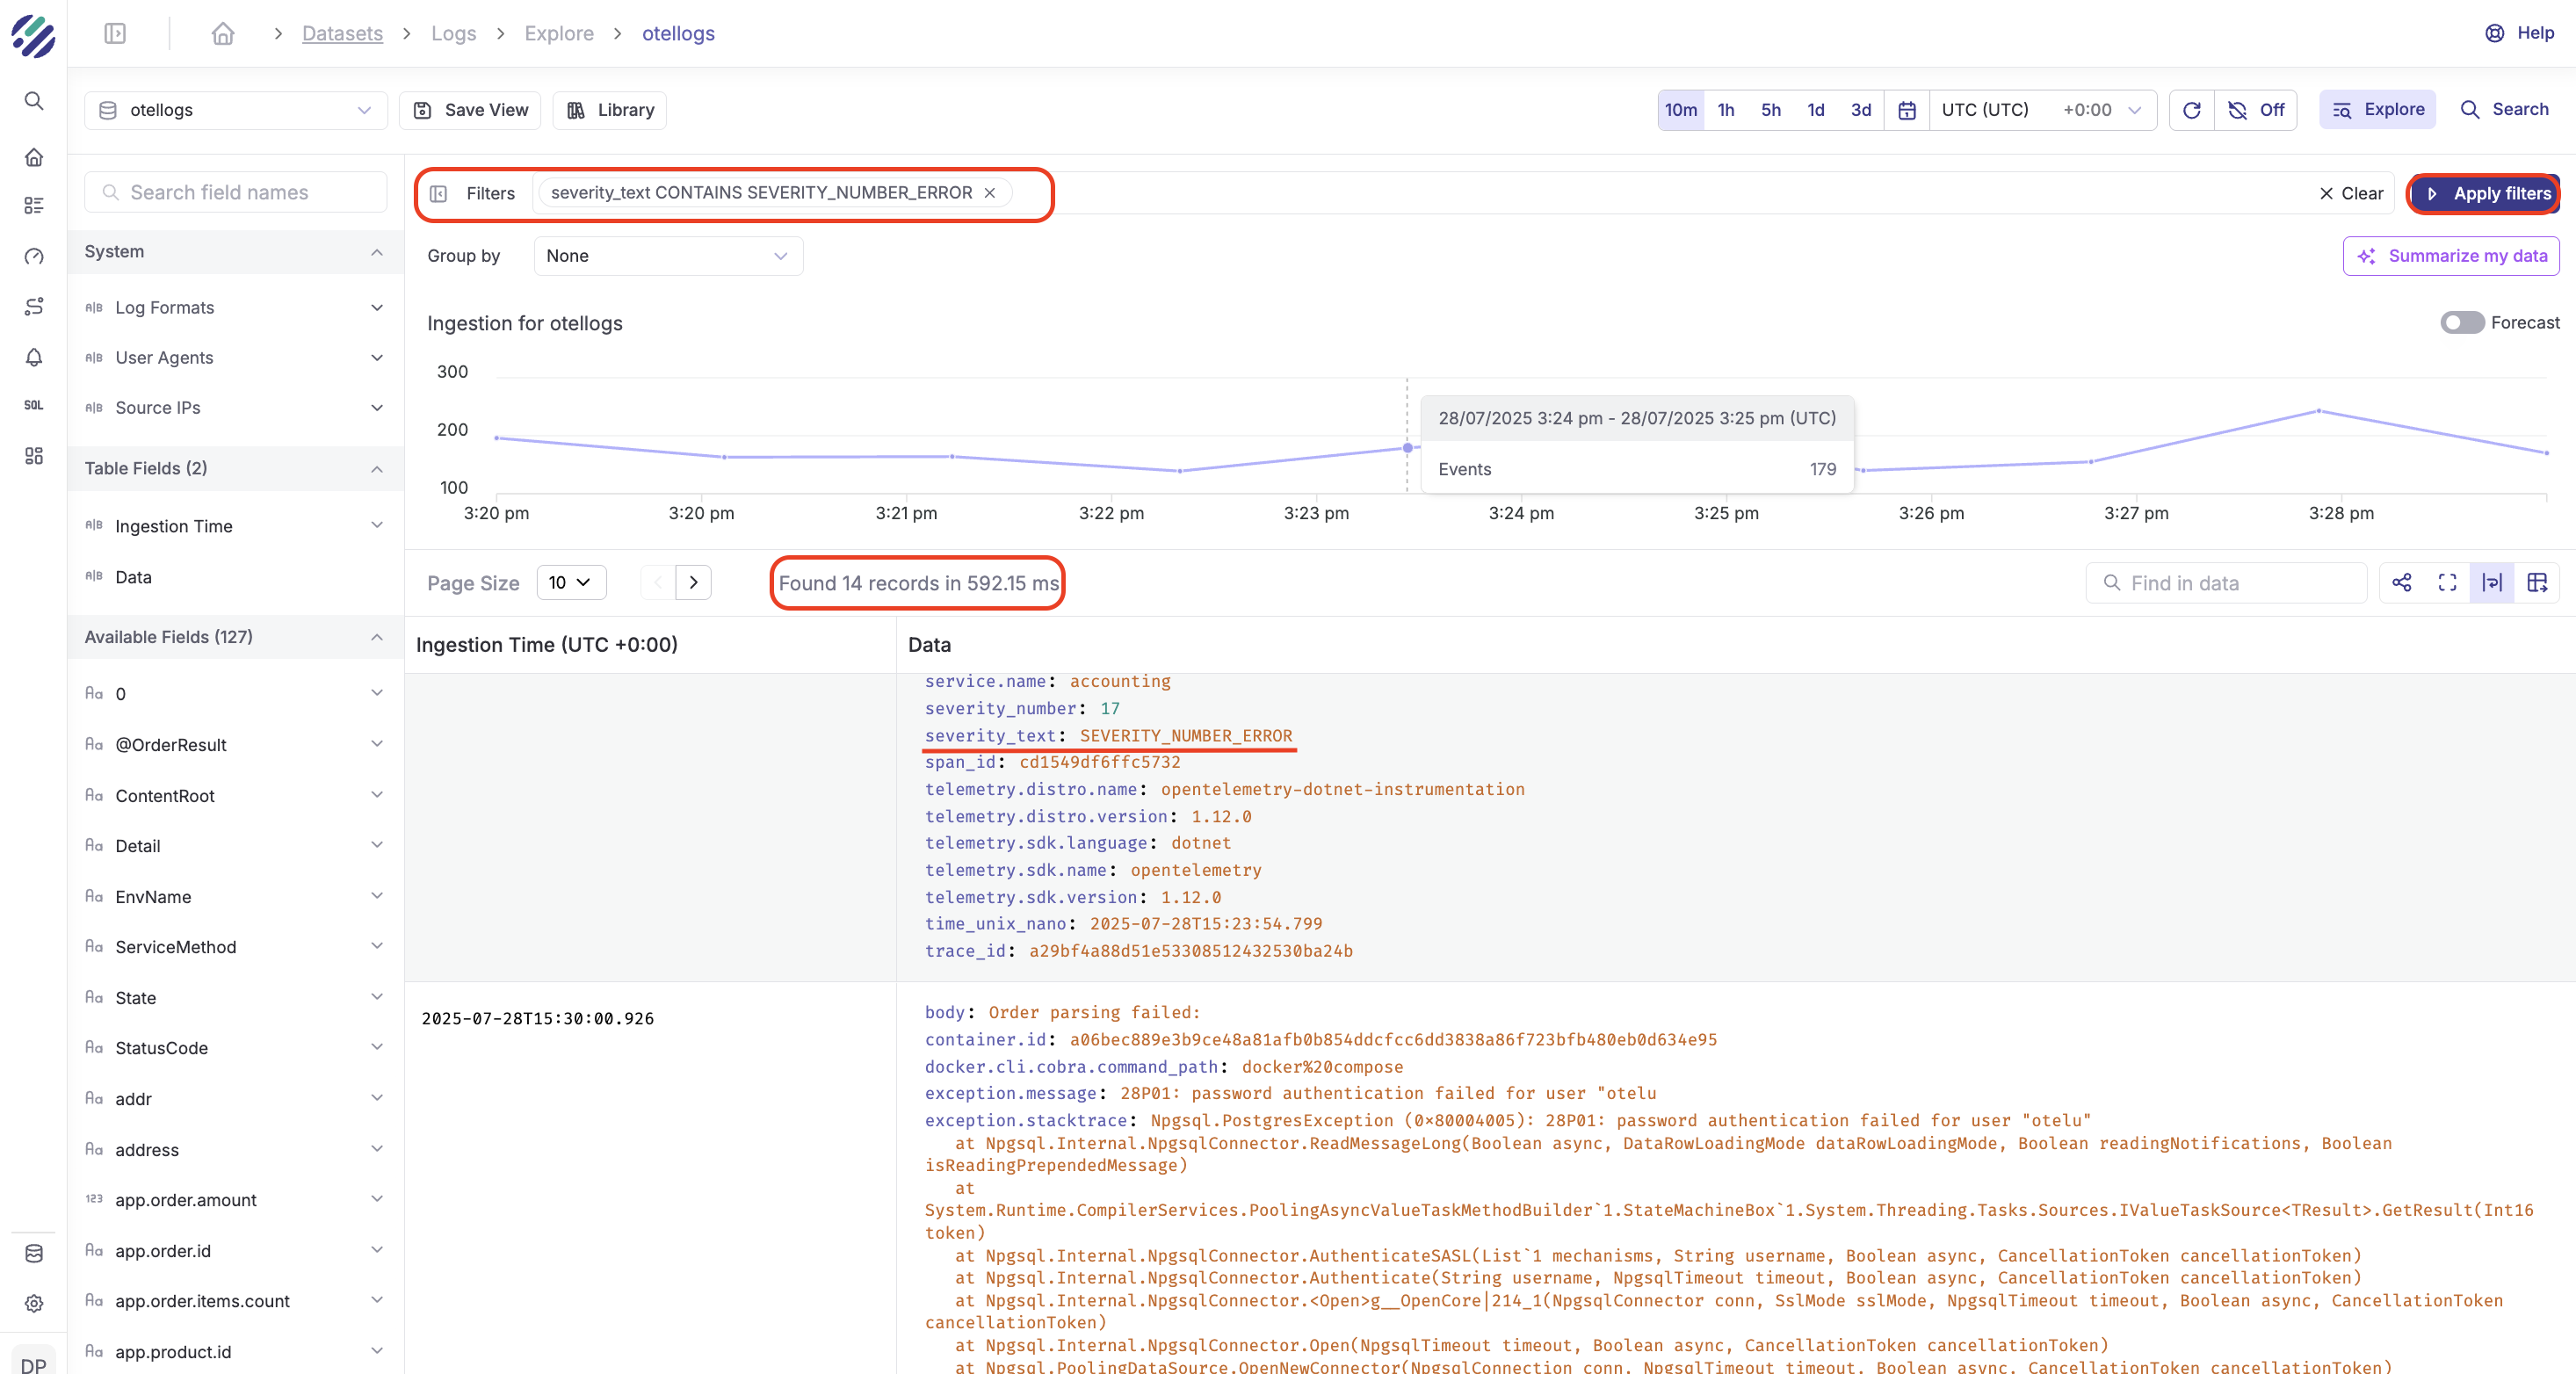
Apply Filters
Apply filters to search for specific log messages. For example, you can search for log messages with severity_text CONTAINS SEVERITY_NUMBER_ERROR and group by service.name.
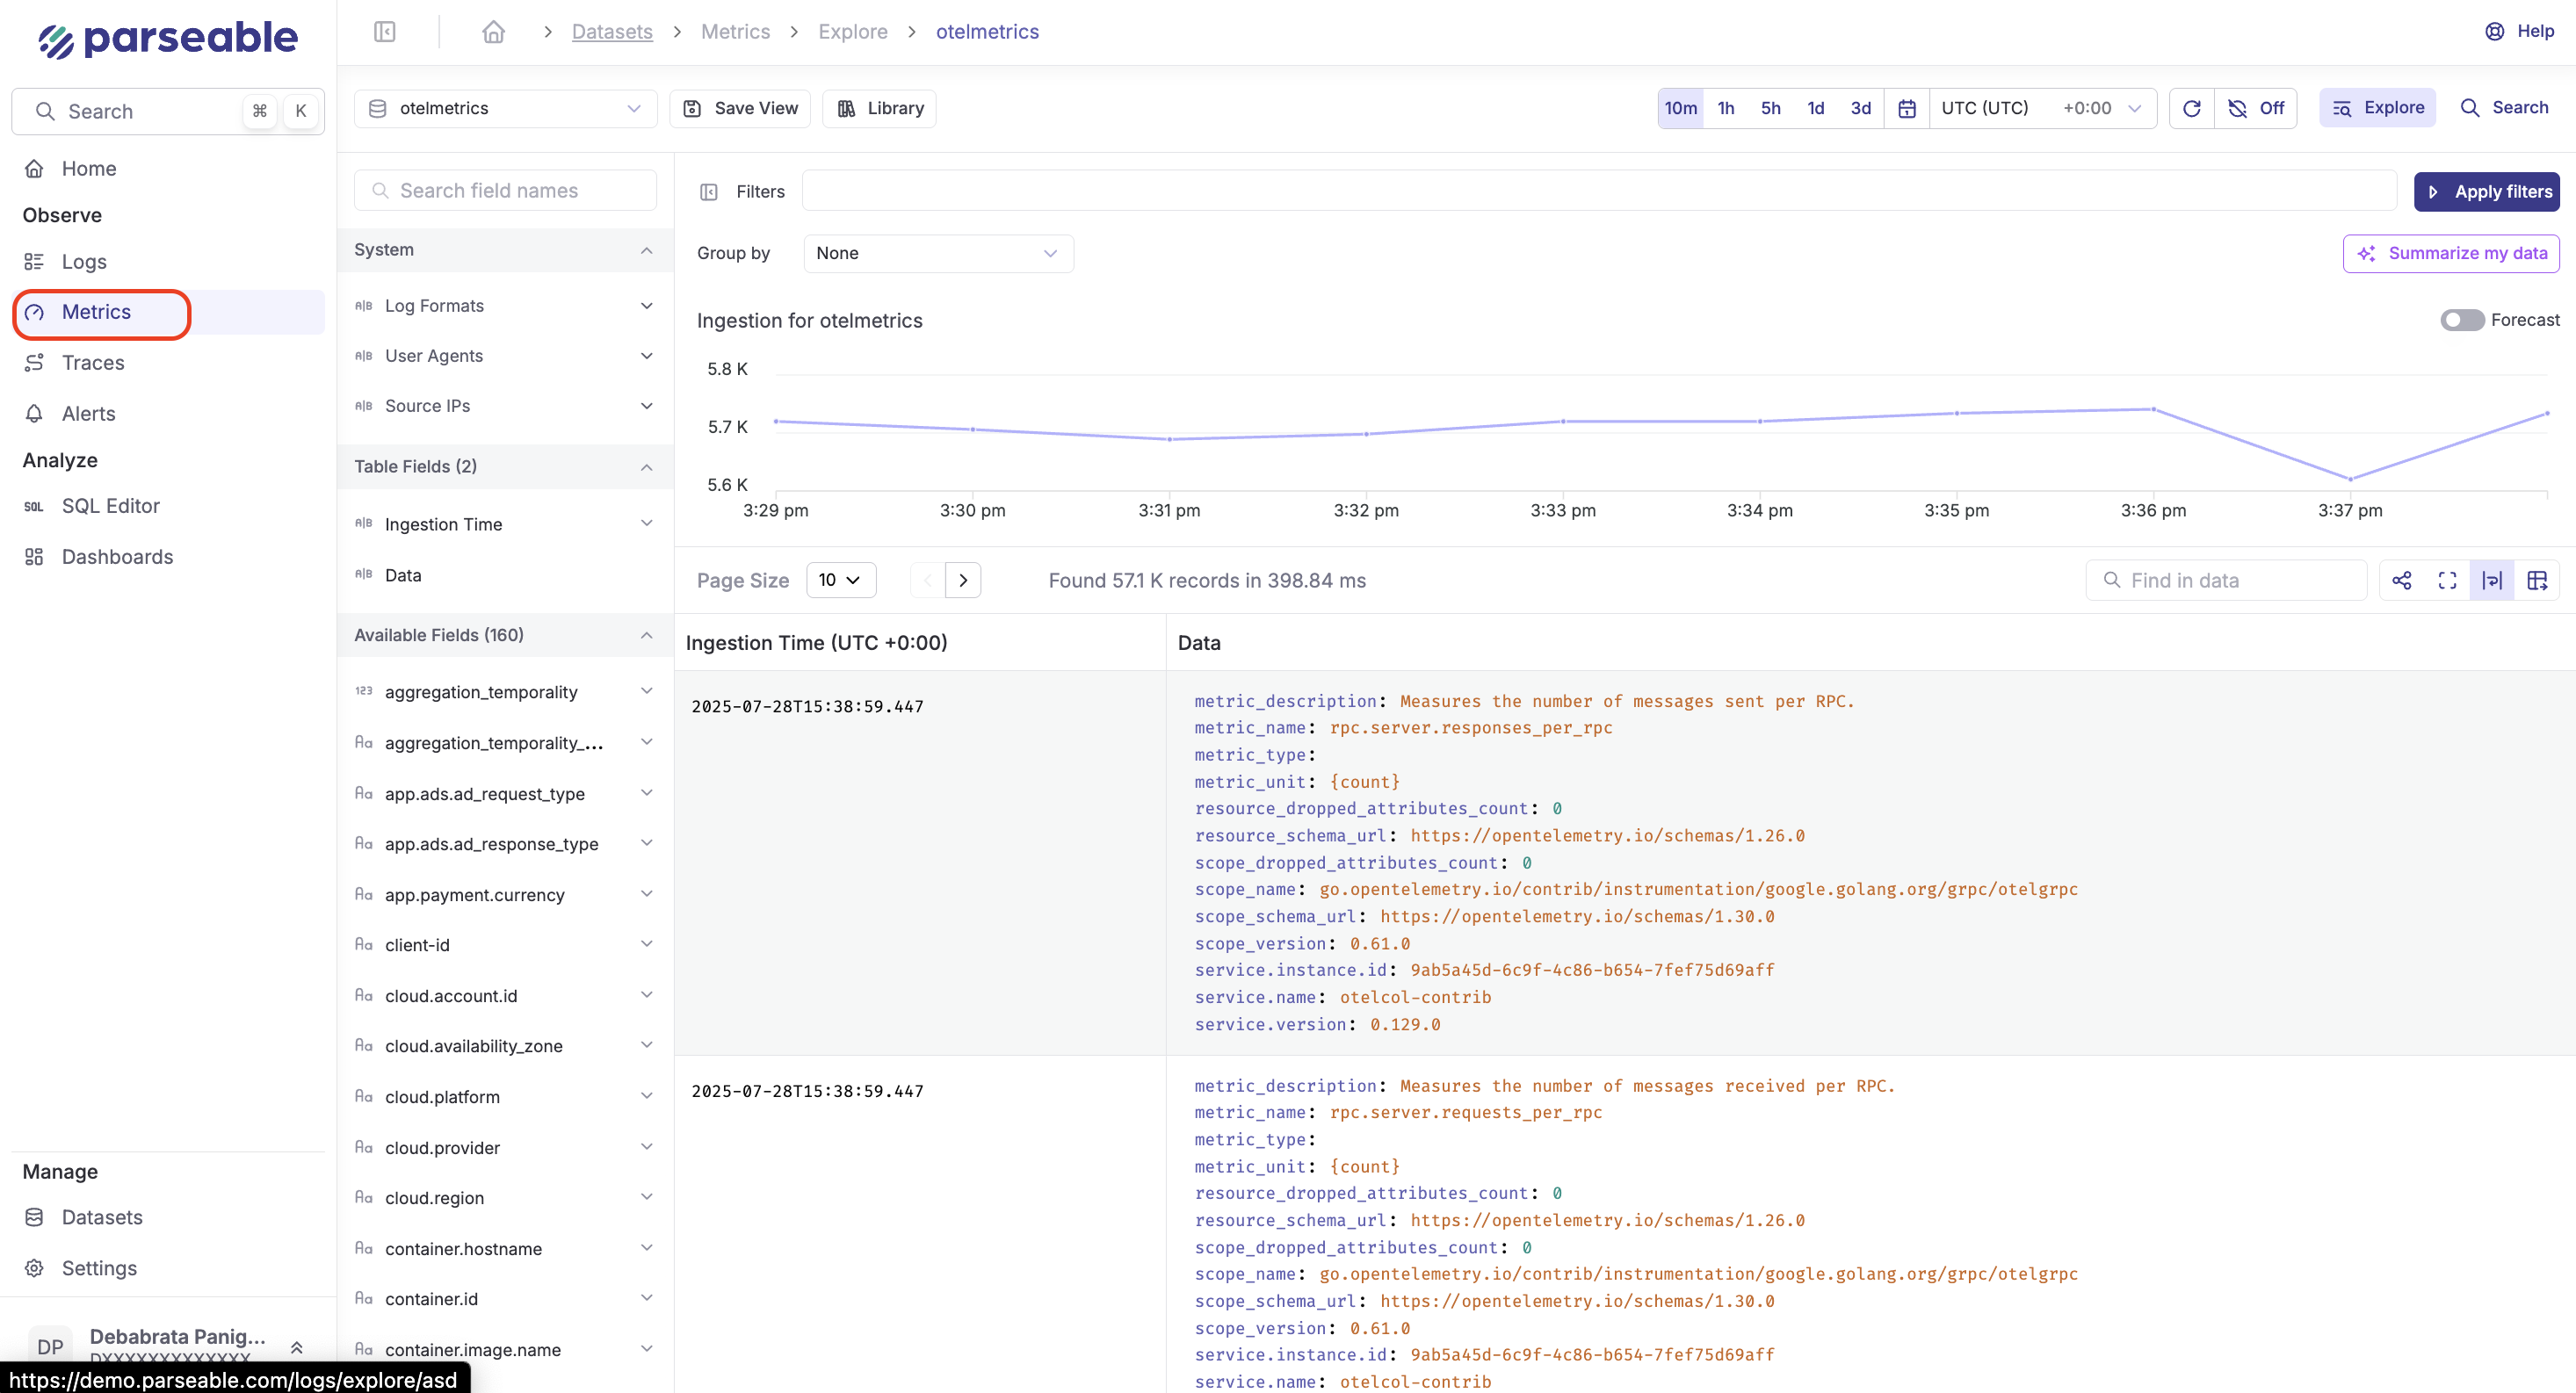
Metrics
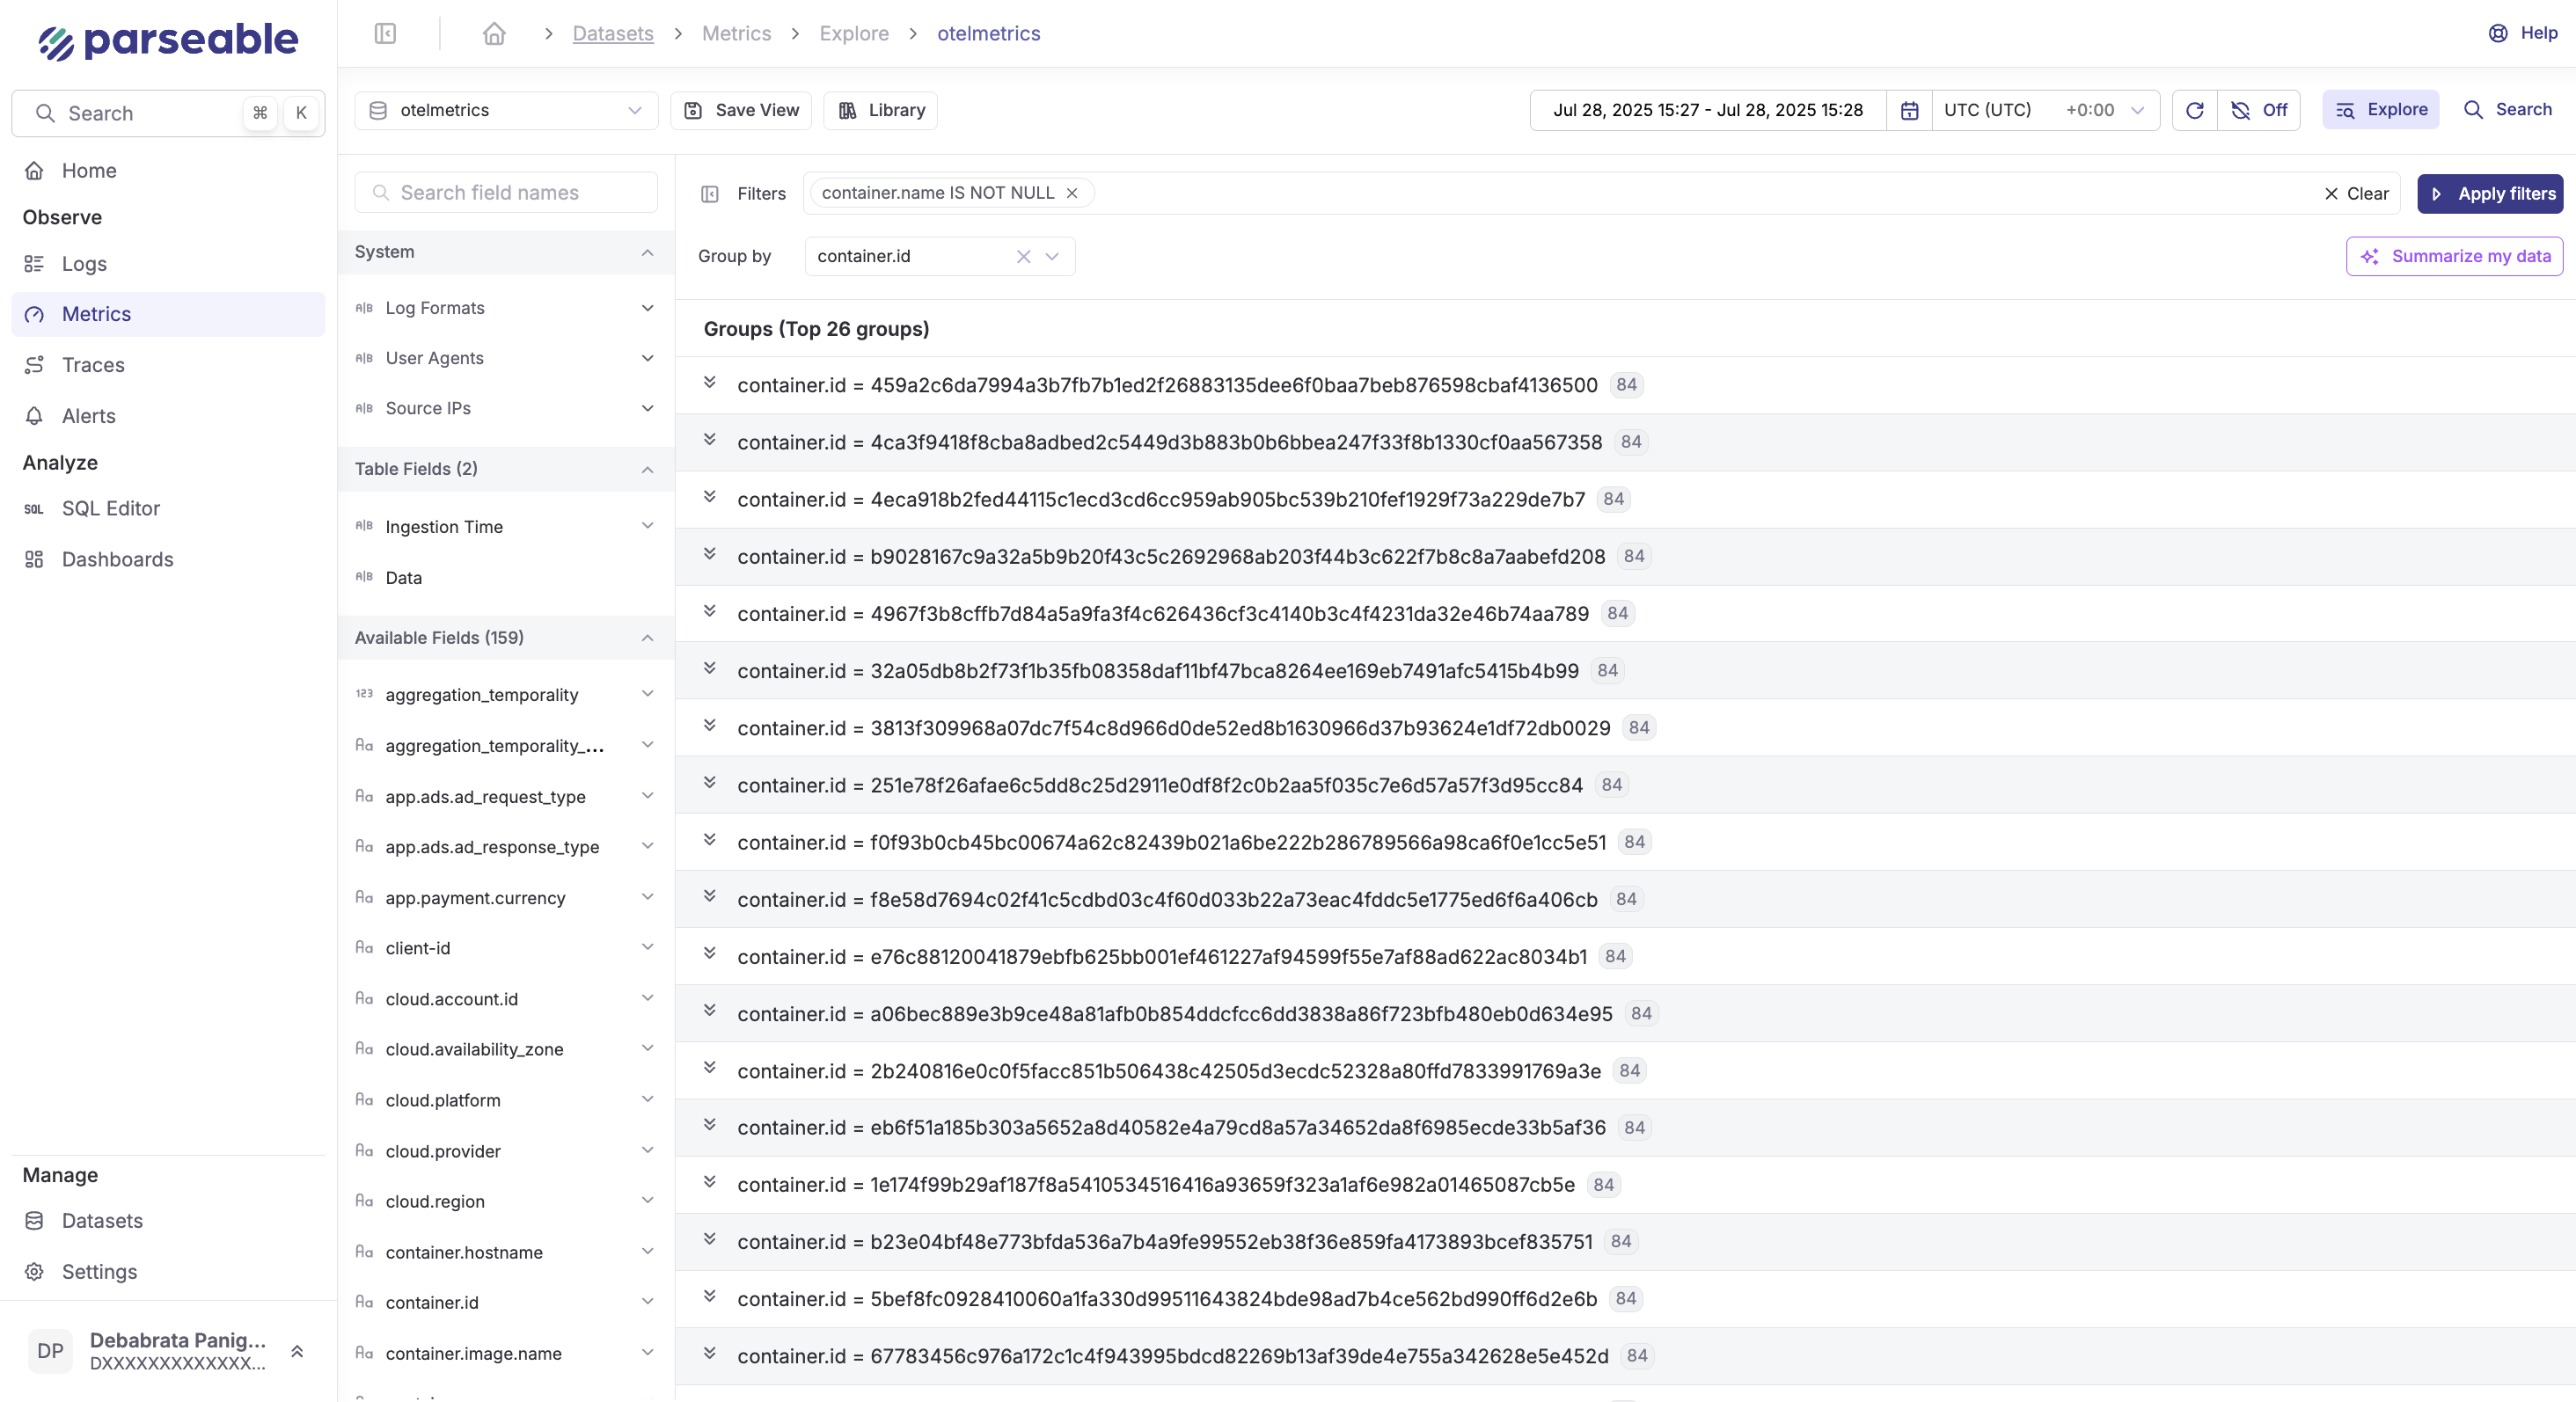
Navigate to Metrics tab on the sidenav, and you will get an intutive view of your metrics loading the ingestion trend and the detailed metrics. Analyze detailed metrics using filters container.name IS NOT NULL and group by container.id.
Traces
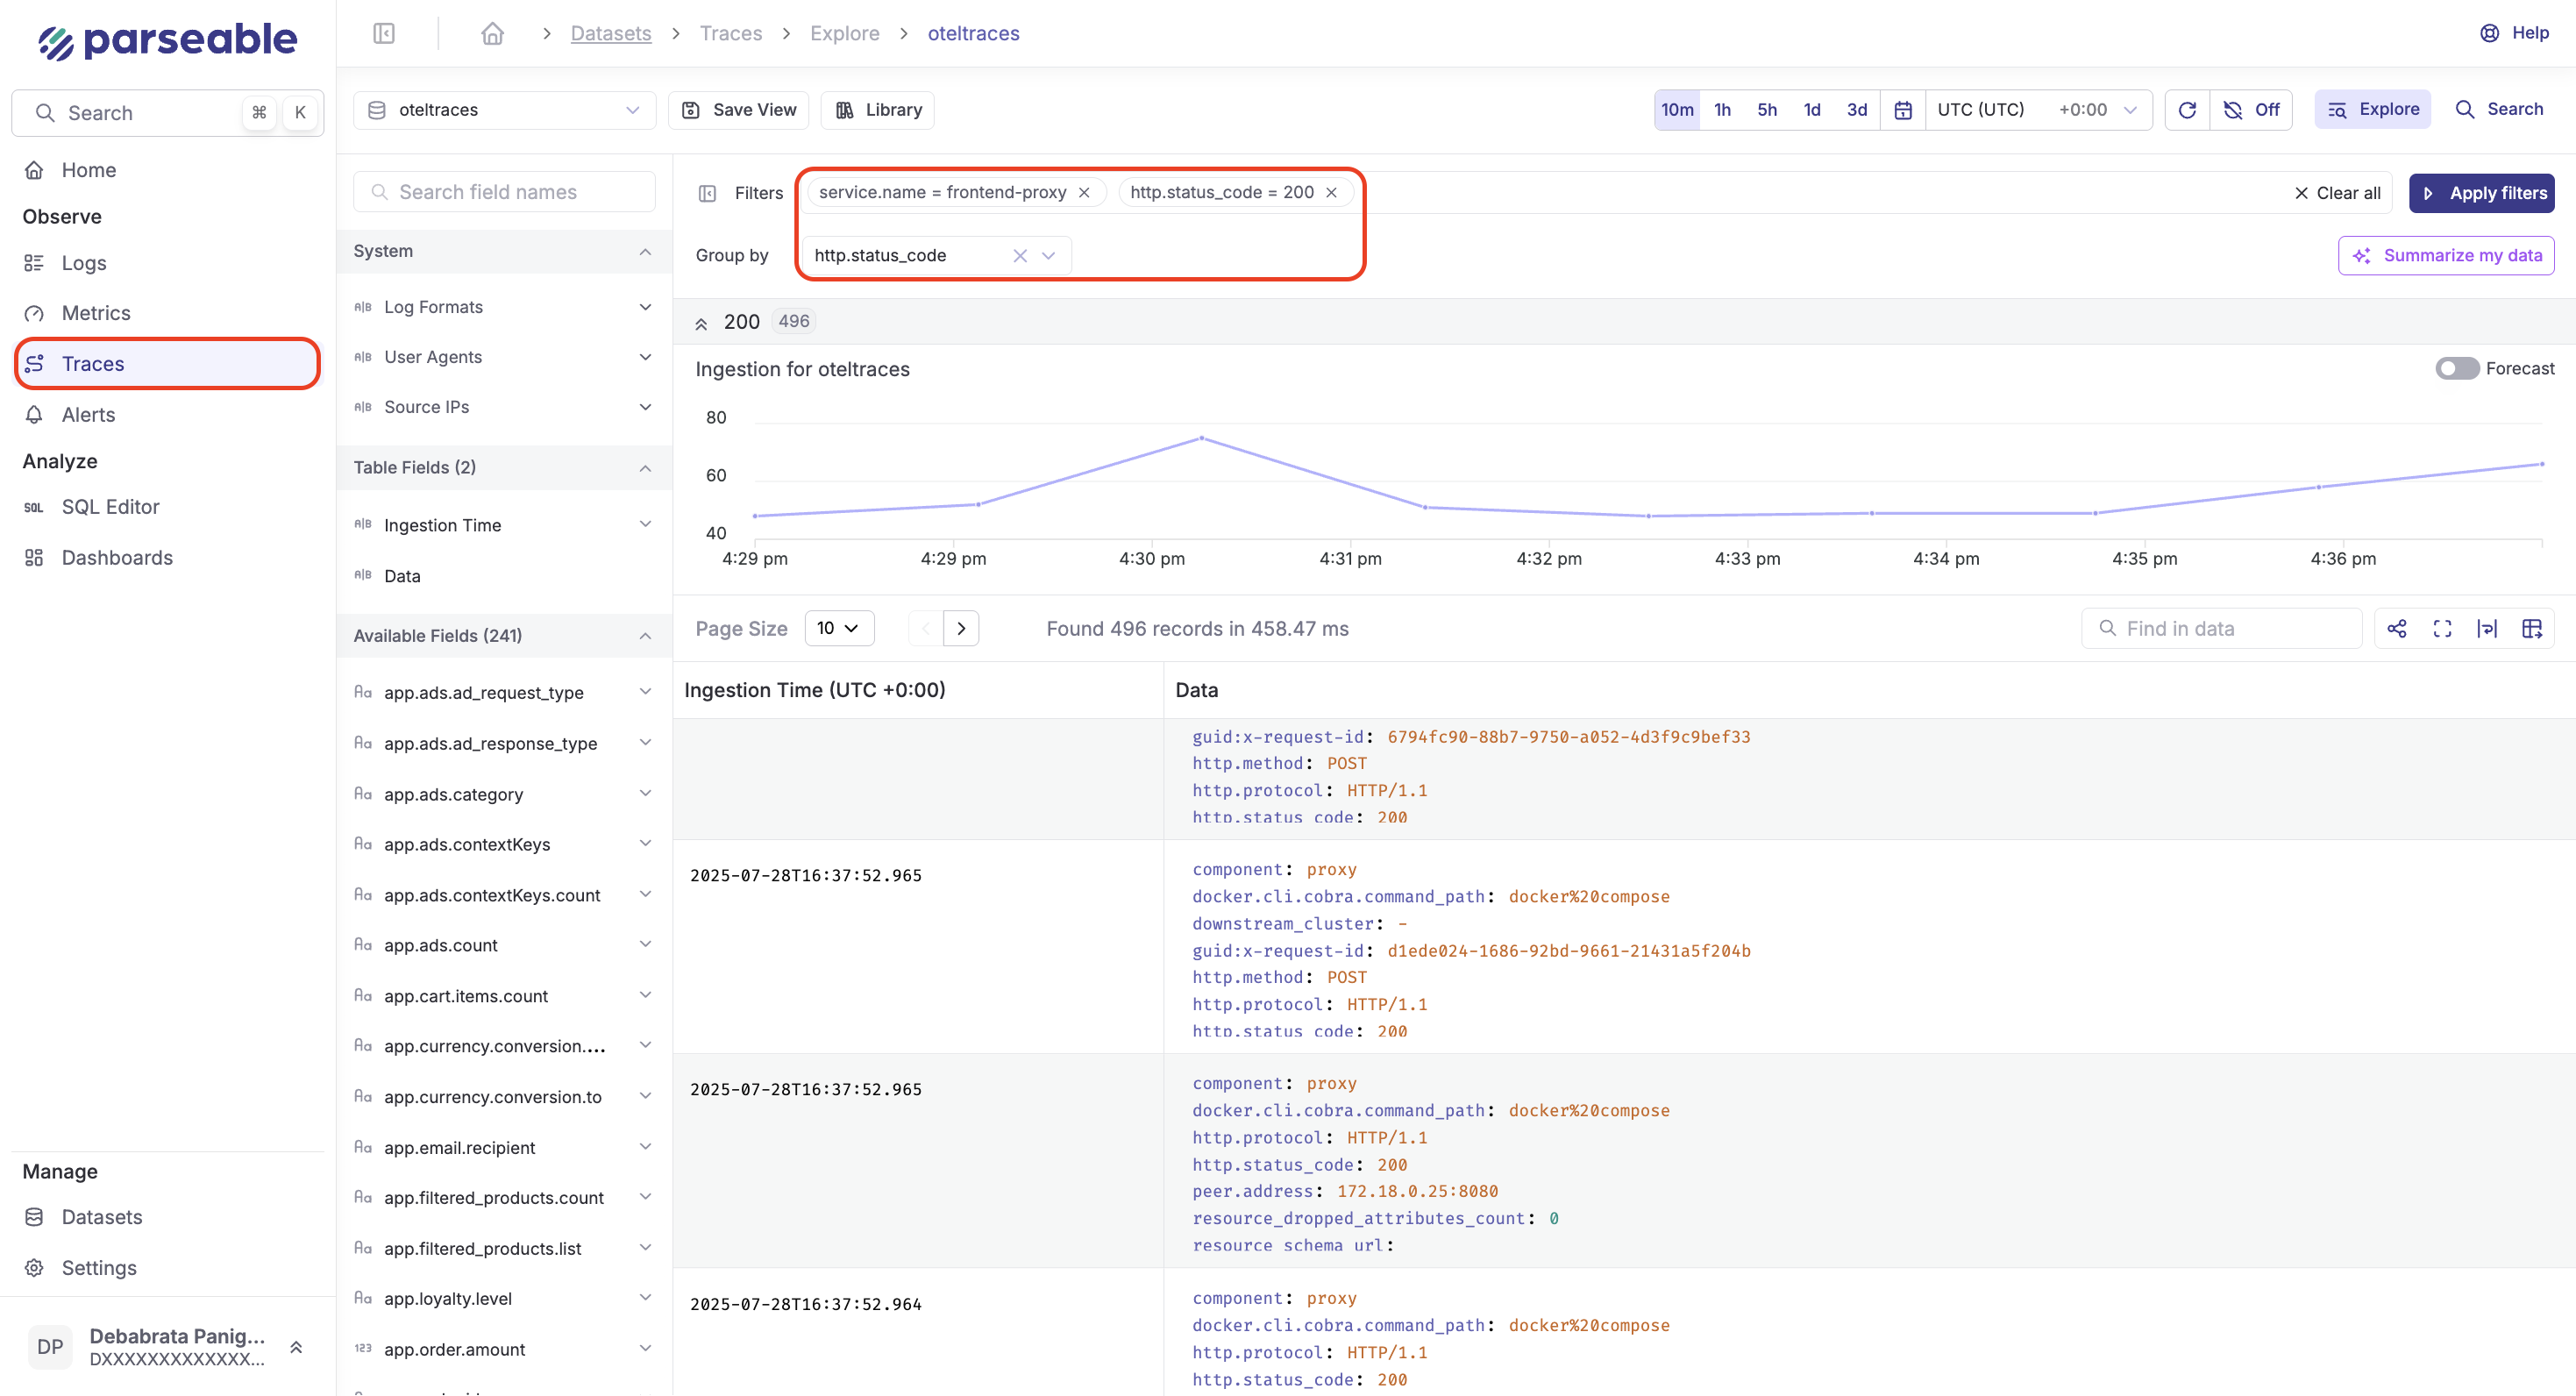
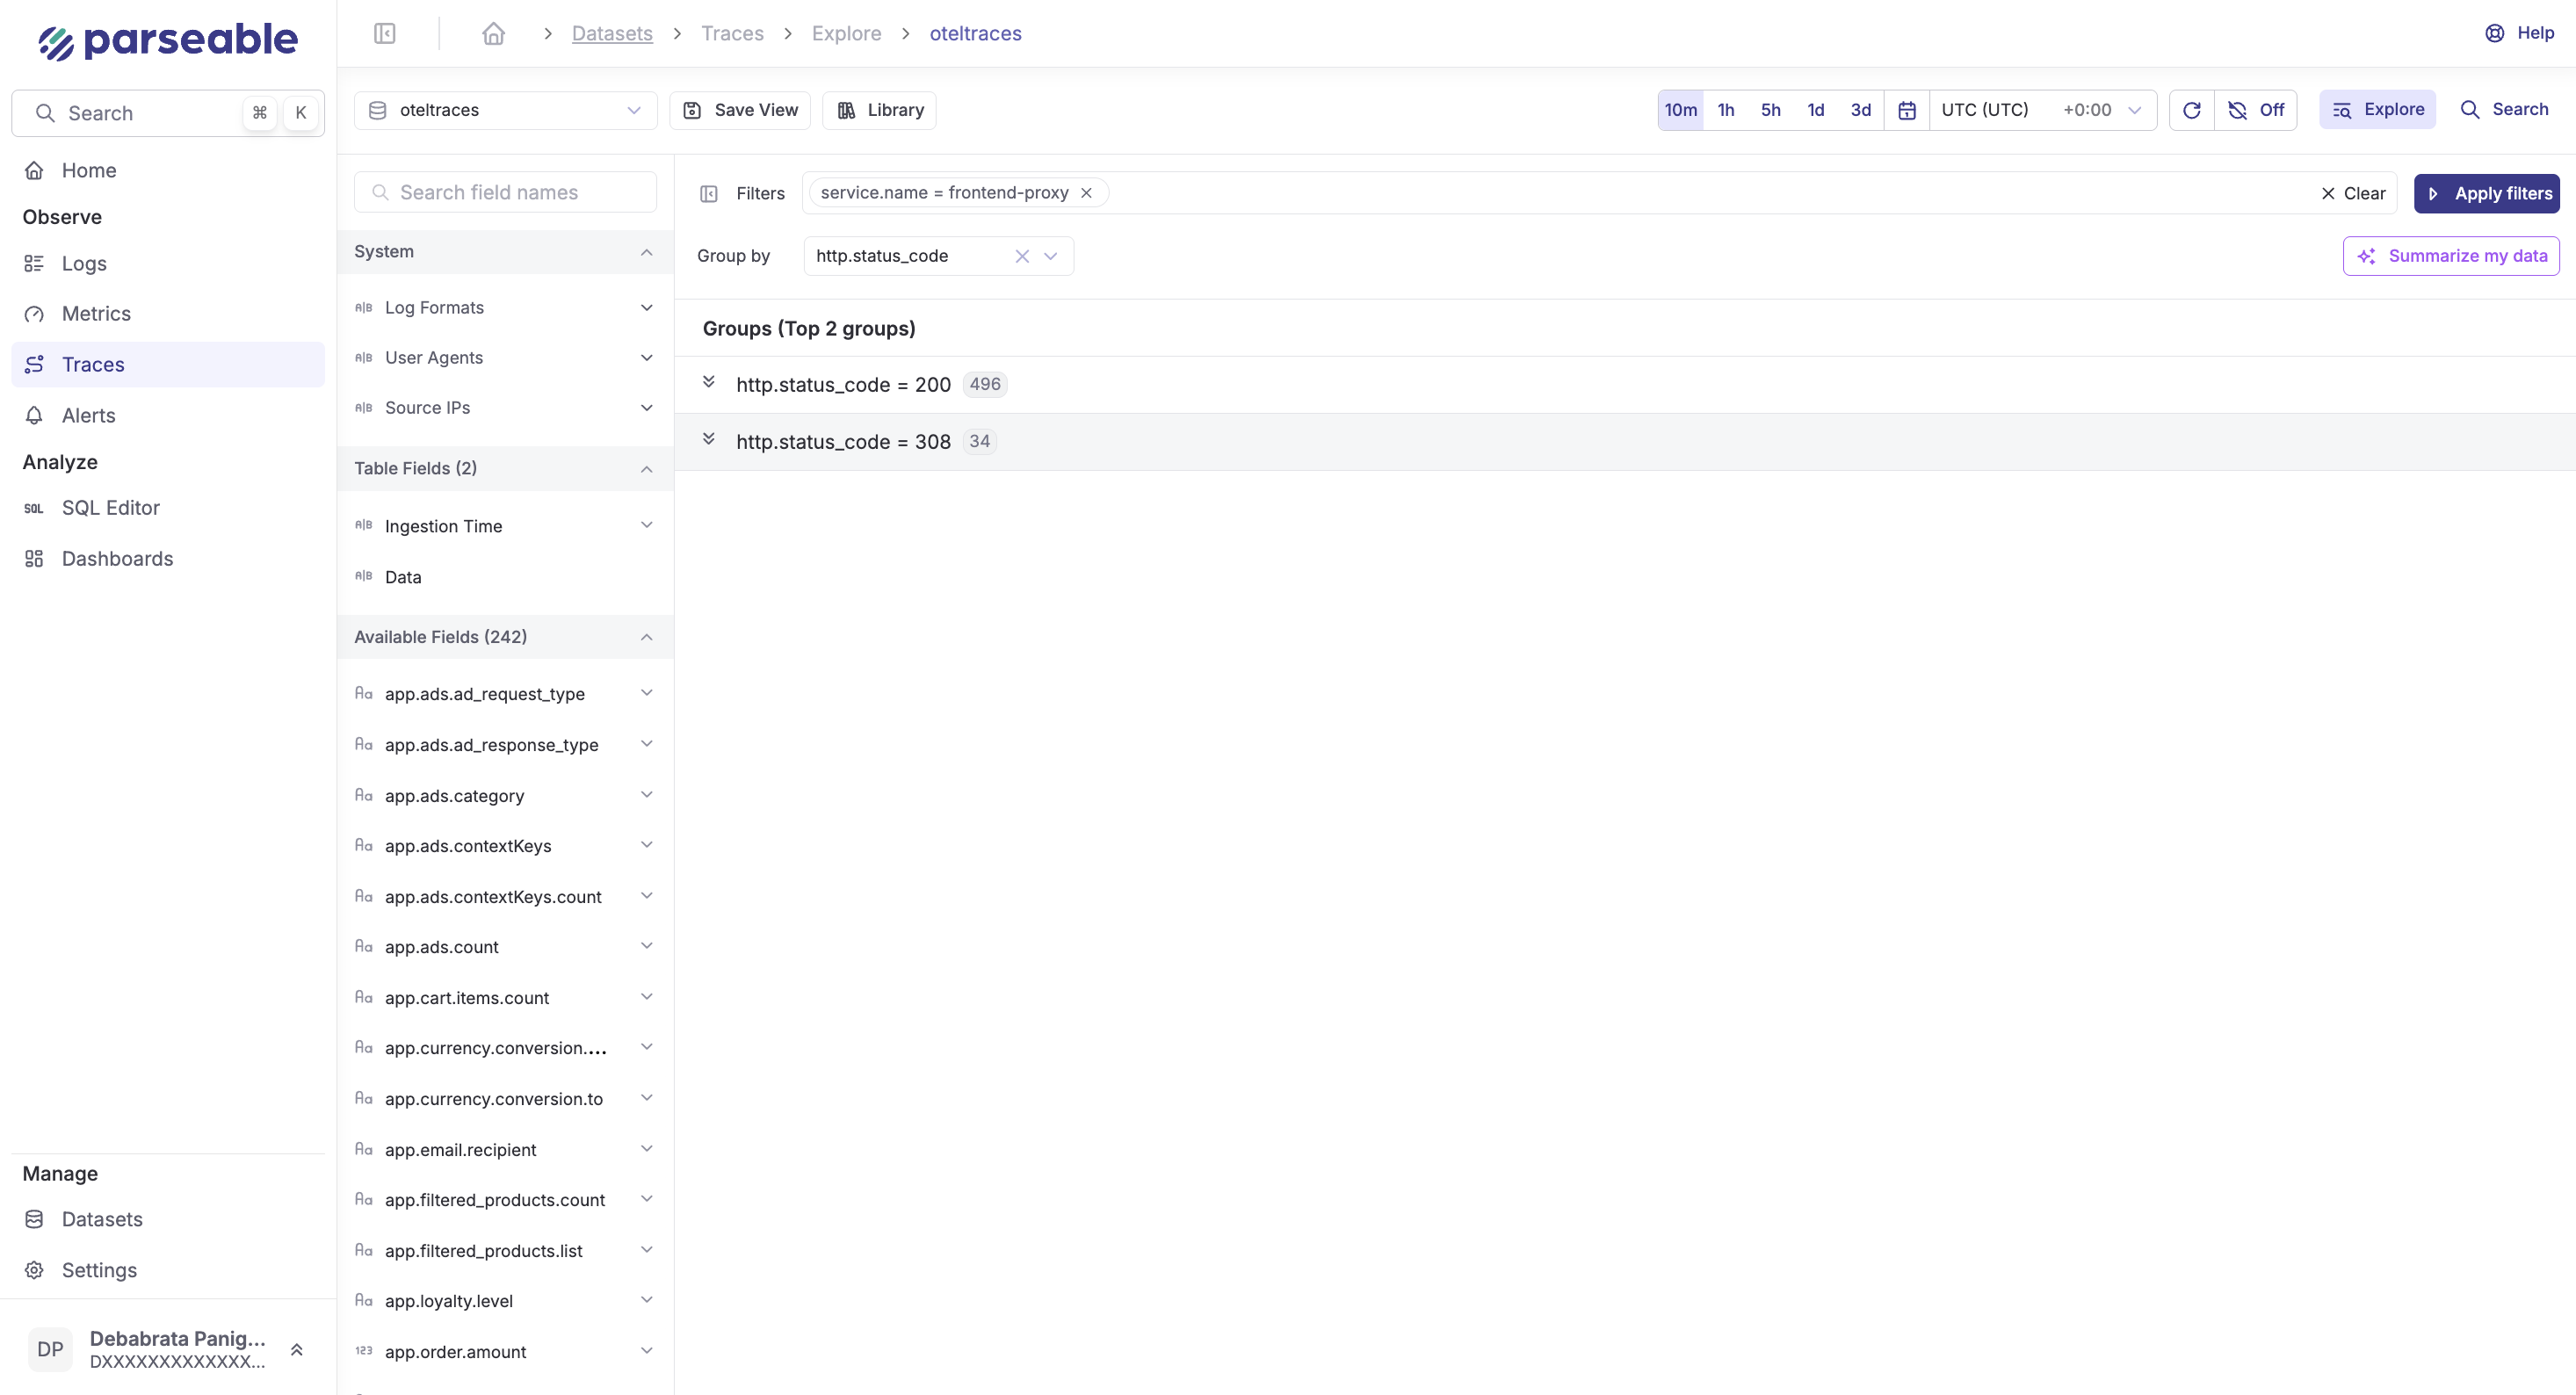
Navigate to Traces tab on the sidenav, and you will get an intutive view of your traces loading the ingestion trend and the detailed traces. Apply filters to search for specific trace messages. For example, you can search for trace messages with service.name=frontend-proxy and group by http_status.code.
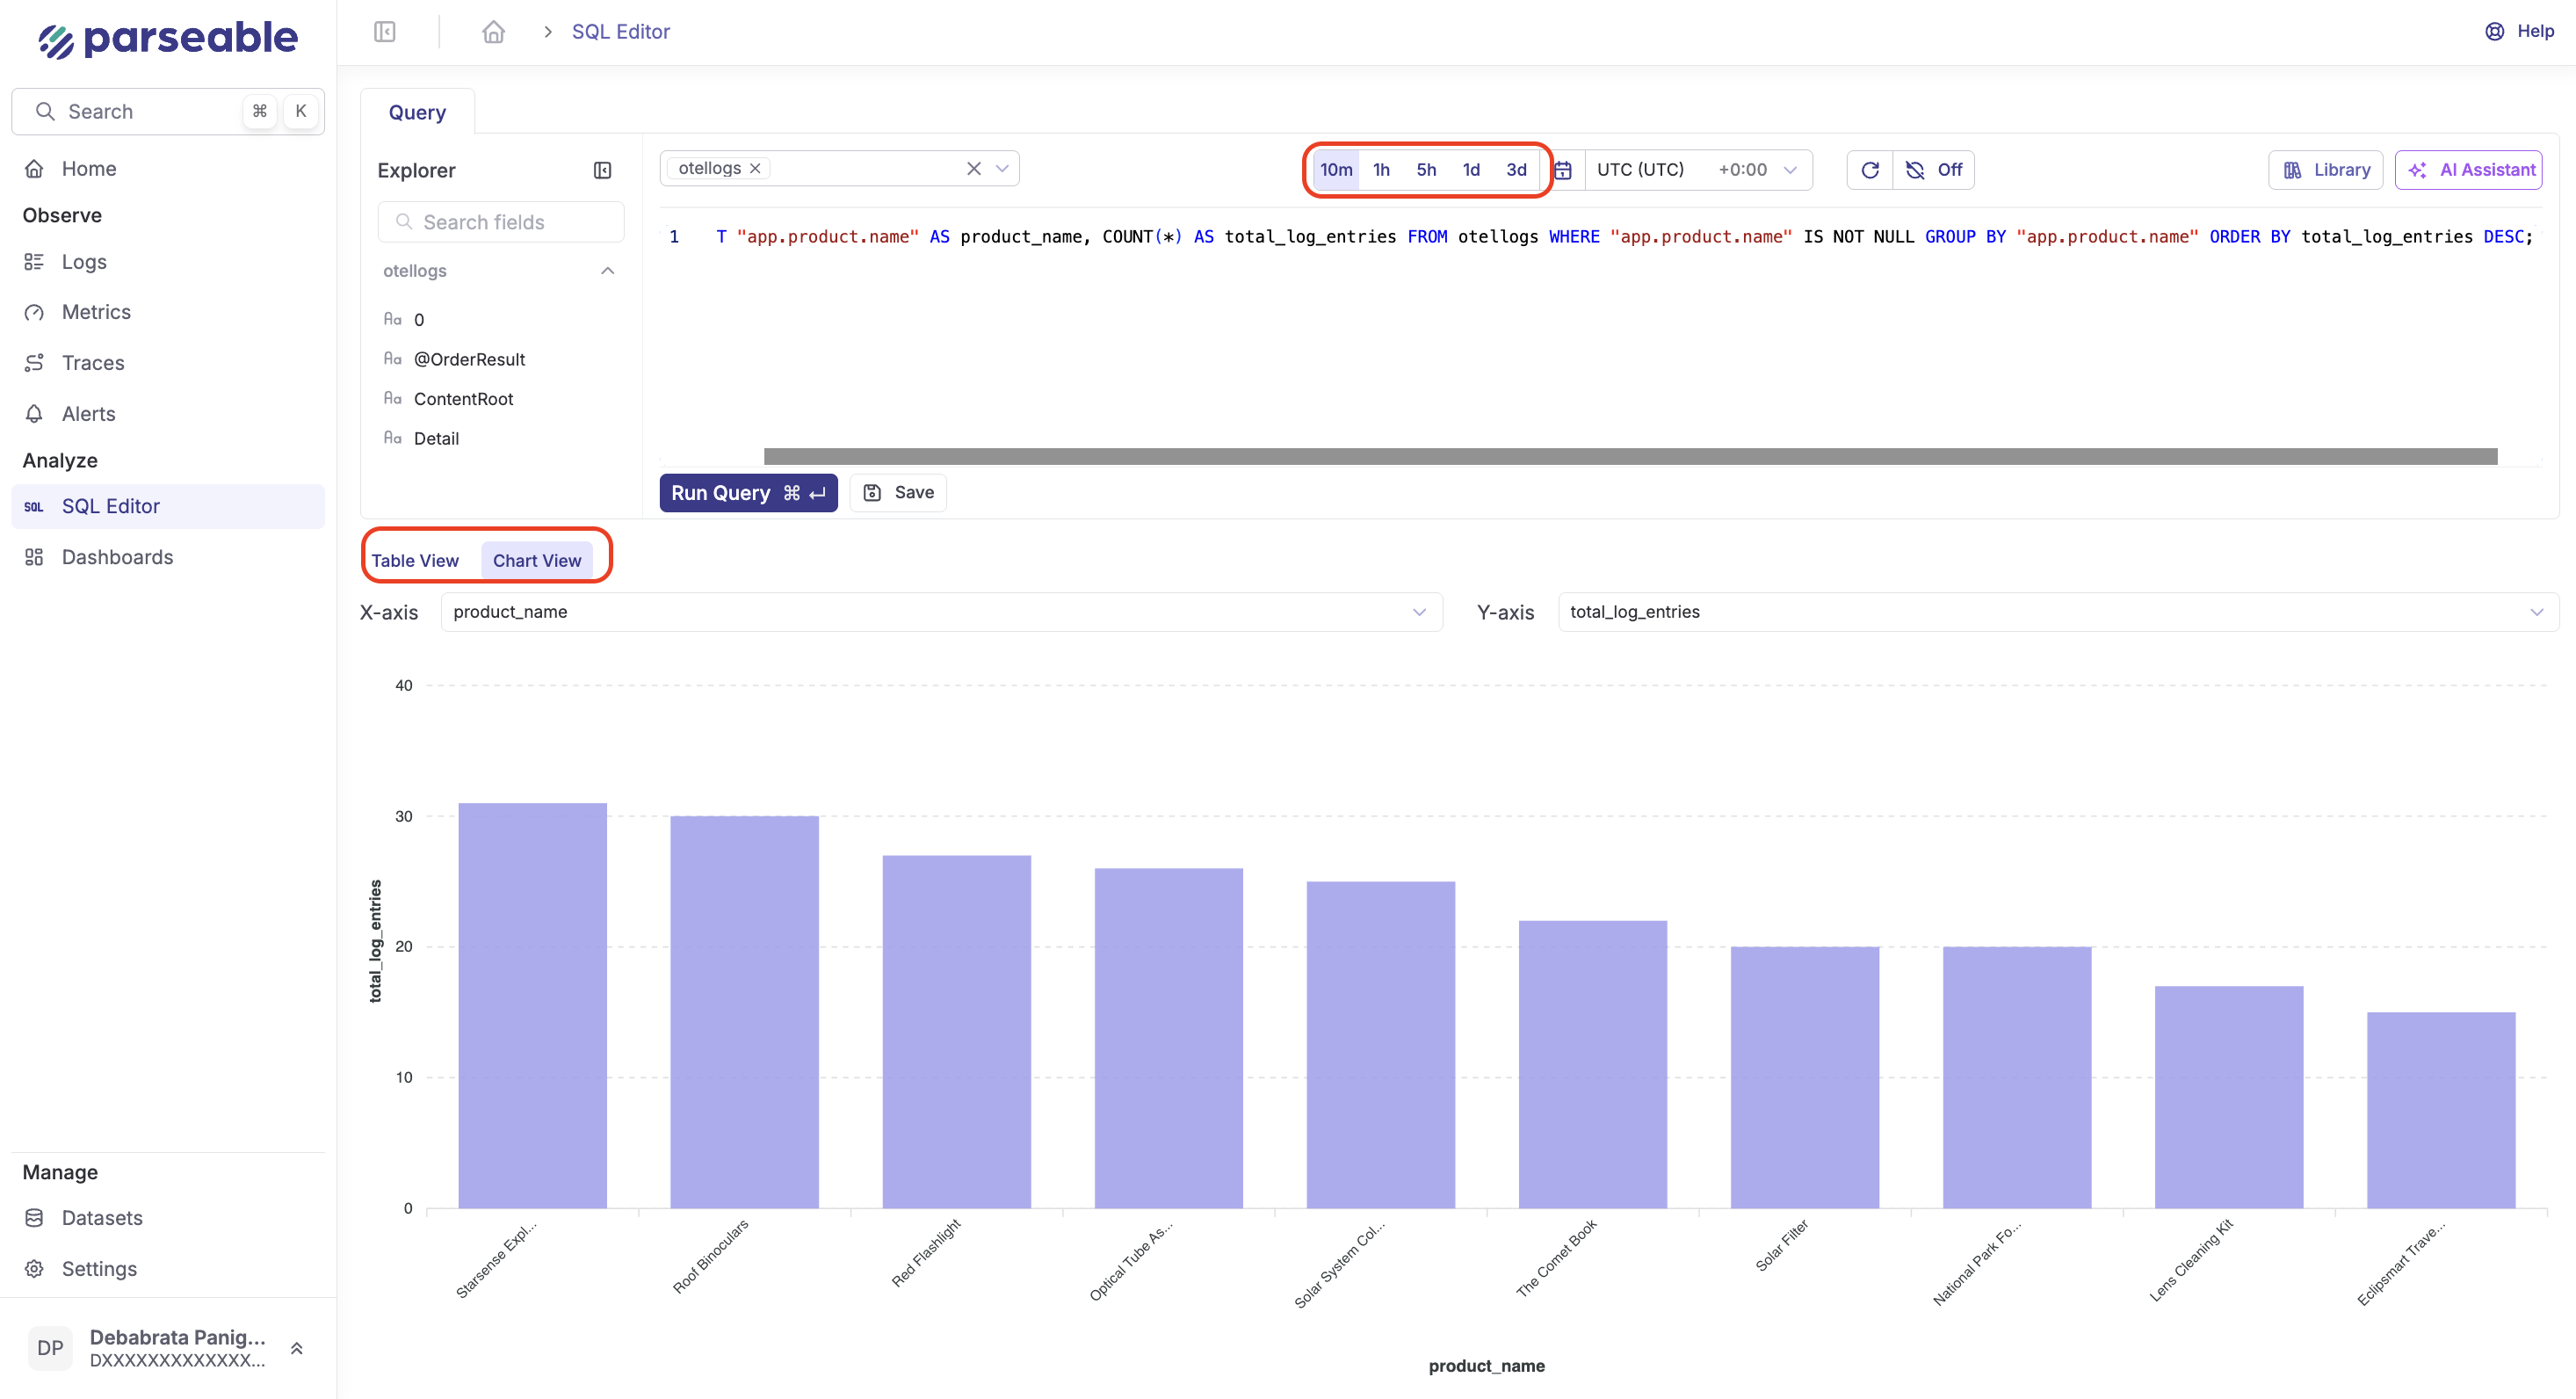
SQL Editor
Leverage Parseable’s SQL editor for advanced analytics:
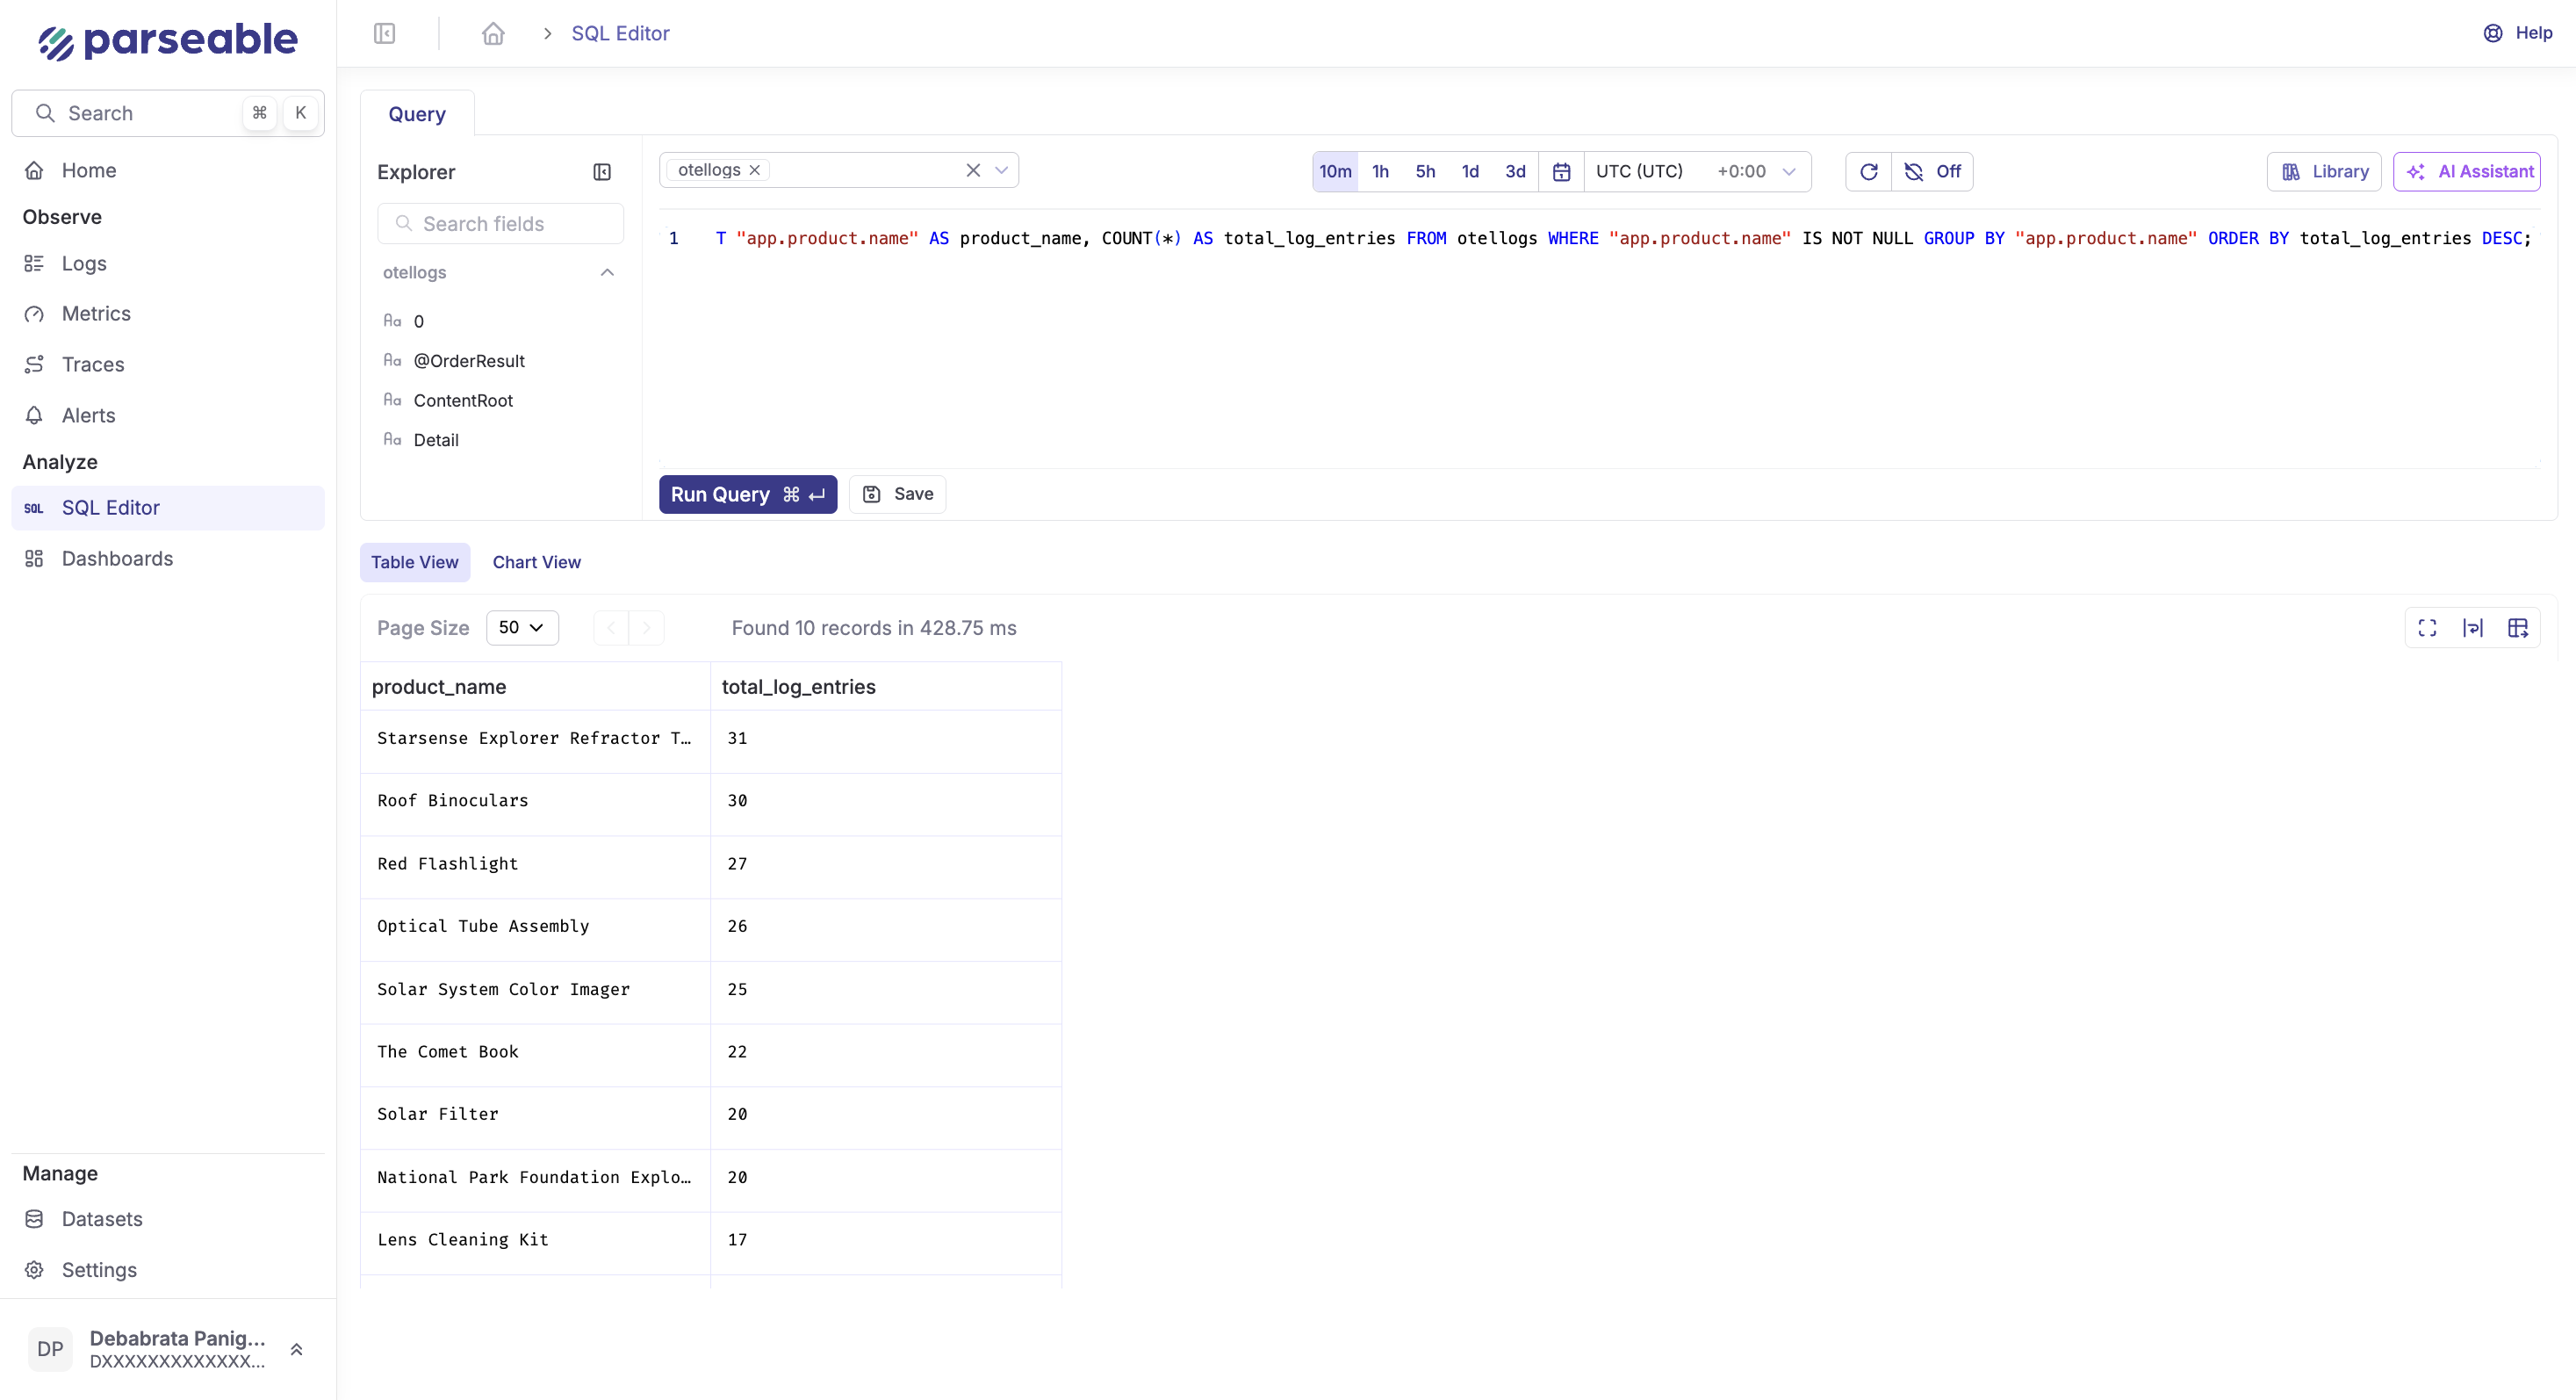
SELECT "app.product.name" AS product_name, COUNT(*) AS total_log_entries FROM otellogs WHERE "app.product.name" IS NOT NULL GROUP BY "app.product.name" ORDER BY total_log_entries DESC;This SQL query groups log entries by the app.product.name field and counts the number of entries for each product. The results are sorted in descending order by the count of log entries, showing which products have the highest number of log entries.
You can run this query across different time ranges, as well as plot a graph based on the query result.
What's Next?
Now that you have the OpenTelemetry Demo running with Parseable, here are some next steps to explore:
Explore AI-Powered Features
Visit the Parseable Demo to see OpenTelemetry data in action with real-time logs, metrics, and traces. Experience Parseable's AI-powered features for observability.
Text-to-SQL Generation
Generate SQL queries from plain English descriptions. In the SQL editor, click the "Generate with AI" button and try these examples with your OTel data:
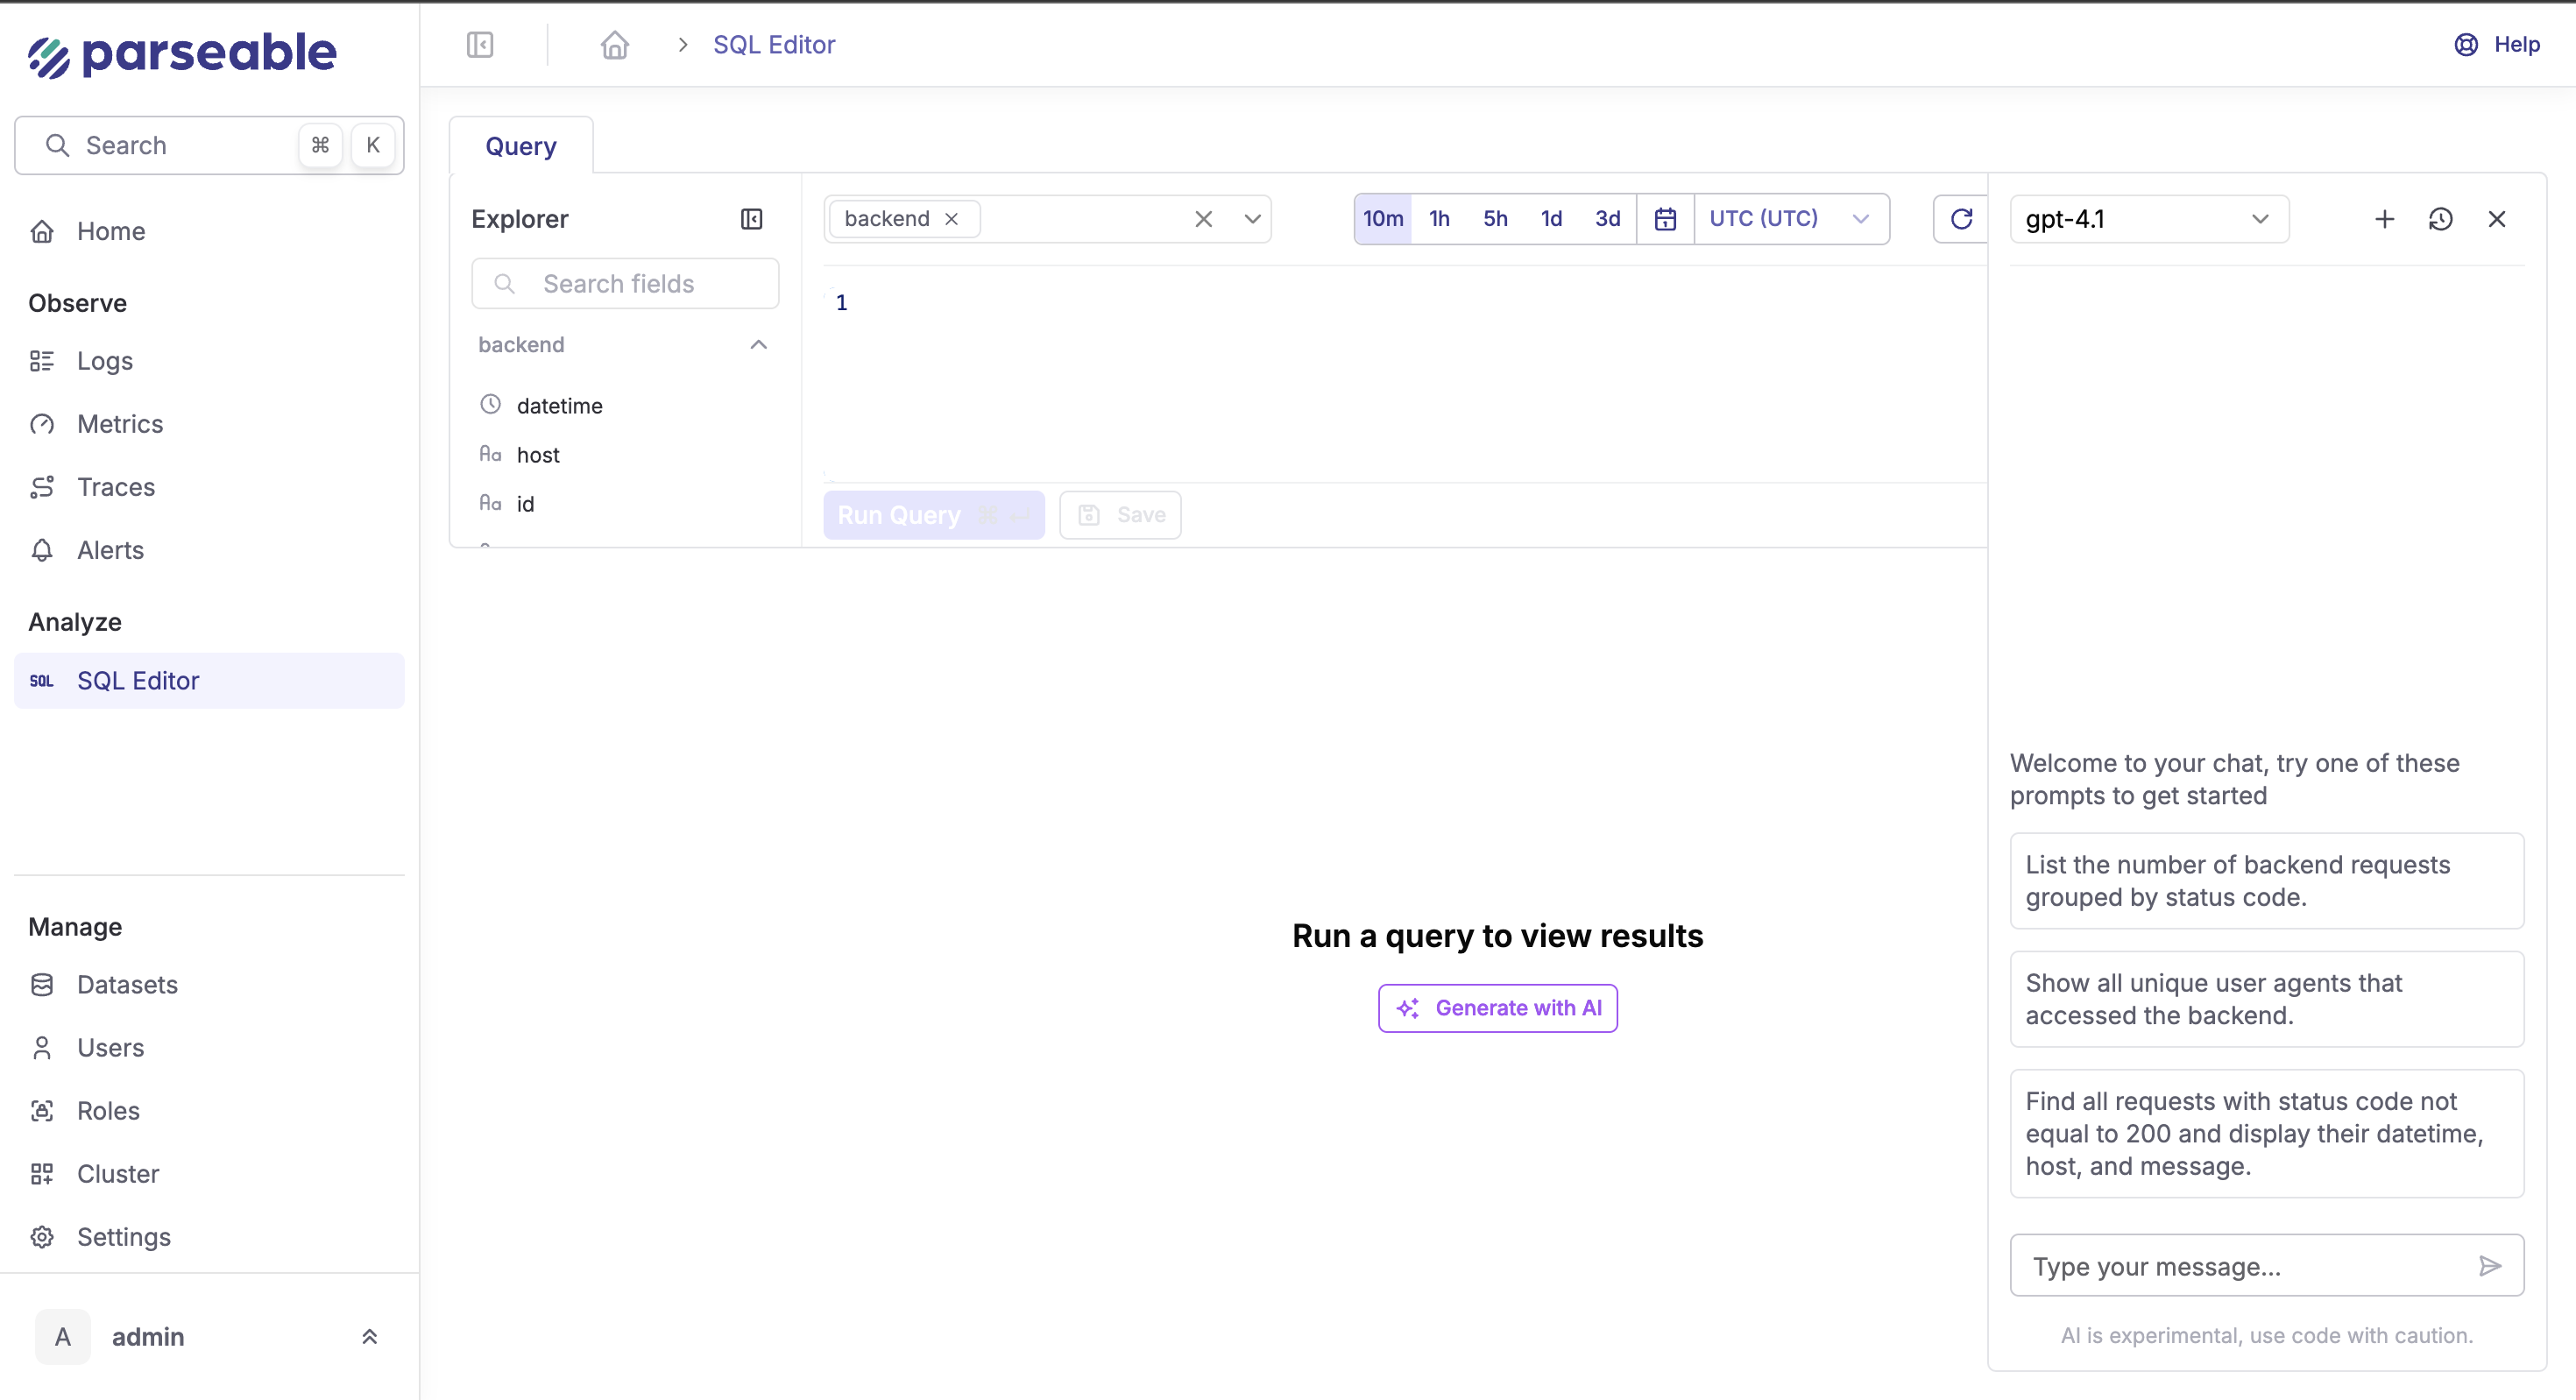
The AI will generate ready-to-run SQL queries that you can execute immediately or modify as needed.
AI Query Assistant
The AI assistant can help you throughout your SQL workflow:
- Write new queries: Ask for complex analytics on your telemetry data
- Fix broken queries: Get syntax errors resolved automatically
- Explain queries: Understand what complex queries do
- Optimize queries: Improve performance and add filters
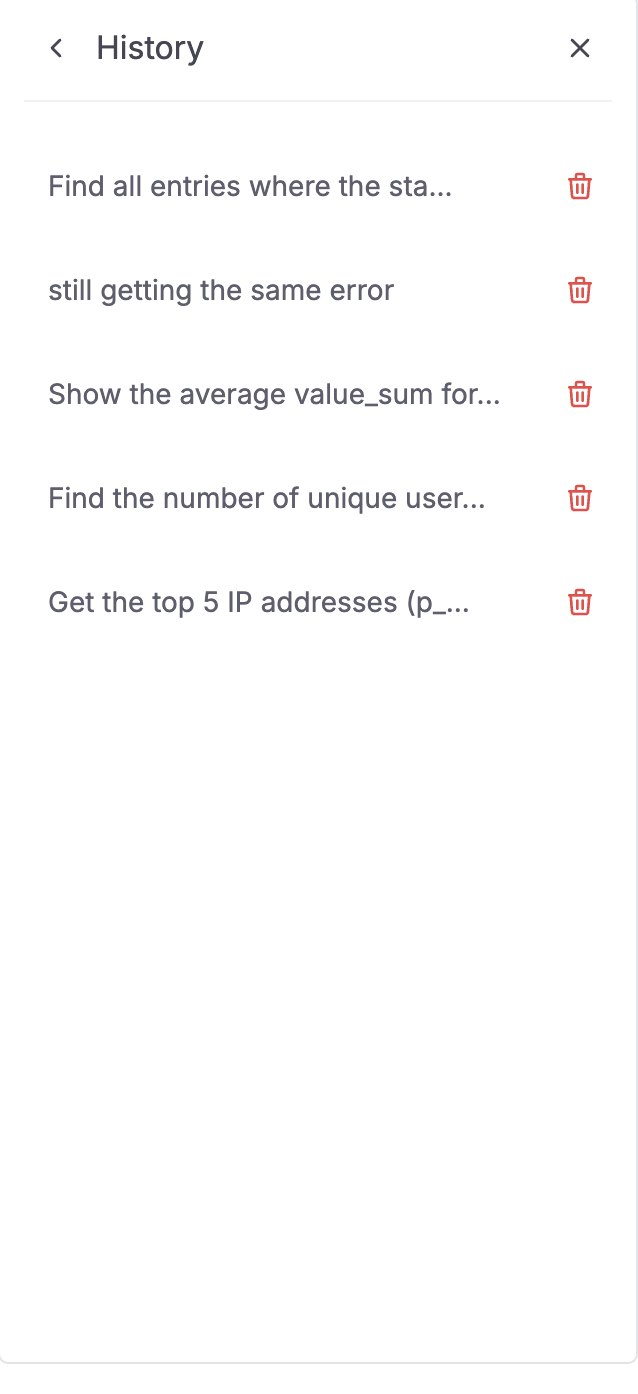
All your conversations are saved in the History tab, making it easy to revisit and reuse previous queries.
Query Library
Save frequently used queries in the Library for quick access:
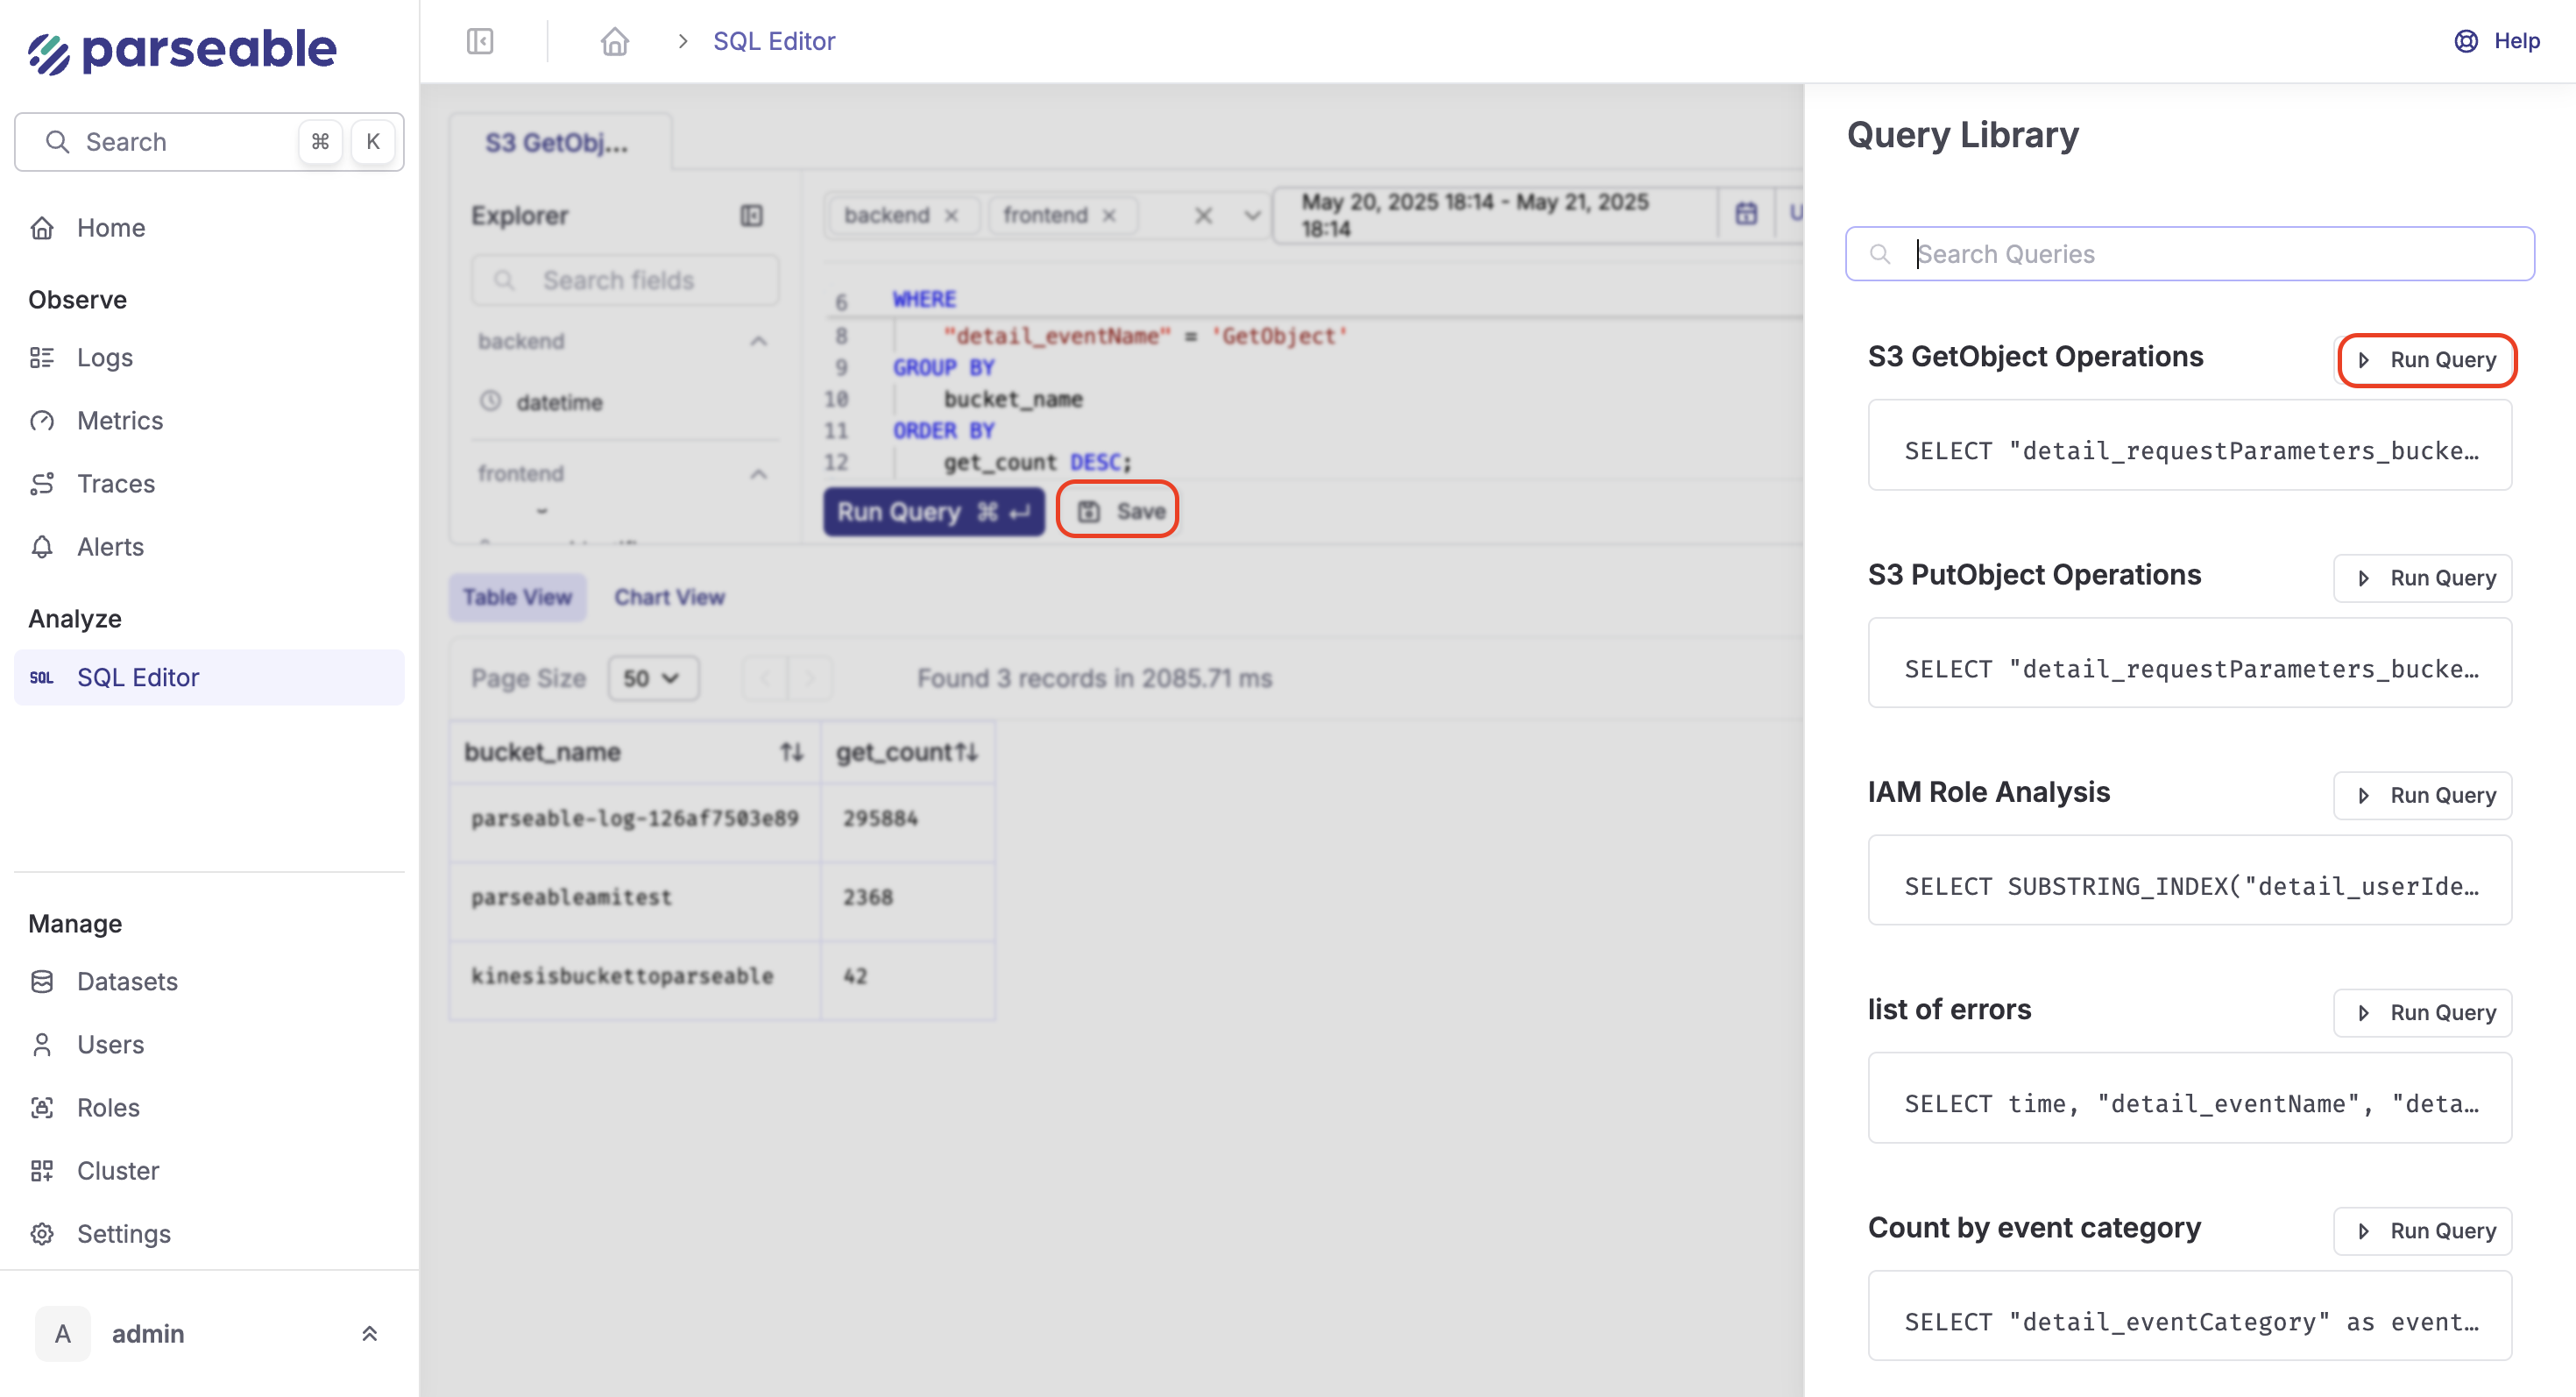
- Store common OTel analysis queries
- Search through your query collection
Auto-Fix Failed Queries
When queries fail, click "Fix with AI" to automatically resolve issues:
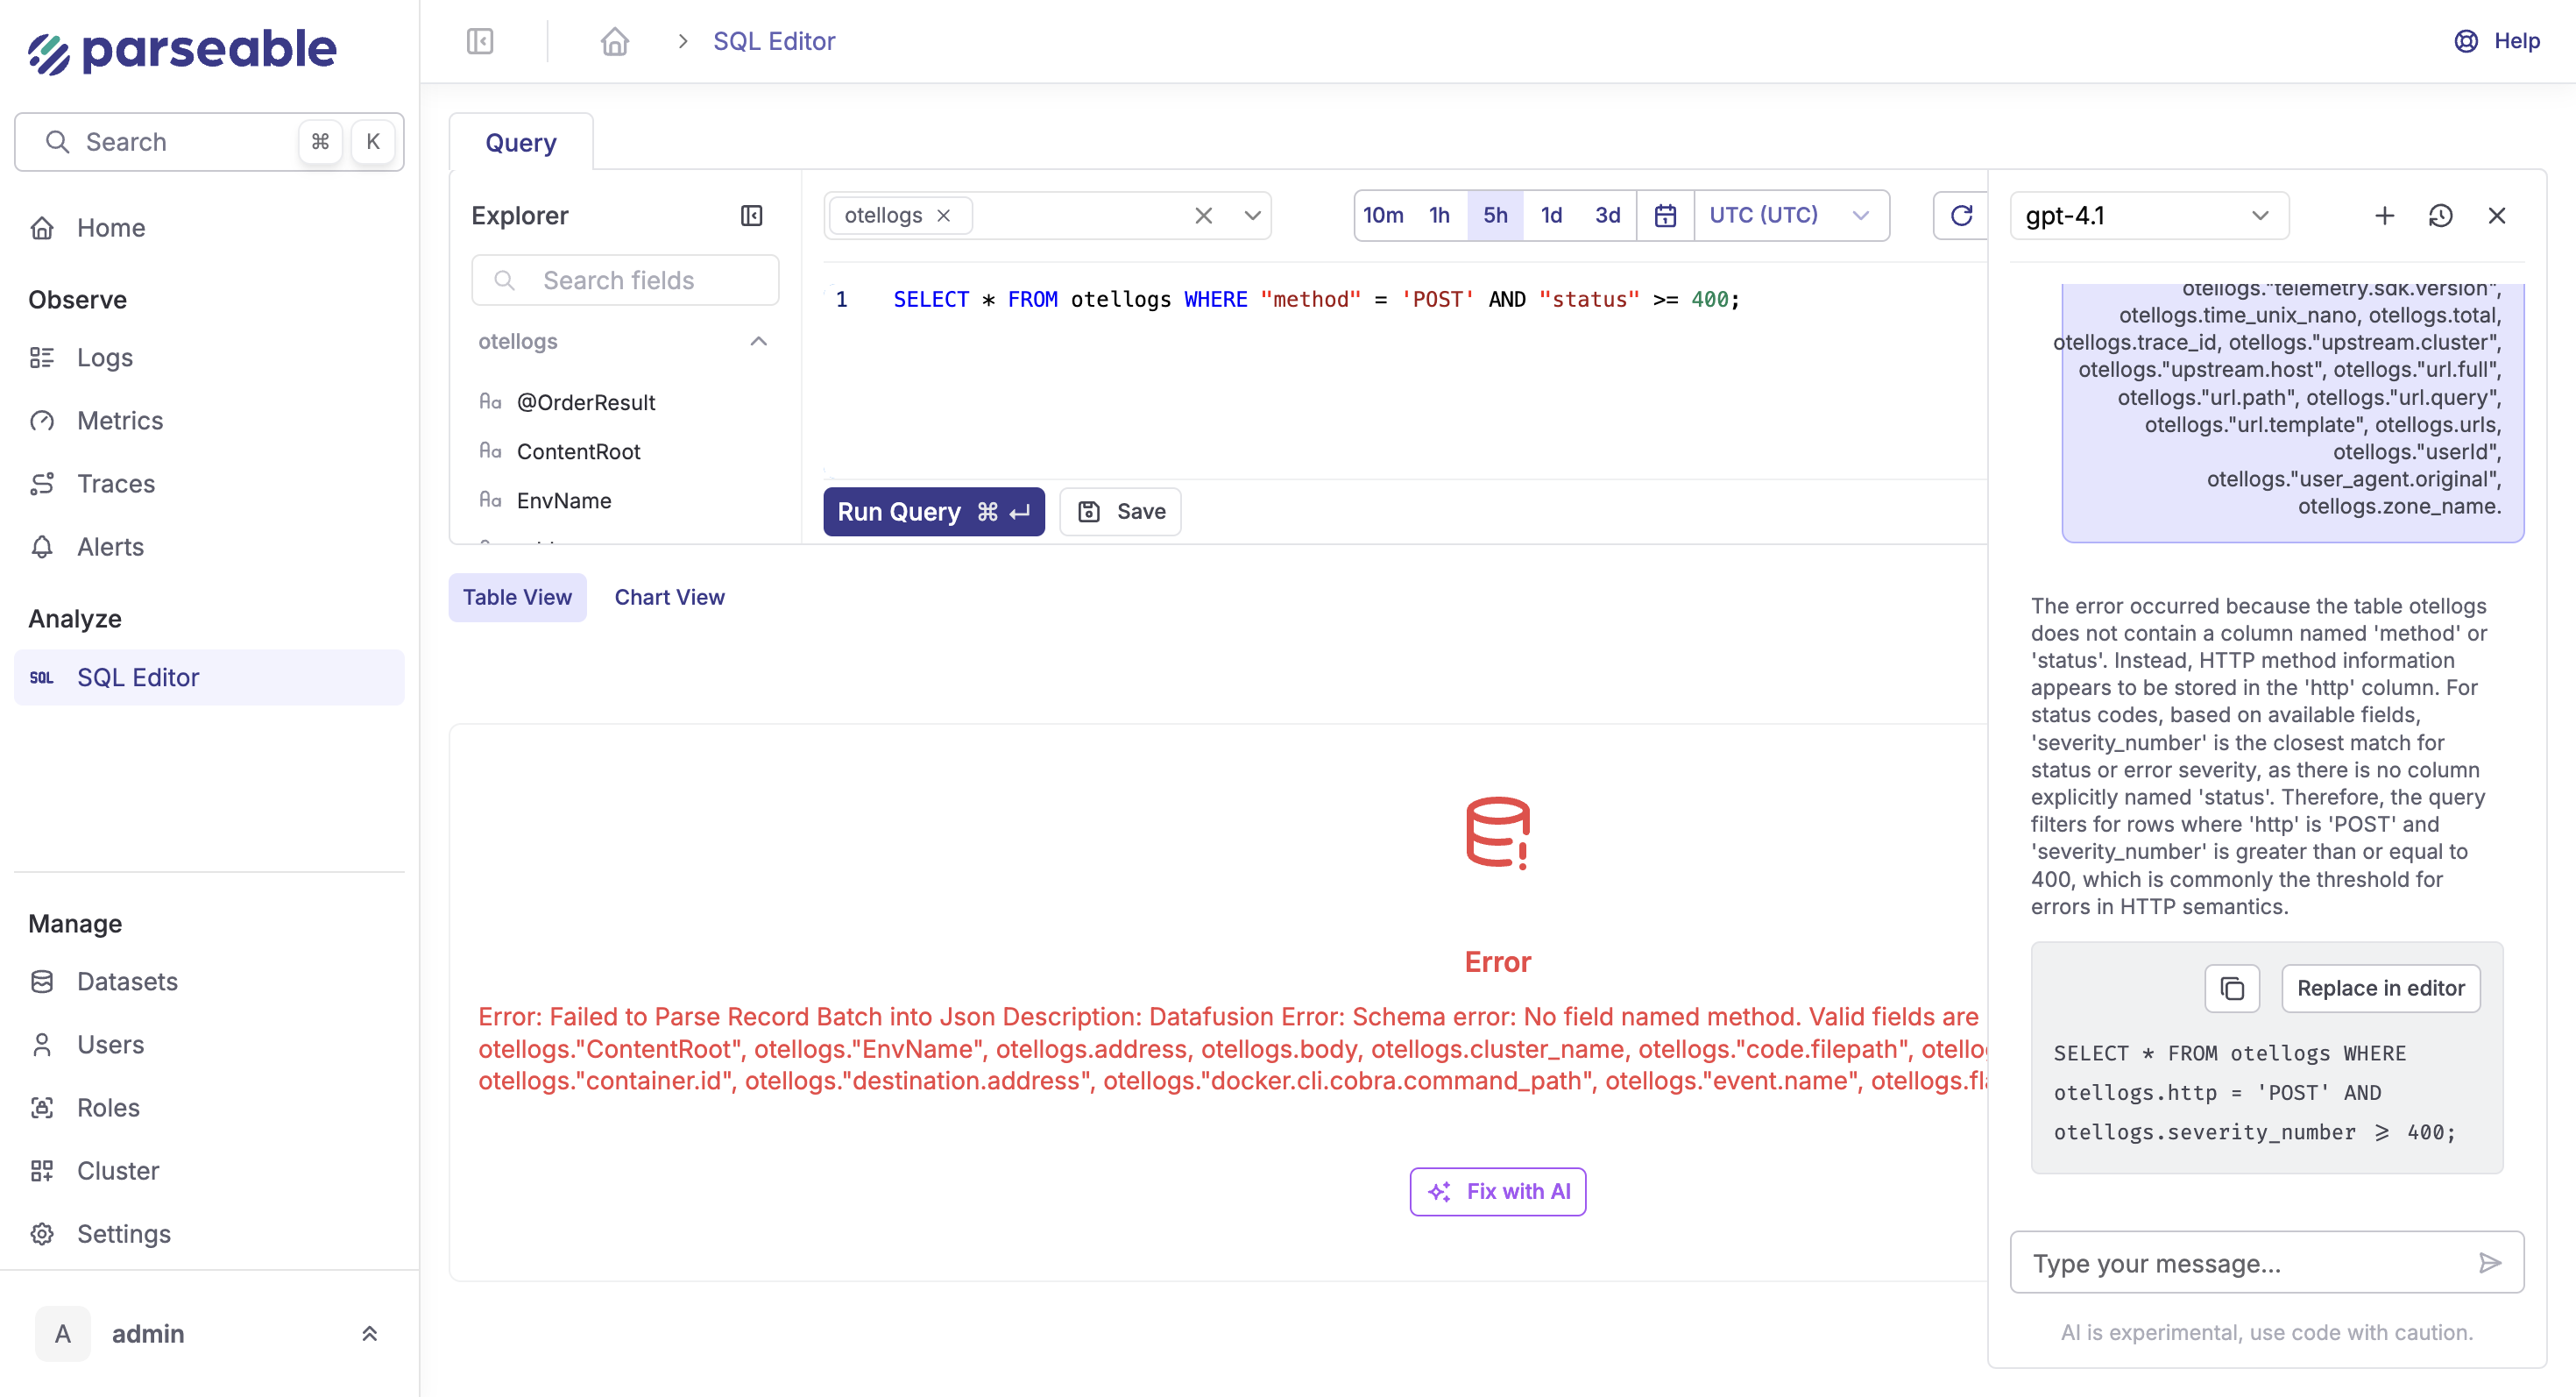
The AI analyzes your schema and corrects common issues like wrong field names, syntax errors, or aggregation problems.
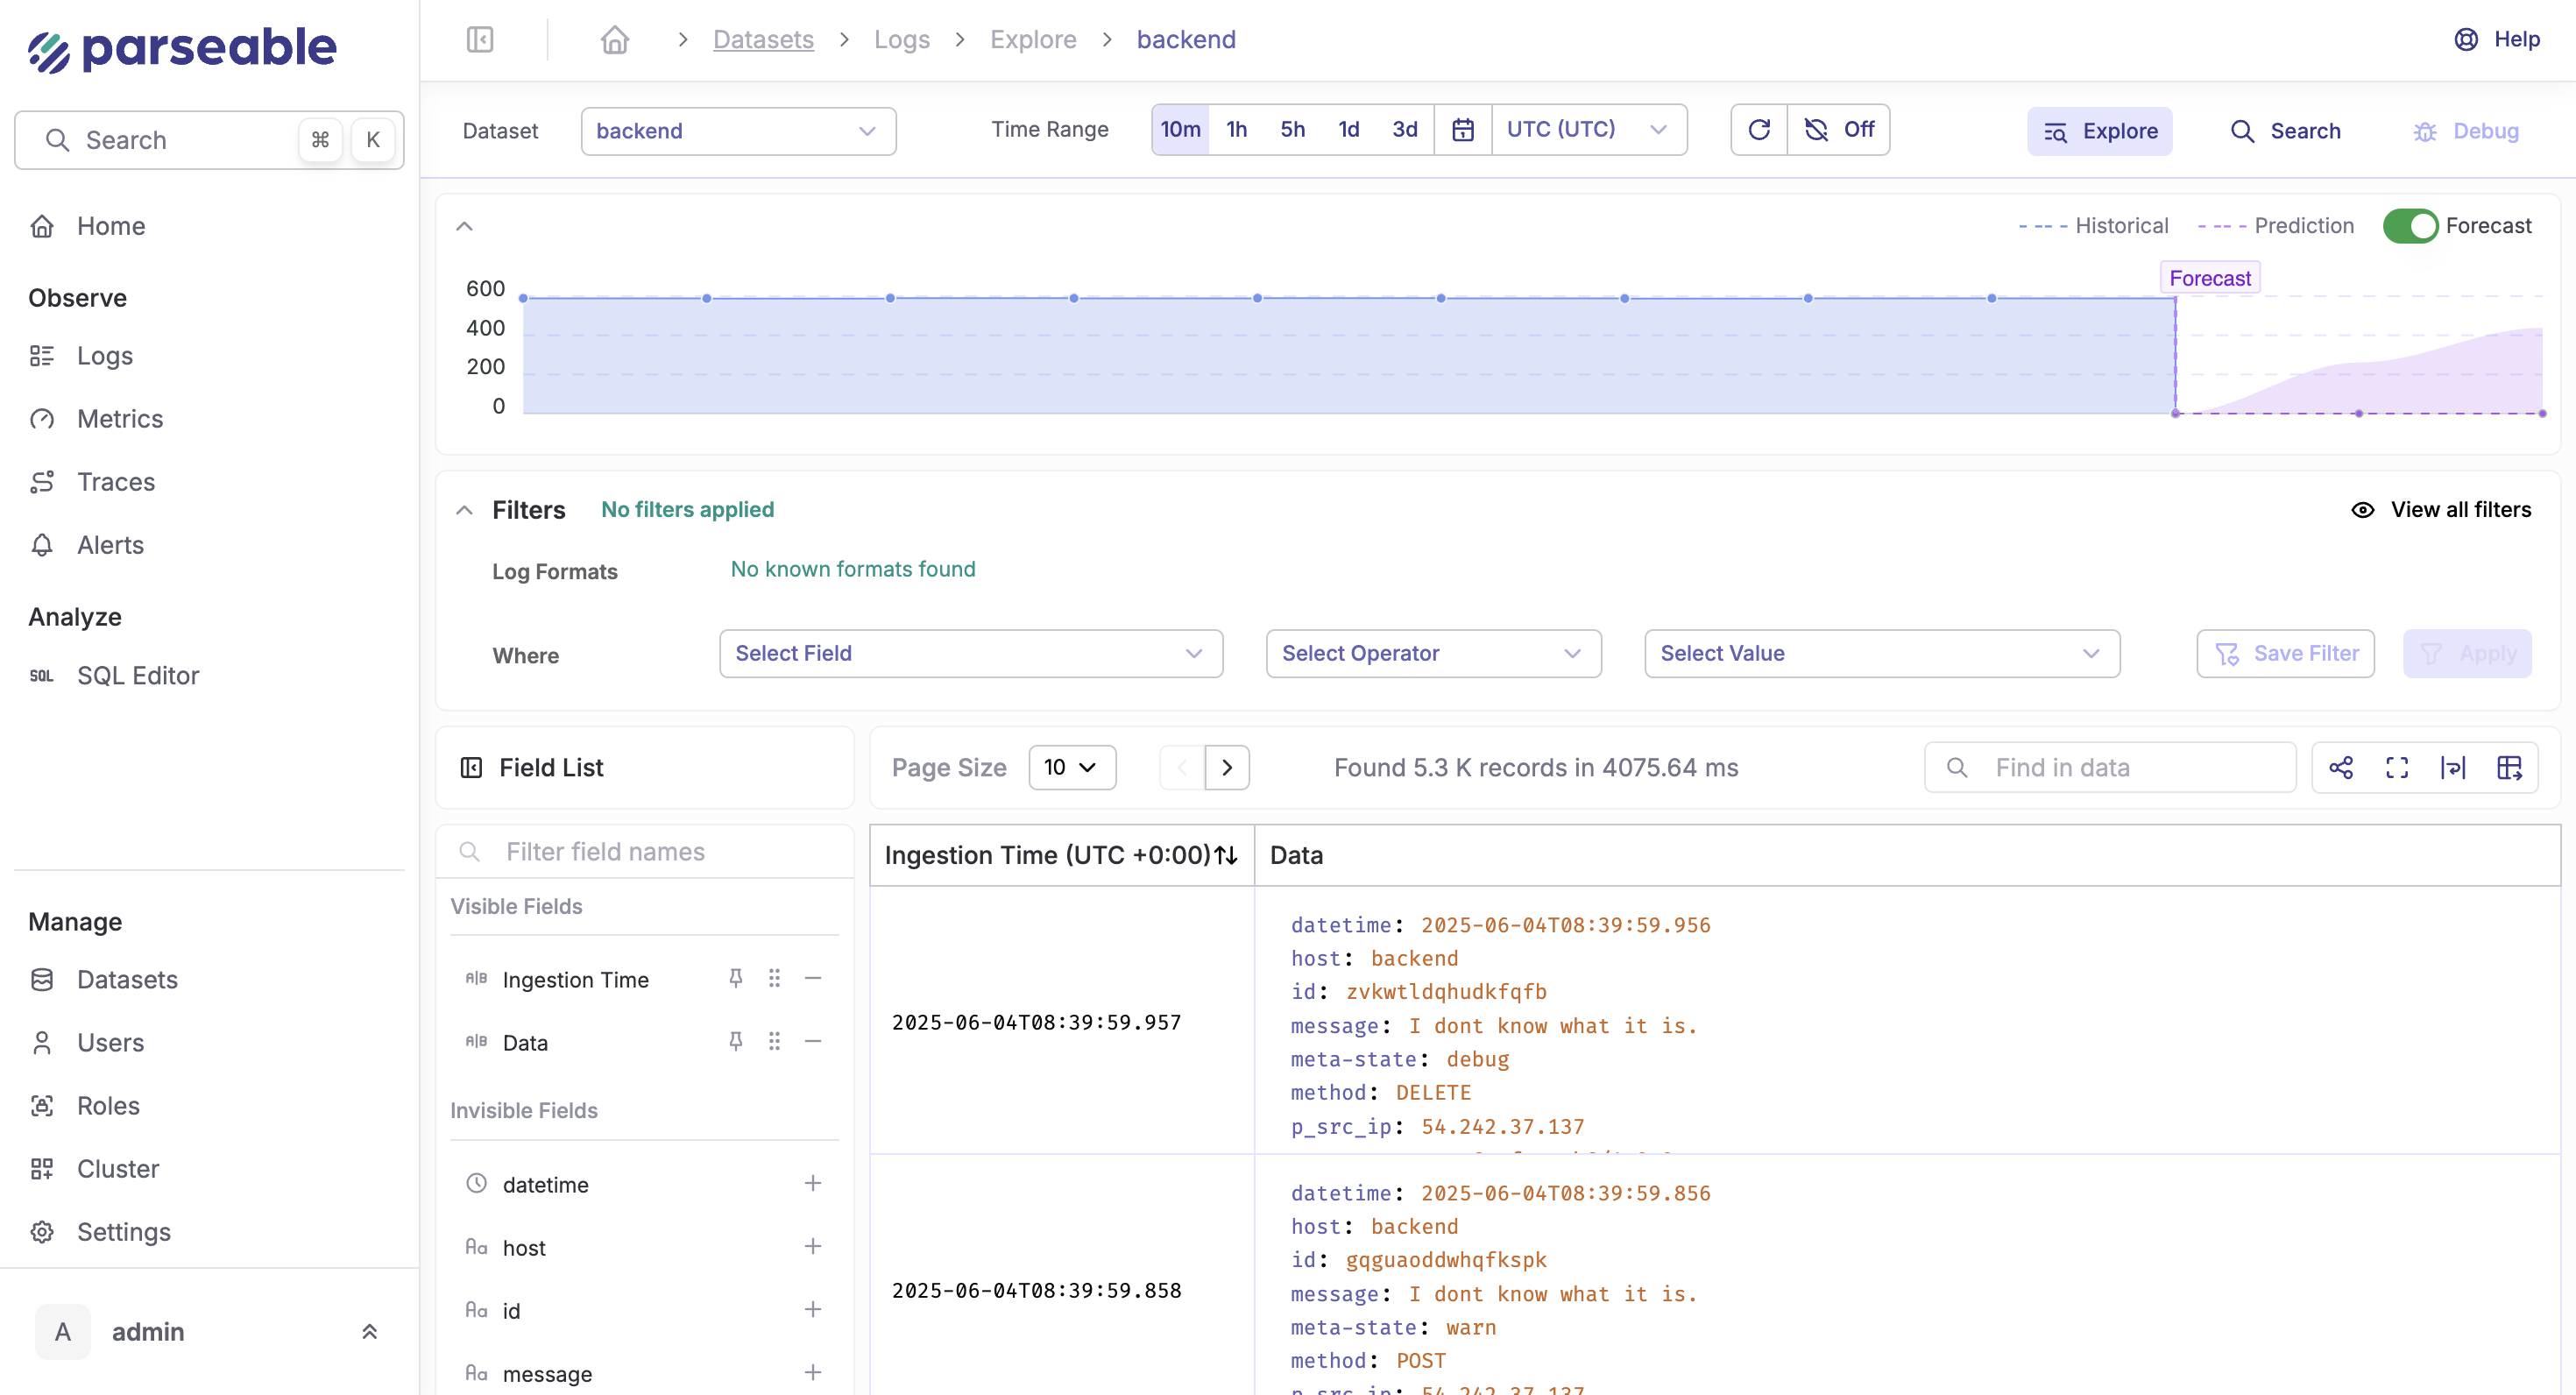
AI-Powered Forecasting
Predict future data volumes and optimize resource allocation based on your OpenTelemetry ingestion patterns:
Data Summarization
Get instant insights from your OpenTelemetry datasets with AI-powered summarization:
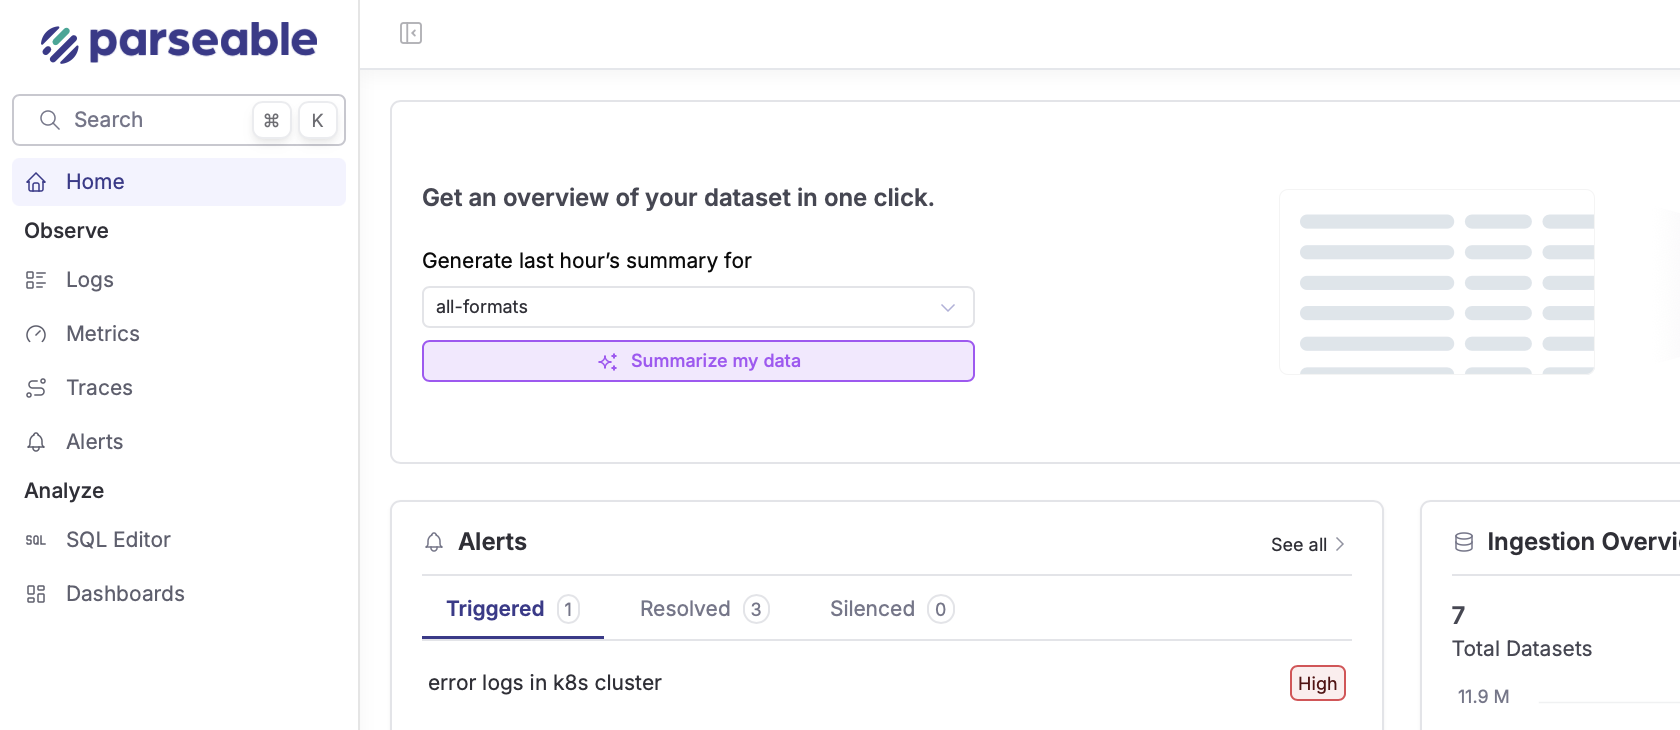
How to use?
- Select any OTel dataset (logs, metrics, or traces)
- Click "Summarize my data"
- Get key patterns, anomalies, and potential issues identified
- Receive actionable recommendations and SQL queries for deeper analysis
Join the Community
Connect with other Parseable users and contributors:
Start your observability journey with Parseable today and experience the power of unified, SQL-first telemetry analysis!