

Introduction
If you’ve ever been paged at 2 a.m. because “the playbook failed” and all you had were fragments of stdout, you already know the pain: Ansible runs can feel like a black box. Which task failed first? What ran right before it? How long did each task take on which host? Why are runs slower this week than last?
This post shows you how to add real observability to Ansible—traces, logs, and (optionally) metrics—without rewriting your playbooks. We’ll instrument Ansible with OpenTelemetry, forward telemetry over OTLP HTTP on port 4318 to an OpenTelemetry Collector, and ship everything into Parseable, a unified, SQL‑first observability backend. By the end, you’ll have a timeline view of your playbooks, task‑level spans with rich context, searchable logs, and a foundation to layer on metrics and SLOs.
What You’ll Build
- A running OpenTelemetry Collector listening on OTLP HTTP 4318 (and gRPC 4317).
- An Ansible callback plugin that emits spans and logs during playbook execution.
- An OTLP/HTTP pipeline to Parseable with per‑signal streams (logs, traces, metrics).
- A clean way to diagnose failures, find slow tasks, and prove improvements over time.
Architecture at a Glance
- Flow: Ansible → OTLP/HTTP (4318) → OpenTelemetry Collector → OTLP/HTTP → Parseable
- Why this pattern works:
- The Collector is a universal switchboard: it receives, batches, enriches, and exports signals.
- OTLP HTTP (4318) is widely supported, simple to secure, and easy to route in containers.
- Parseable keeps everything in one place and speaks SQL, so investigations are fast.
Why Your Ansible Runs Feel Like a Black Box
- No timeline: stdout shows messages, not causality. Without spans, it’s hard to tell what happened when.
- Slow task blindness: the “why is this playbook 30% slower?” question is nearly impossible to answer at scale.
- Fragmented logs: logs live in files and terminals across build servers and local machines, making it difficult to search systematically.
- Poor handoffs: postmortems rely on ad hoc screenshots and tribal context instead of shared, queryable telemetry.
With OpenTelemetry and Parseable, your playbook becomes a first‑class observable workload:
- Traces give structure to the run (playbook span → task spans) and surface the slow path.
- Logs attach detailed context like
task.name,host.name, andtask.status. - Metrics (optional) help track volume, duration, and failure rates over time.
Prerequisites
- Ansible 2.13+ and Python 3.10+
- Podman or Docker
- A Parseable endpoint (local or remote) with credentials
- Basic familiarity with OpenTelemetry (receivers/exporters) and OTLP HTTP 4318
Quick Start
- Clone the repo and prepare the environment:
git clone https://github.com/parseablehq/ansible-otel-demo
cd ansible-otel-demo
cp .env.example .env
- Start the Collector:
podman compose up -d
curl -s -o /dev/null -w "%{http_code}\n" http://localhost:4318  # quick check
- Run the Ansible demo:
cd ansible
python -m venv .venv && source .venv/bin/activate
pip install -r requirements.txt
ansible-playbook -i inventory.ini site.yml
- Verify in Parseable:
- Open the Parseable UI.
- Verify logs in stream
otel-logs. - Verify traces in stream
otel-traces.
Step-by-Step Setup
Configure the OpenTelemetry Collector
- Full file: otel-config.yaml
- What it does:
- Receives OTLP on HTTP 4318 and gRPC 4317.
- Batches for efficiency and optionally sets
service.namevia theresourceprocessor. - Exports traces, logs, and metrics to Parseable with
X‑P‑Streamheaders and Basic Auth.
- Minimal snippet:
receivers:
  otlp:
    protocols:
      http:
        endpoint: 0.0.0.0:4318

exporters:
  otlphttp/parseabletraces:
    endpoint: ${env:PARSEABLE_ENDPOINT}
    headers:
      Authorization: "Basic ${env:PARSEABLE_BASIC_AUTH_B64}"

service:
  pipelines:
    traces:
      receivers: [otlp]
      exporters: [otlphttp/parseabletraces]
Note:
- Keep JSON encoding for compatibility.
- Use separate
X‑P‑Streamper signal (logs/traces/metrics) to keep datasets clean. - Use TLS (enable in Parseable) and avoid
insecure: trueoutside of local dev.
Prepare environment variables
- Full file: .env.example
- Important keys:
OTEL_SERVICE_NAME(e.g.,ansible-playbook-demo)PARSEABLE_ENDPOINT(e.g.,http://localhost:8000/api/v1/ingest)PARSEABLE_BASIC_AUTH_B64(base64 ofusername:password)- Streams:
PARSEABLE_LOGS_STREAM,PARSEABLE_TRACES_STREAM,PARSEABLE_METRICS_STREAM
- Minimal snippet:
OTEL_SERVICE_NAME=ansible-playbook-demo
PARSEABLE_ENDPOINT=http://localhost:8000/api/v1/ingest
PARSEABLE_BASIC_AUTH_B64=REPLACE_ME_BASE64
Security note:
- Generate the Basic Auth header safely:
echo -n 'user:pass' | base64 - Prefer HTTPS for production endpoints.
Run the Collector
- Full file: compose.yaml
- What this does:
- Mounts
otel-config.yamlinto the Collector container - Makes OTLP ports 4317/4318 available to your host
- Loads
.envfor endpoint, auth, streams, and service name
- Mounts
- Minimal snippet:
services:
  otel-collector:
    ports:
      - "4317:4317"  # OTLP gRPC
      - "4318:4318"  # OTLP HTTP
Commands:
podman compose up -d
# or
docker compose up -d

curl -s -o /dev/null -w "%{http_code}\n" http://localhost:4318
podman compose logs -f  # review logs if needed
Add the Ansible callback plugin (OpenTelemetry)
- Full plugin: otel.py
- What it emits:
- A top‑level "playbook" span with attributes like
playbook.file - Per‑task spans with
task.name,task.action,task.status,host.name - Log records for lifecycle moments:
playbook_start,task_start,task_end,playbook_end
- A top‑level "playbook" span with attributes like
- Minimal snippet:
CALLBACK_NAME = 'otel'
# Default OTLP endpoints (override via env if needed)
endpoint=os.getenv("OTEL_EXPORTER_OTLP_TRACES_ENDPOINT", "http://localhost:4318/v1/traces")
endpoint=os.getenv("OTEL_EXPORTER_OTLP_LOGS_ENDPOINT", "http://localhost:4318/v1/logs")
Why a callback plugin?
- No need to modify every task or role
- Centralized, consistent telemetry across all playbooks
- Easy to version and deploy across teams
Wire up your Ansible project
- Files:
ansible.cfg: ansible/ansible.cfginventory.ini: ansible/inventory.inisite.yml: ansible/site.ymlrequirements.txt: ansible/requirements.txt
- What matters in config:
[defaults]
callbacks_enabled = otel
callback_plugins = ./callback_plugins
Run it:
cd ansible
python -m venv .venv && source .venv/bin/activate
pip install -r requirements.txt
ansible --version
ansible-playbook -i inventory.ini site.yml
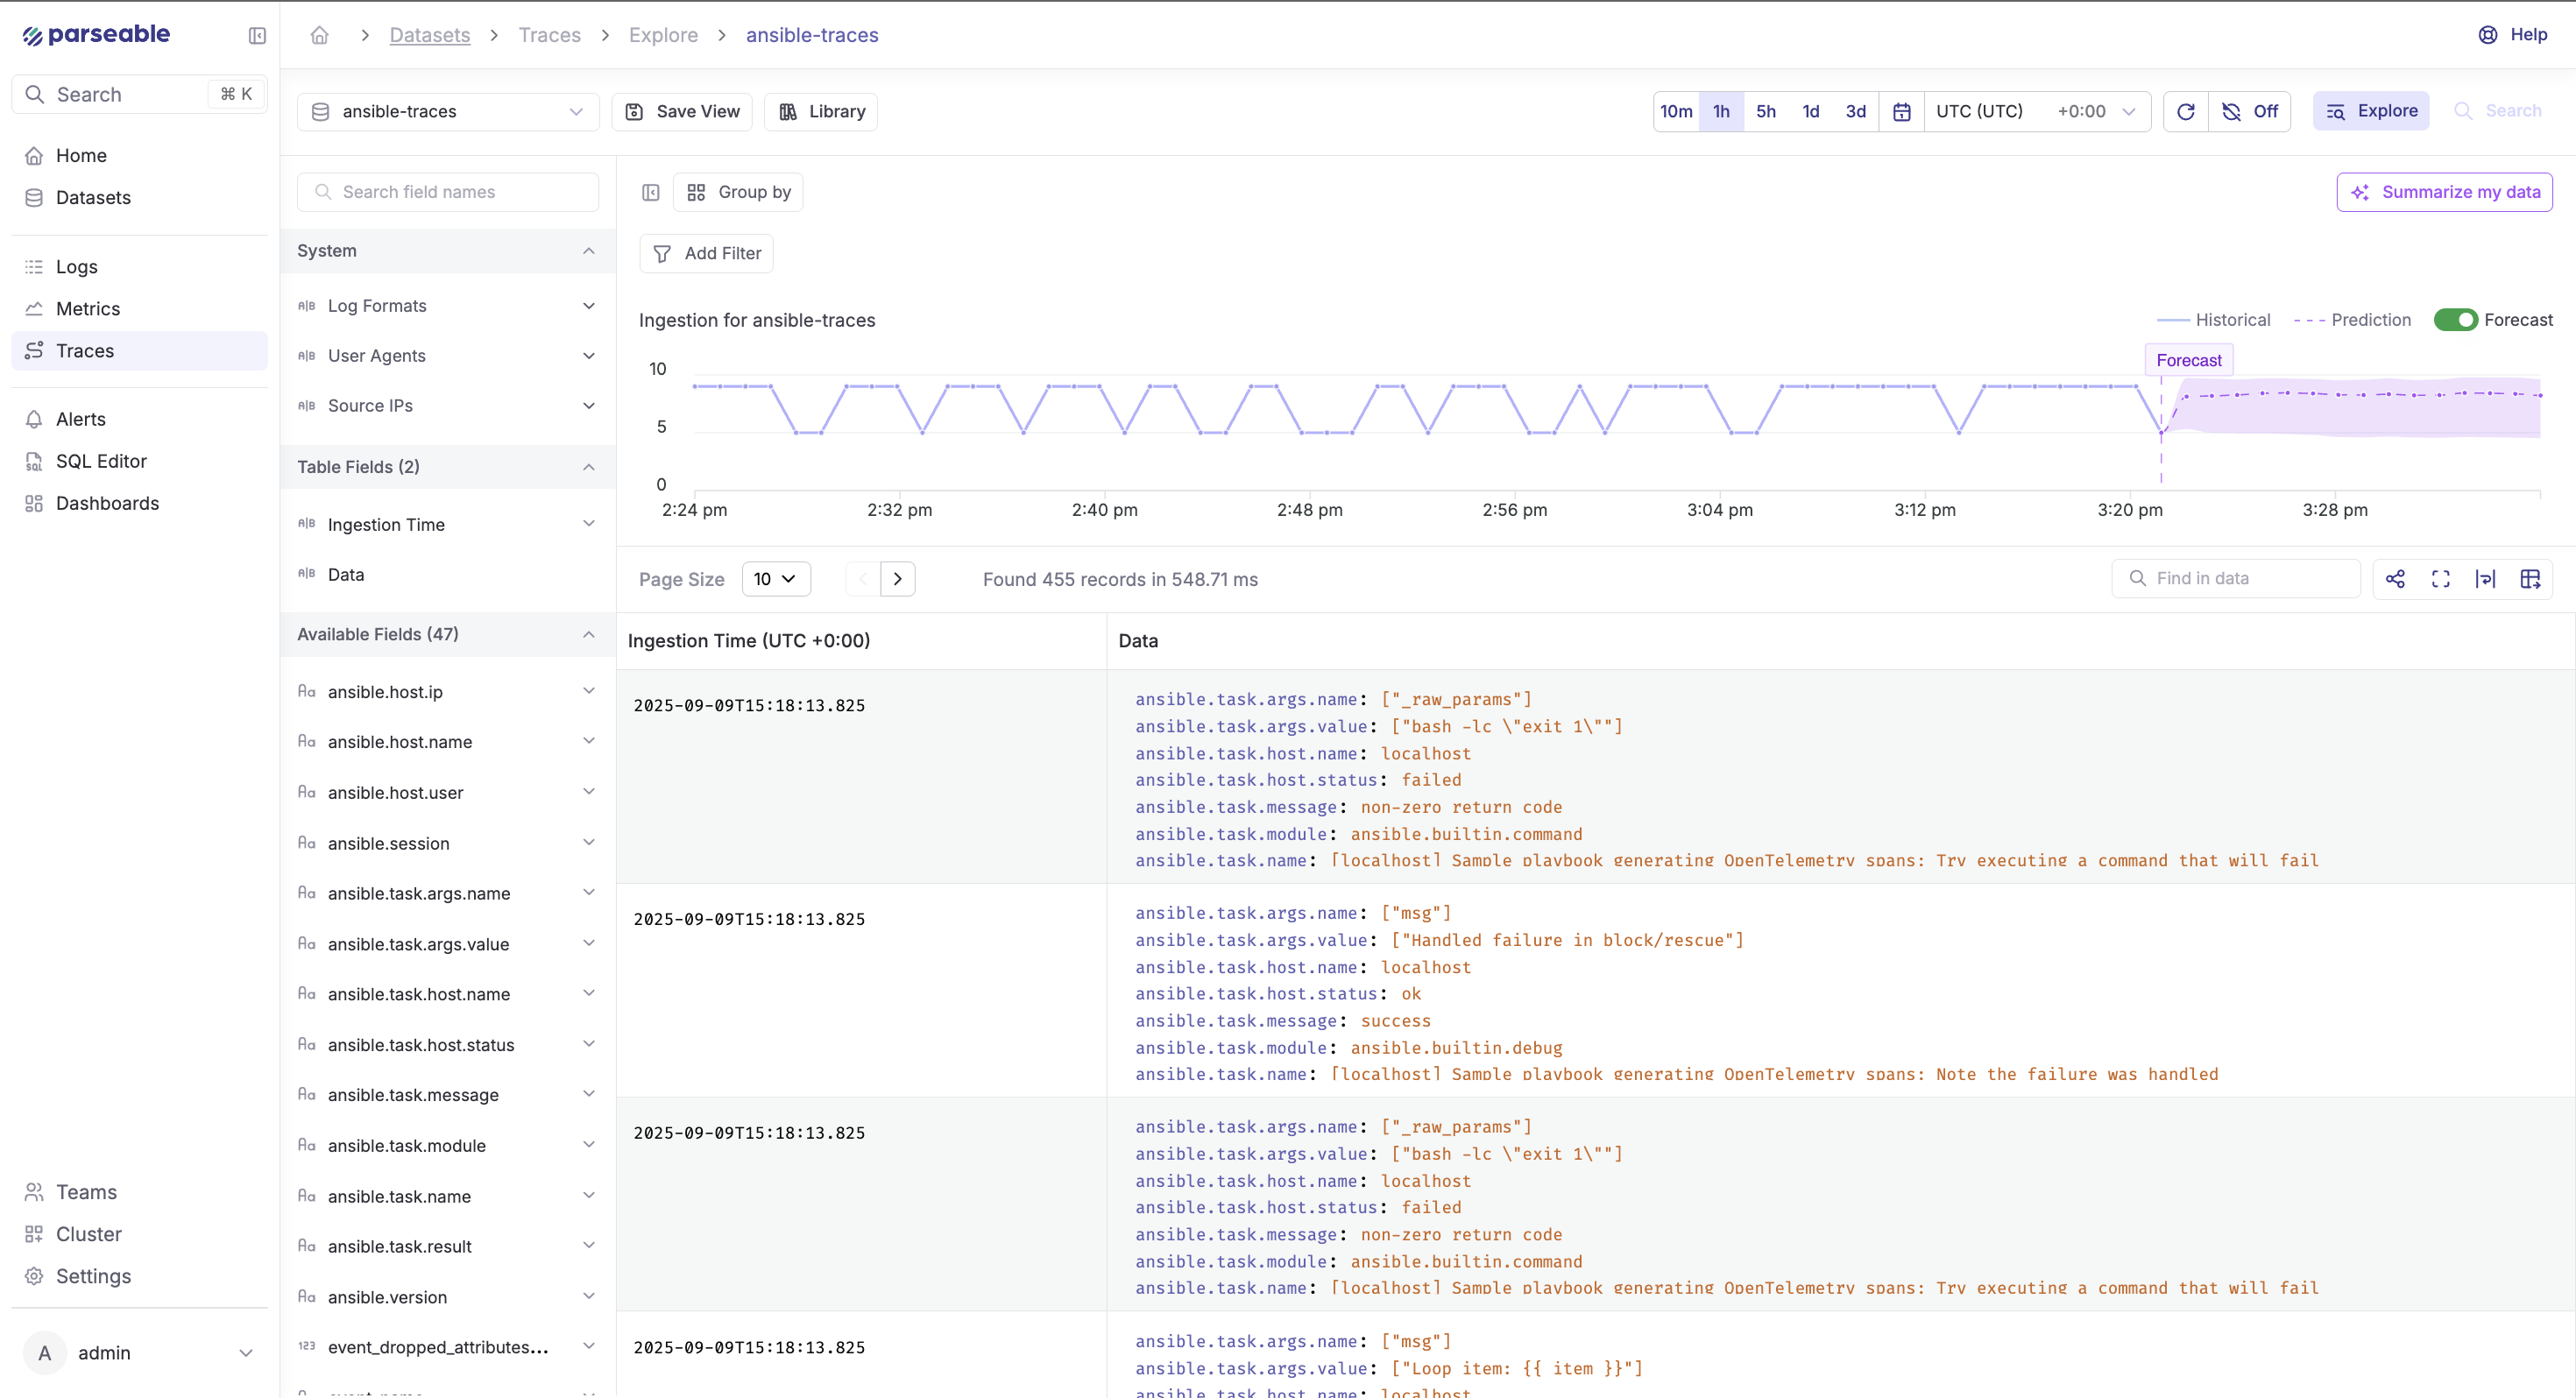
Expected result:
- Telemetry flows from the plugin to
http://localhost:4318. - The Collector forwards to Parseable streams (
otel-logs,otel-traces,otel-metrics).
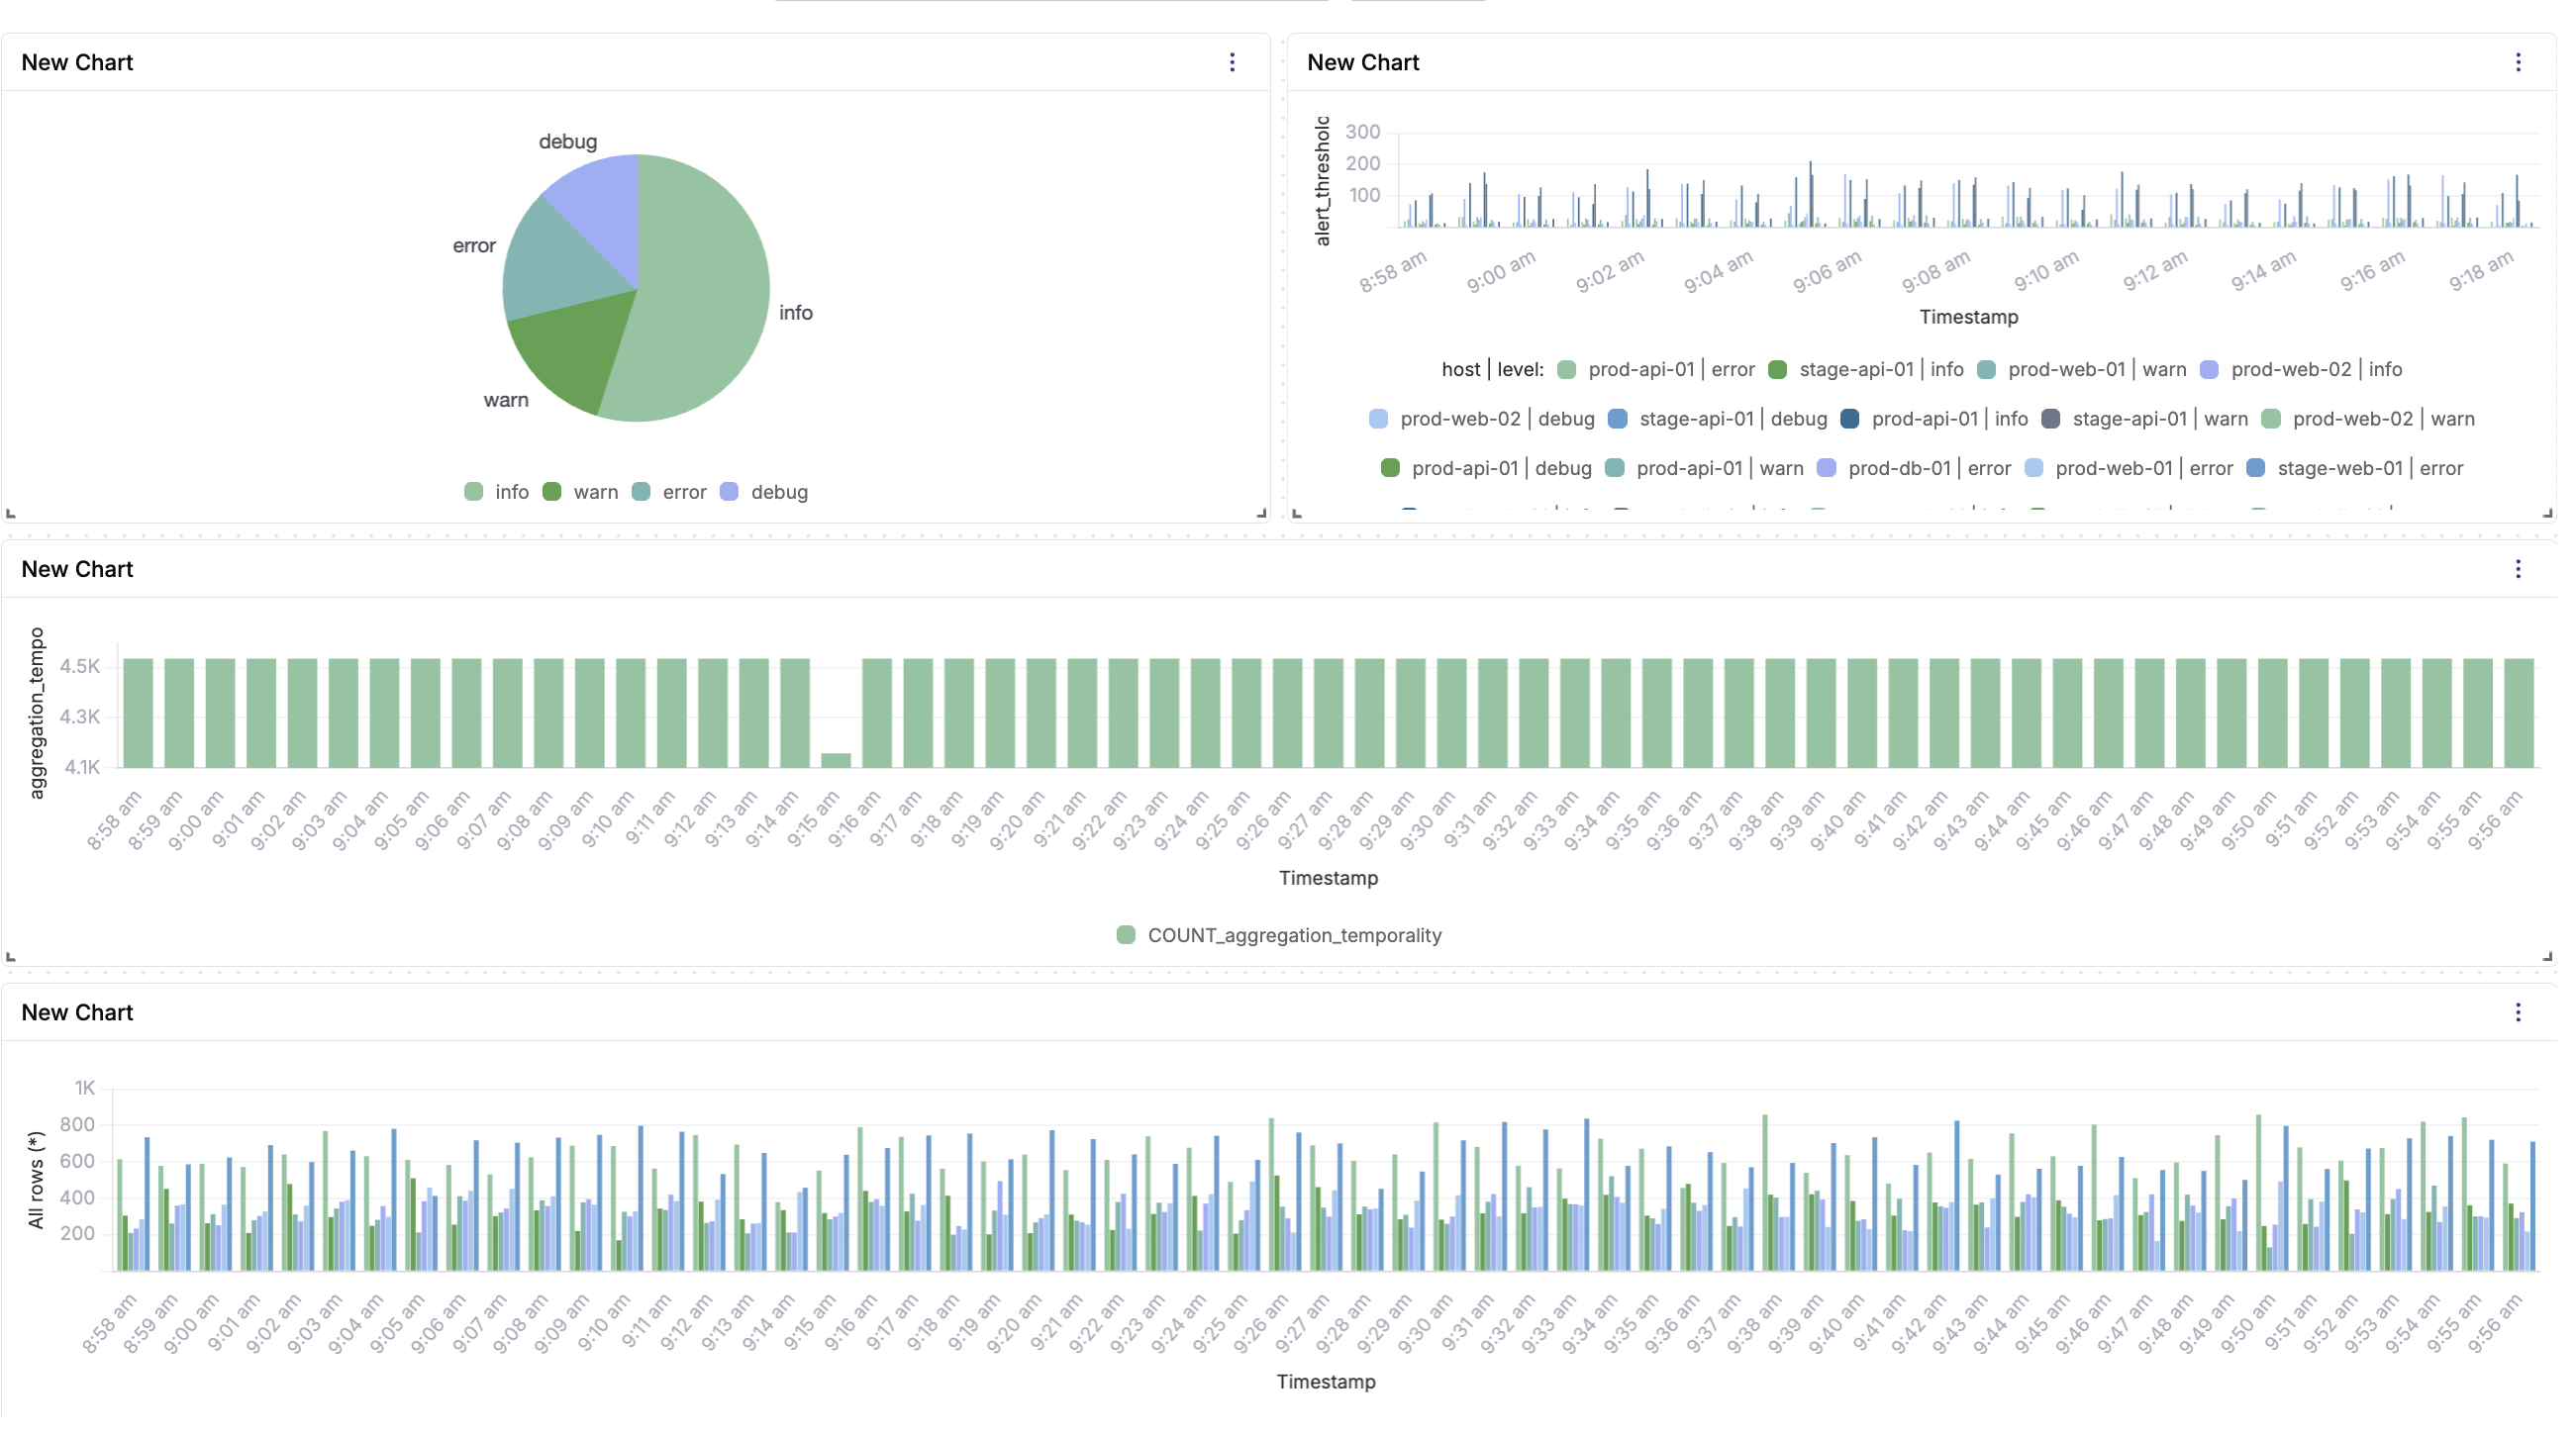
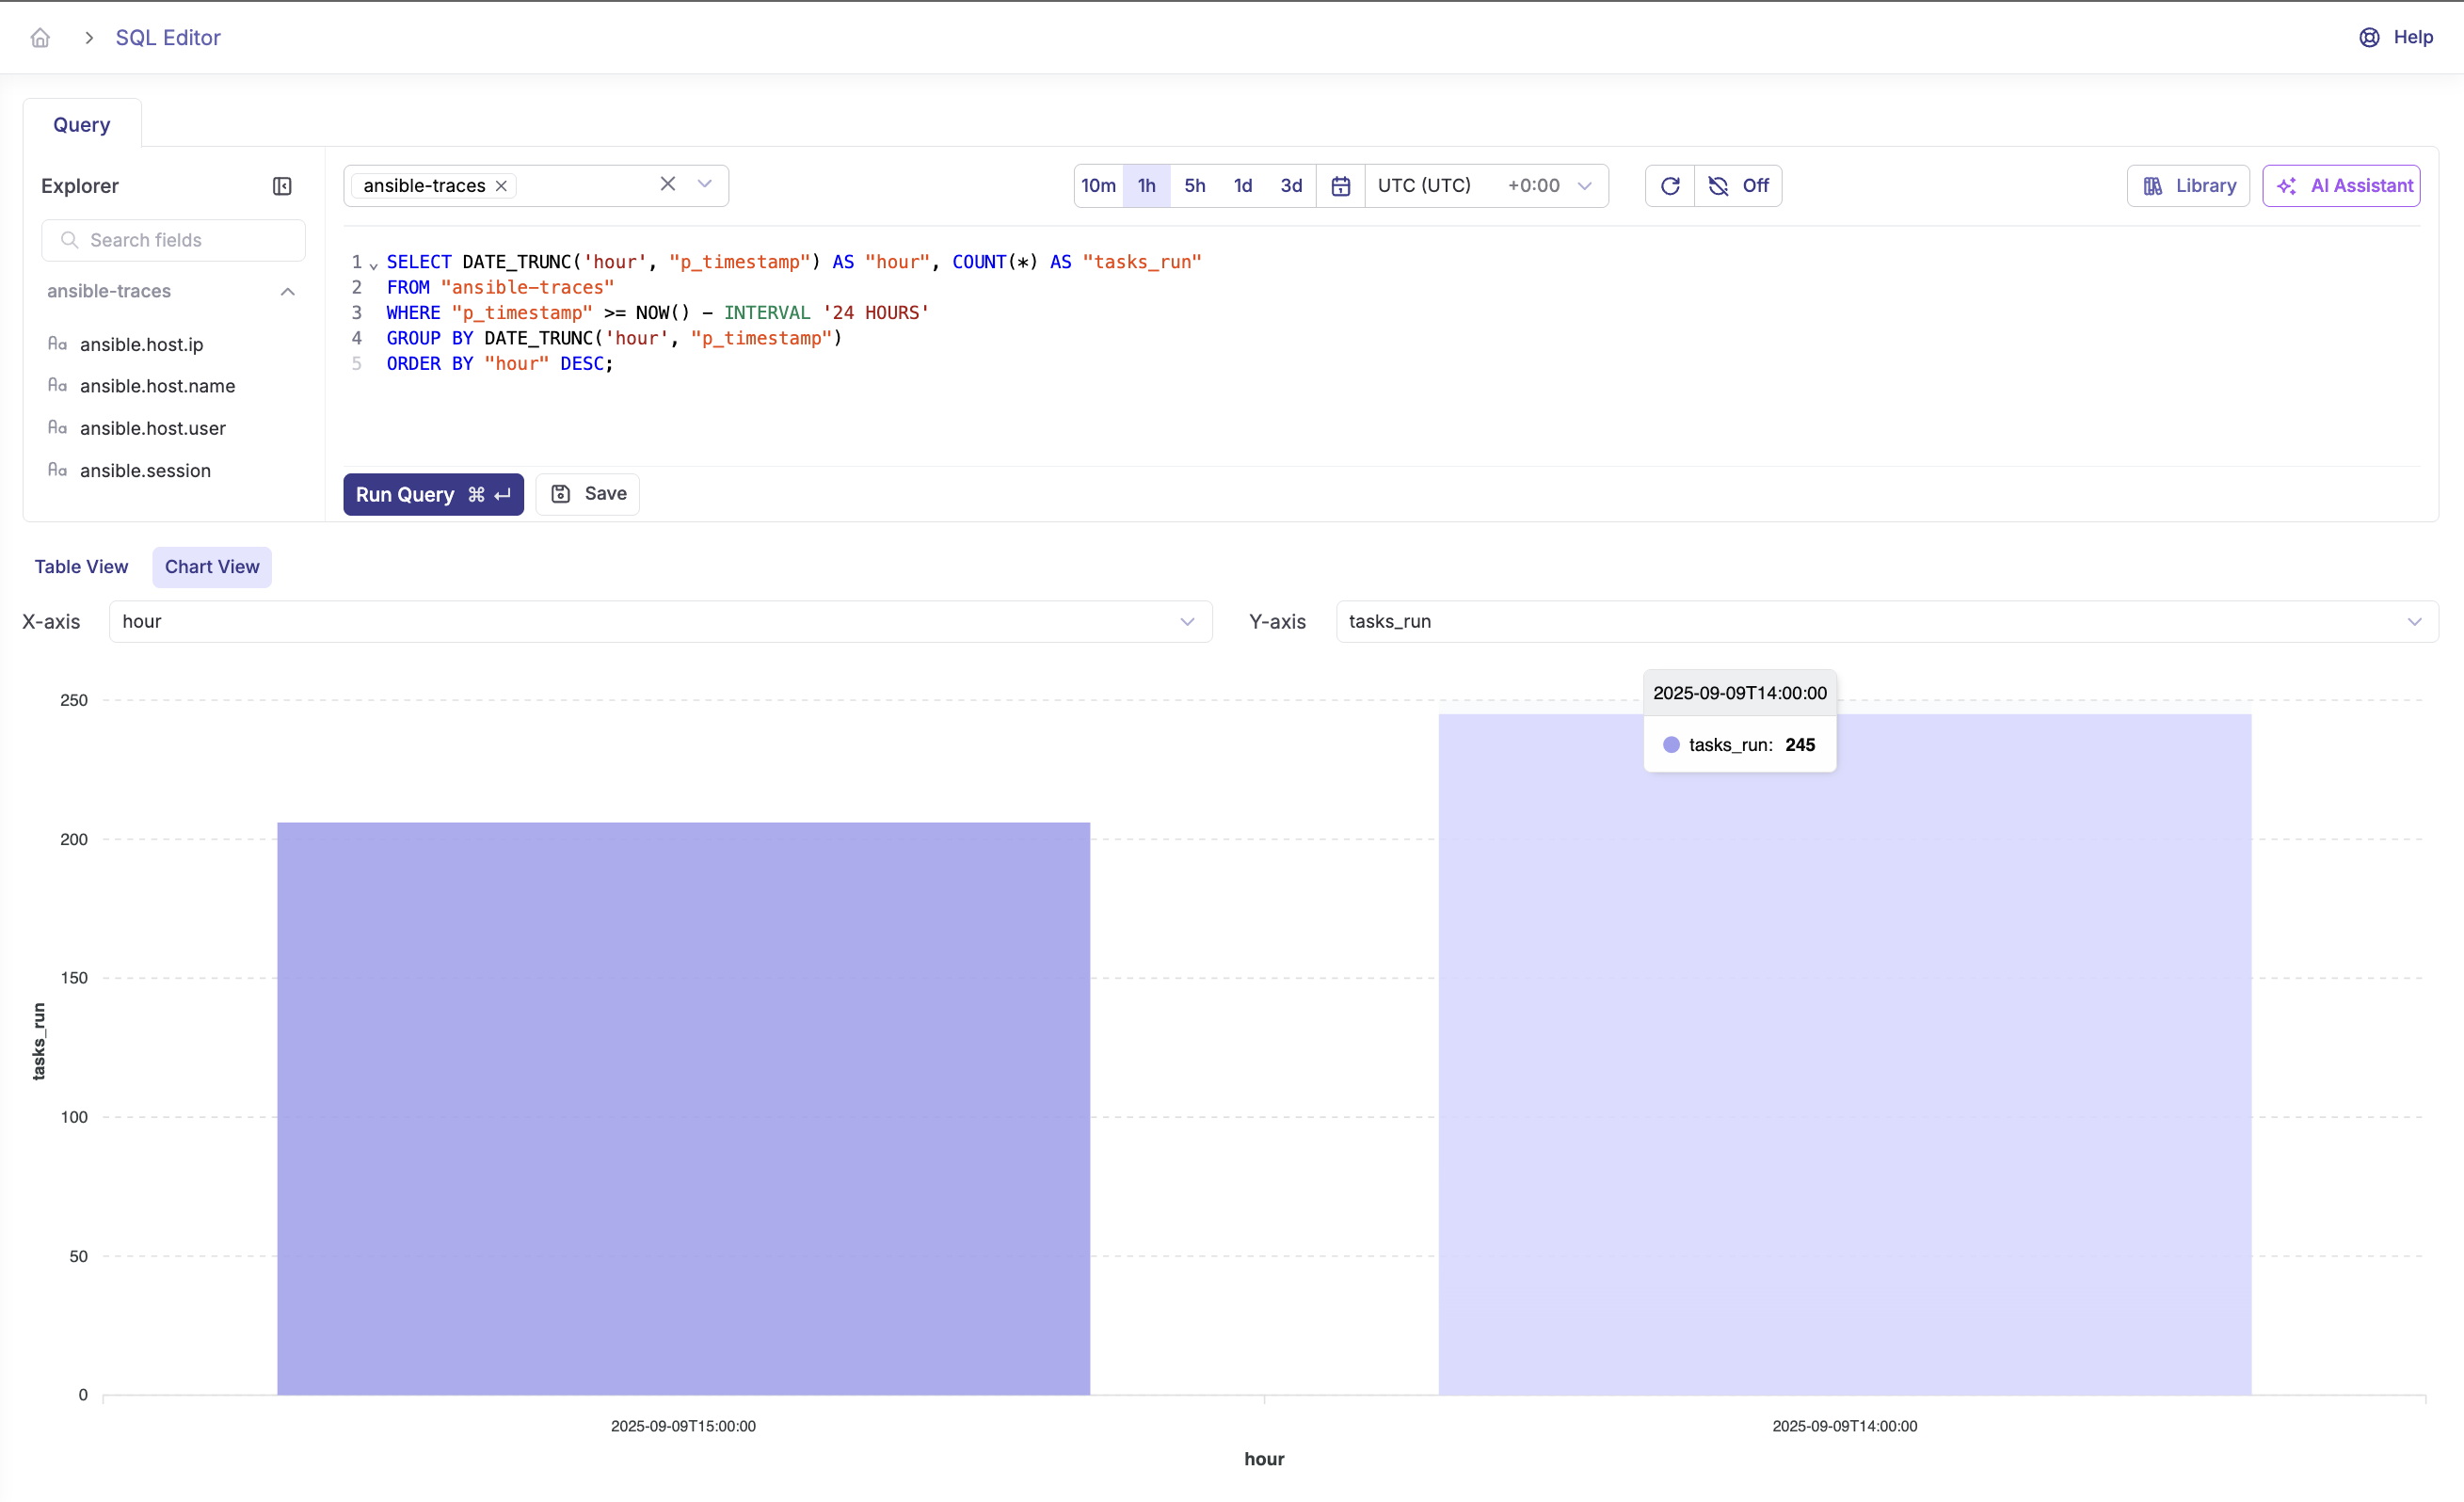
What “good” looks like in Parseable
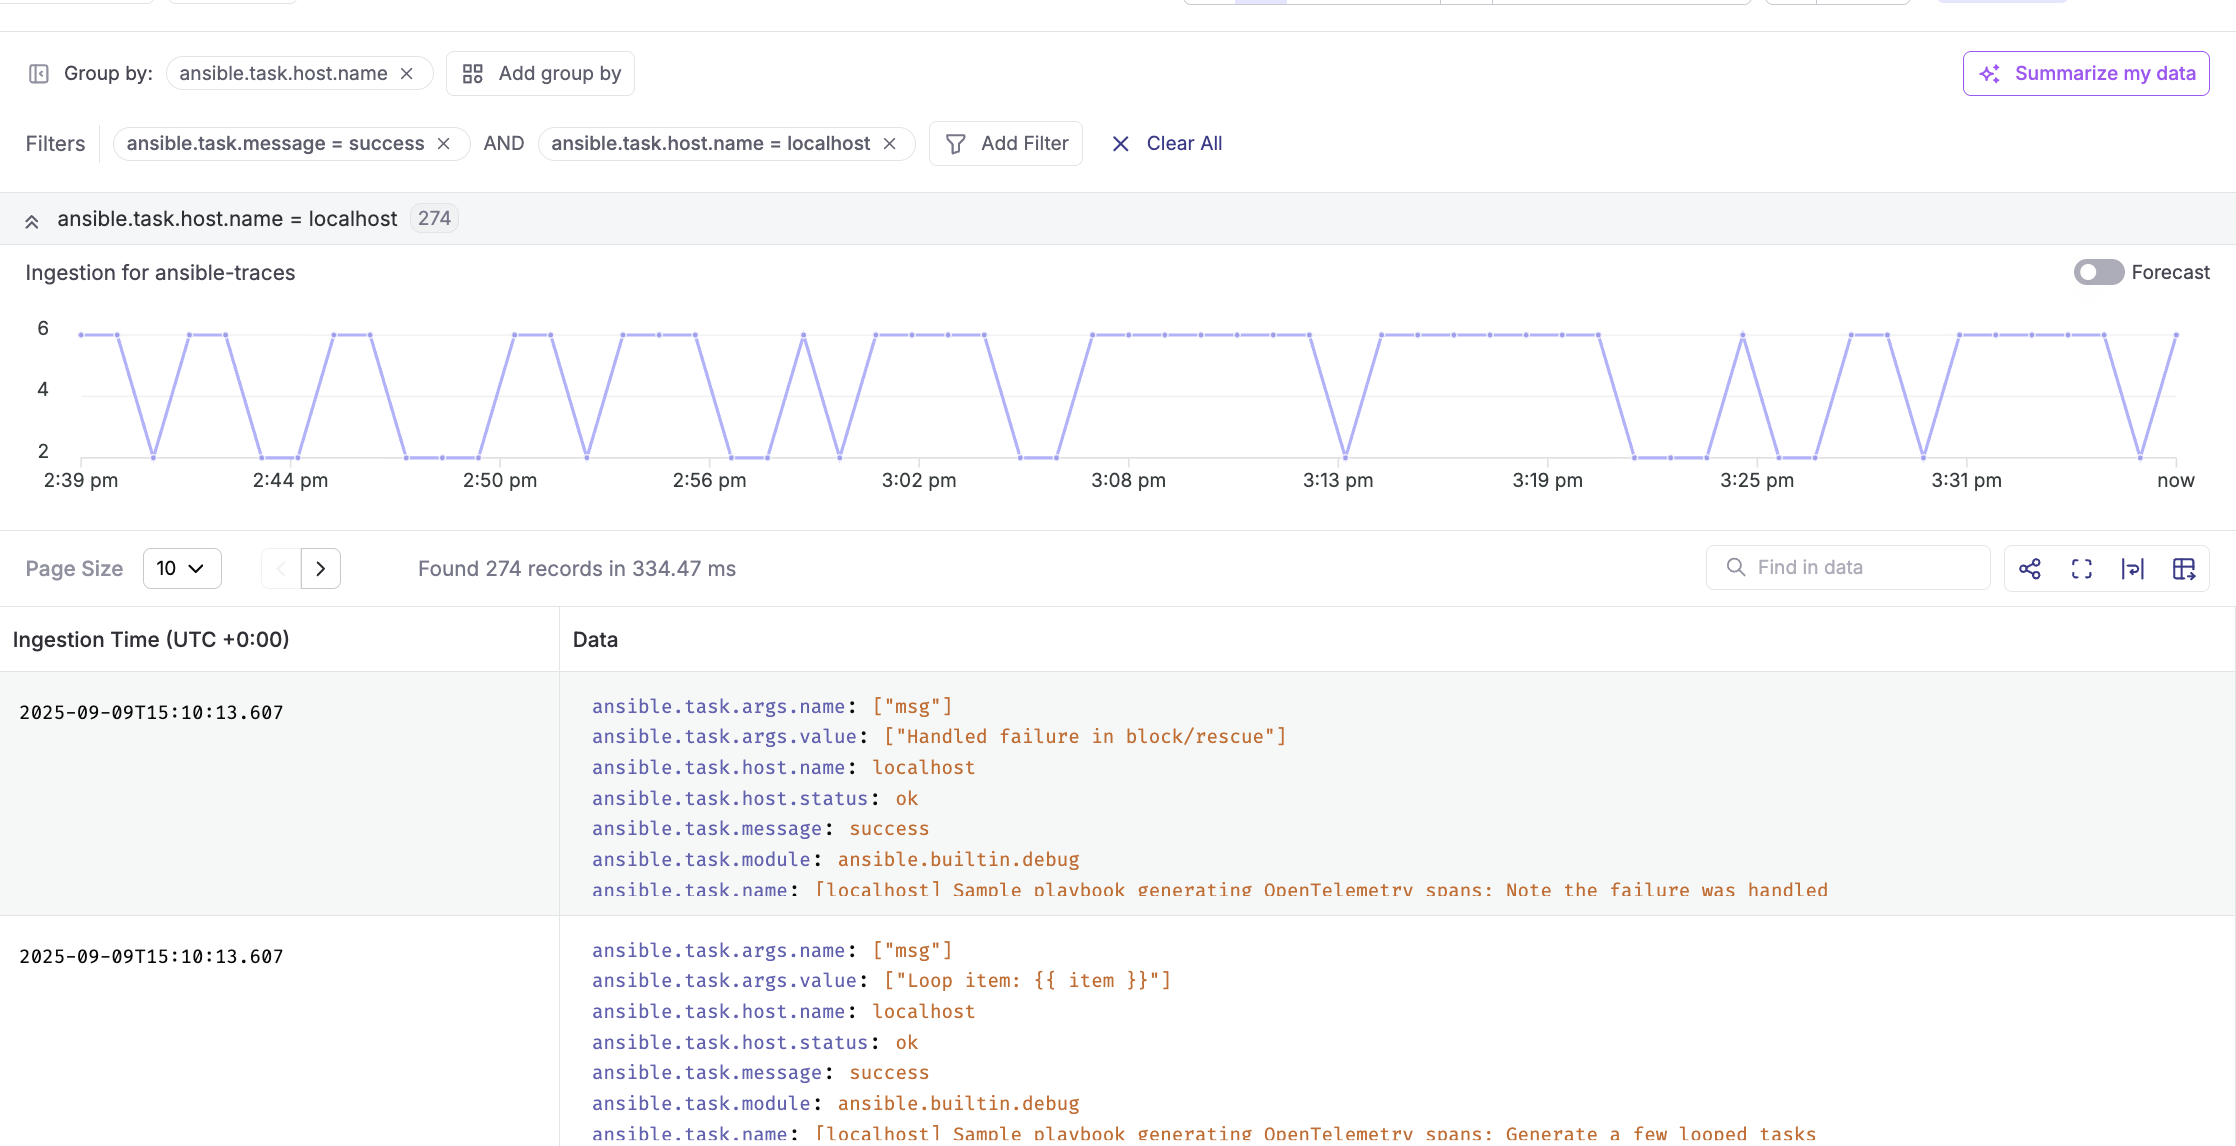
Logs (stream: ansiblelogs)
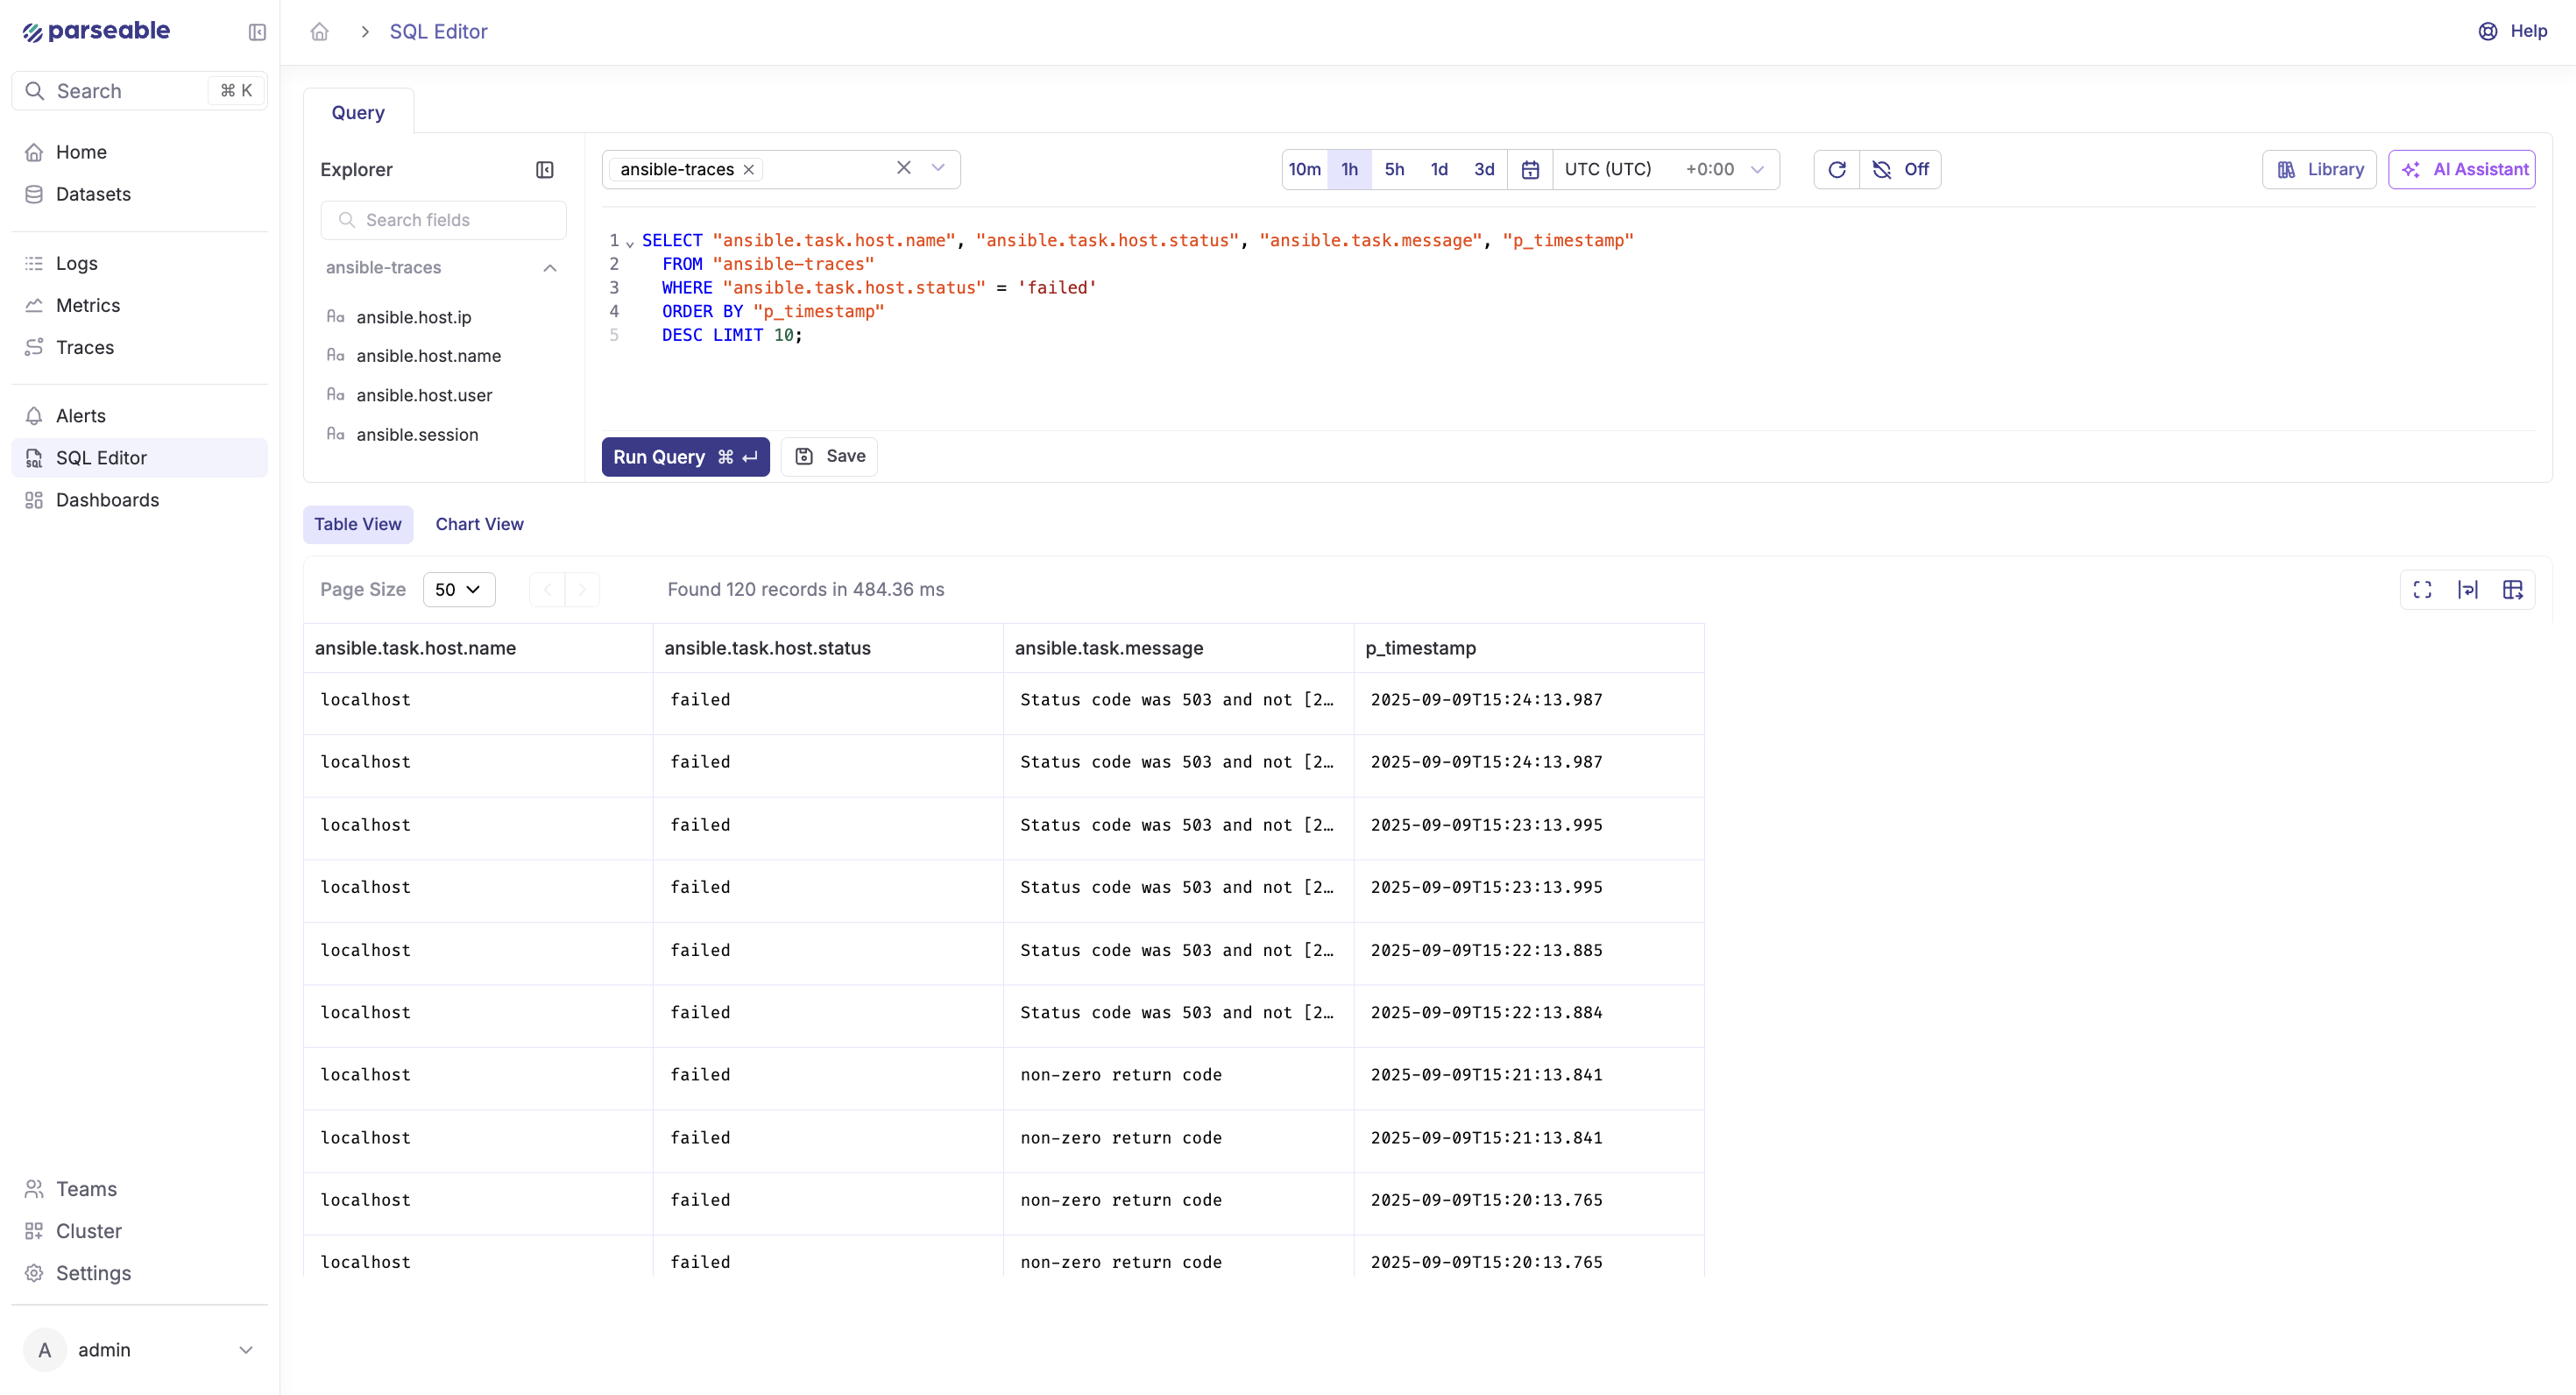
- Filter on
task.status = "failed"to surface failures quickly - Group by
task.nameorhost.nameto see patterns - Use time filters to compare today’s runs with last week’s
Traces (stream: ansibletraces)
- Each playbook run appears as a root span, with child spans per task
- Identify the slow path by sorting spans by duration
- Compare span patterns across days to catch regressions
- Attach context with attributes like
deployment.id,git.sha,team,env
Metrics (optional, stream: ansibelmetrics)
- Extend the plugin or add metrics via the OTel SDK:
- Histogram of task durations
- Counter of task failures by module
- Gauge for concurrency
- Tie metrics to SLOs:
- “90% of playbooks complete in < N seconds”
- “Failure rate stays below X% per day”
AI-based summarization in Parseable
Turn any noisy time window into a crisp, executive‑ready report. Parseable’s AI summarization reads the logs or traces you’re viewing and produces a natural‑language summary with error counts, highlights, and actionable observations.
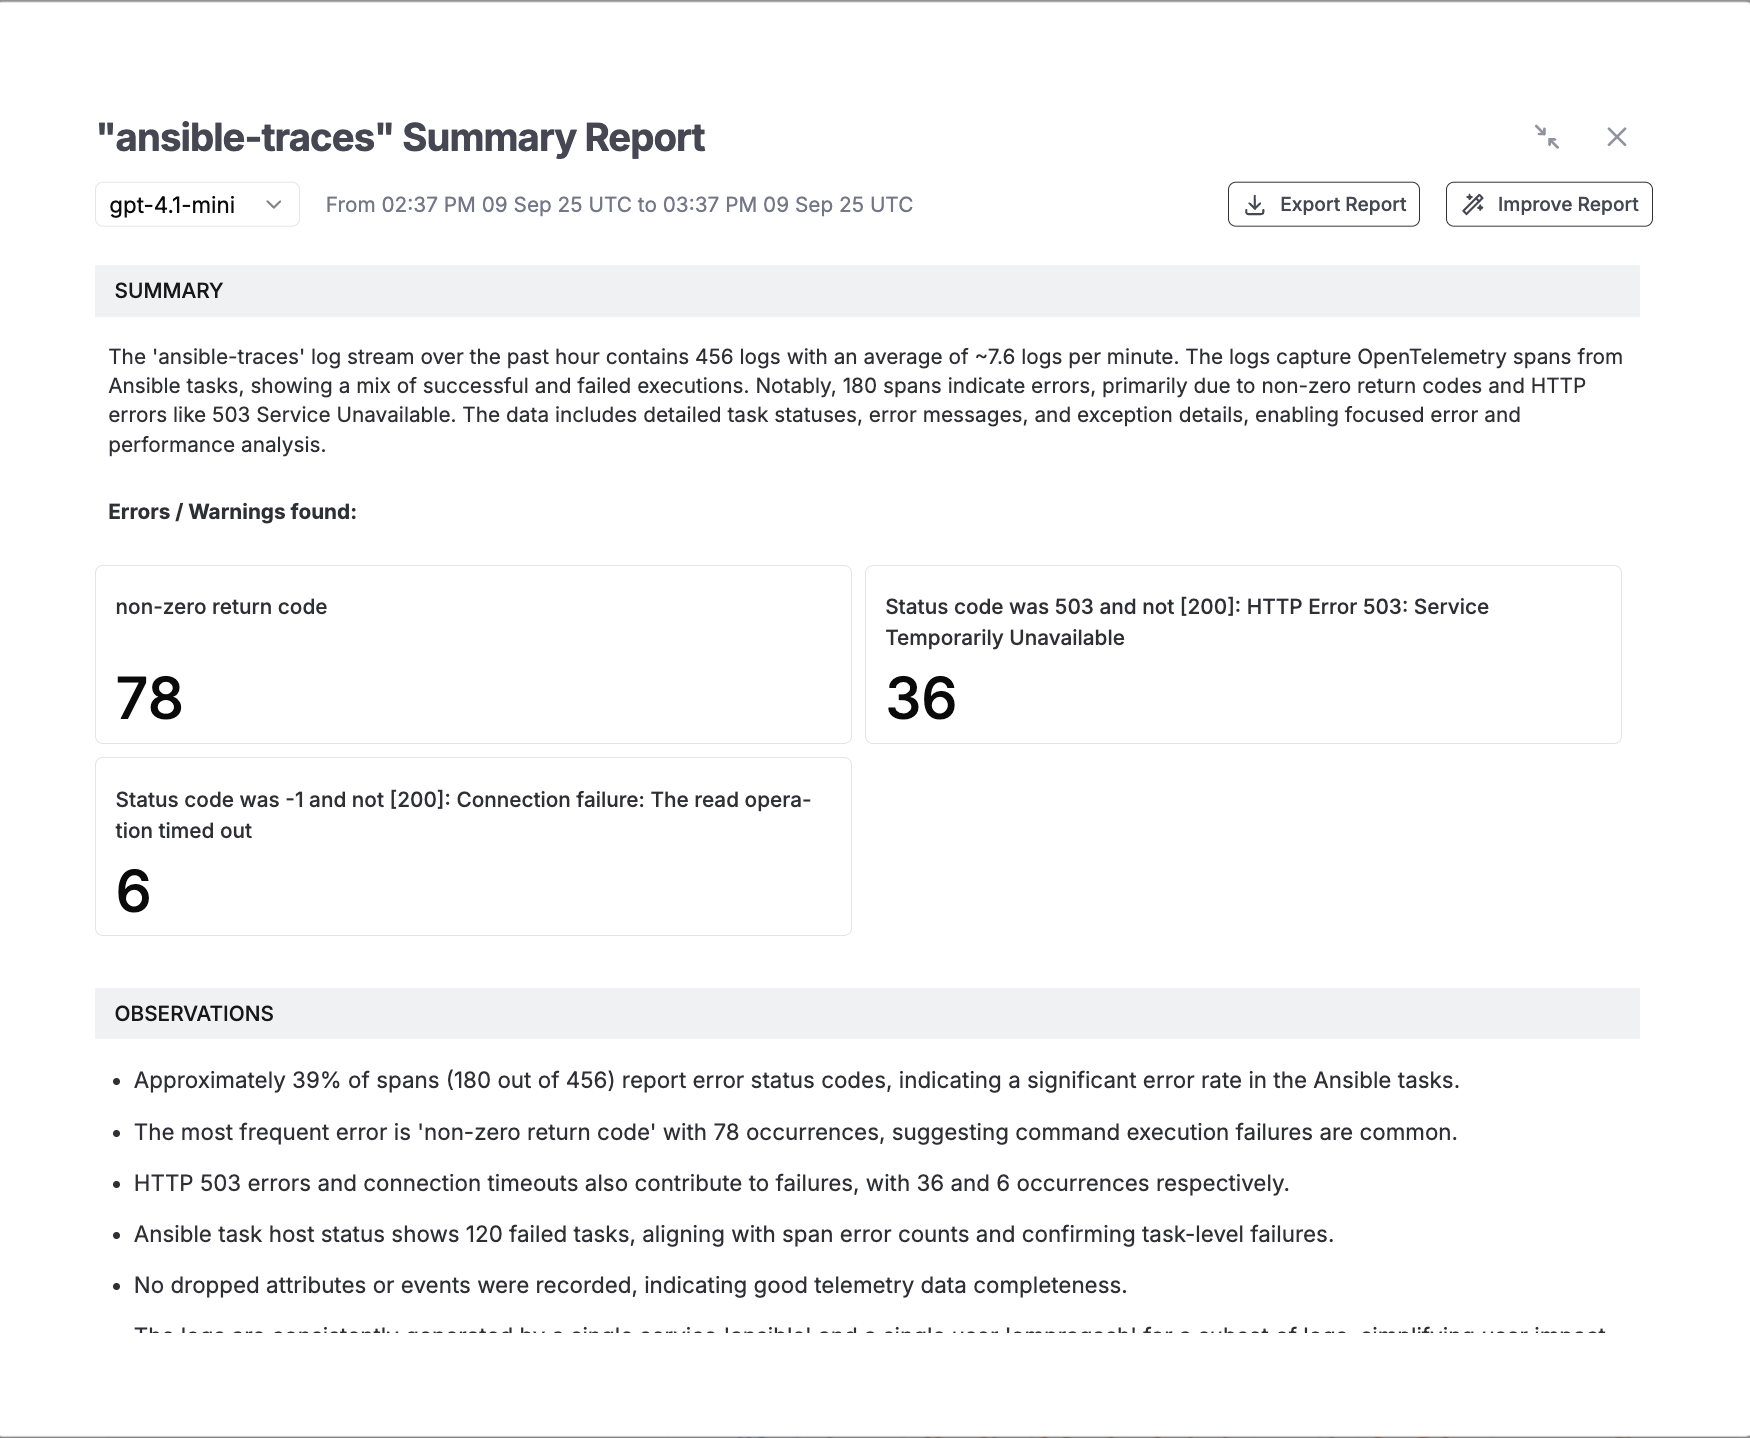
What it gives you
- A short summary of volume, success/failure mix, and key patterns over the selected time range.
- Aggregated “Errors / Warnings” with counts (e.g., non‑zero return codes, HTTP 503s, connection timeouts).
- Observations about trends and hotspots (slow tasks, failing hosts, spike windows).
- One‑click actions to Export Report for sharing or Improve Report to refine the narrative.
How to use it
- Open a stream (e.g.,
ansiblelogsoransibletraces) and set the time range you care about. - Click the
Summarizebutton in the toolbar and select a model from the dropdown. - Review the generated summary. Use Improve Report to add and remove fields.
- Click Export Report to save and share with your team.
Advanced recipes
Richer resource context
- Use the
resourceprocessor to set attributes that travel with every signal (e.g.,service.name,service.version,env,team) - Benefits:
- Faster routing and filtering in Parseable
- Cleaner dashboards without complex WHERE clauses
Handle noisy runs
- Keep the
batchprocessor enabled to reduce chattiness - Log at INFO for lifecycle events and bump to ERROR for failures only
- If you export metrics, consider aggregating at the Collector to reduce volume
Troubleshooting
- Port conflicts (4318/4317): change published ports in
compose.yamlor stop whatever is listening on them - No data in Parseable: validate
.envvalues (use/api/v1/ingestpath, correct Base64 auth) - Collector health:
podman compose logs -f(ordocker compose logs -f) - Plugin not discovered: ensure
callbacks_enabled = otelandcallback_plugins = ./callback_plugins; verifyotel.pypath - Security hardening: prefer TLS for both Collector and Parseable endpoints; rotate credentials; avoid embedding secrets in playbooks
Why OpenTelemetry + Parseable is a great fit for Ansible
- Open standard, open pipeline: OTLP over HTTP 4318 is ubiquitous and vendor‑neutral
- One backend, all signals: Parseable stores logs, traces, and metrics together—no tool sprawl
- SQL‑first analysis: write standard SQL to answer tough questions quickly and support postmortems, audits, and planning
Where to go next
Conclusion
You don’t need to treat Ansible like an opaque script runner. With a lightweight OpenTelemetry callback plugin, a small Collector, and Parseable as your unified, SQL‑first backend, you can turn every playbook run into a traceable, searchable, auditable event stream. That means faster debug loops, clearer handoffs, and fewer mystery failures.
Try it with your busiest playbook today:
- Run the included demo
- Tail spans and logs in Parseable
- Add a metric or two for task durations
Then ask yourself: which task needs attention next—and how much quieter would your on‑call be if you fixed it?
