

Introduction
Parseable is an open-source unified observability platform. While it integrates with every major observability agent - OTel, FluentBit, Vector, and more, we often get this question: "What is your recommended observability agent?".
To settle this for us and for our users, we wanted to see how do the two most popular agents - OTel Collector and Fluent Bit stack up when with same input data, same server conditions and same target system? We ran both agents side by side against the OTel-Demo microservices and grabbed CPU, memory, I/O and load stats to find out.
Test Setup
We used OTel Collector v0.129.1 (with default batching + memory queues) and Fluent Bit v4.0.5 (with opentelemetry plugin + basic filters) in this experiment.
To ensure both Fluent Bit and OpenTelemetry Collector have the telemetry data source, we used the node-exporter to generate metrics and send it through the agents.
The destination of this telemetry was a Parseable cluster running v2.4.0, again to ensure the exact same situation for both the agents.
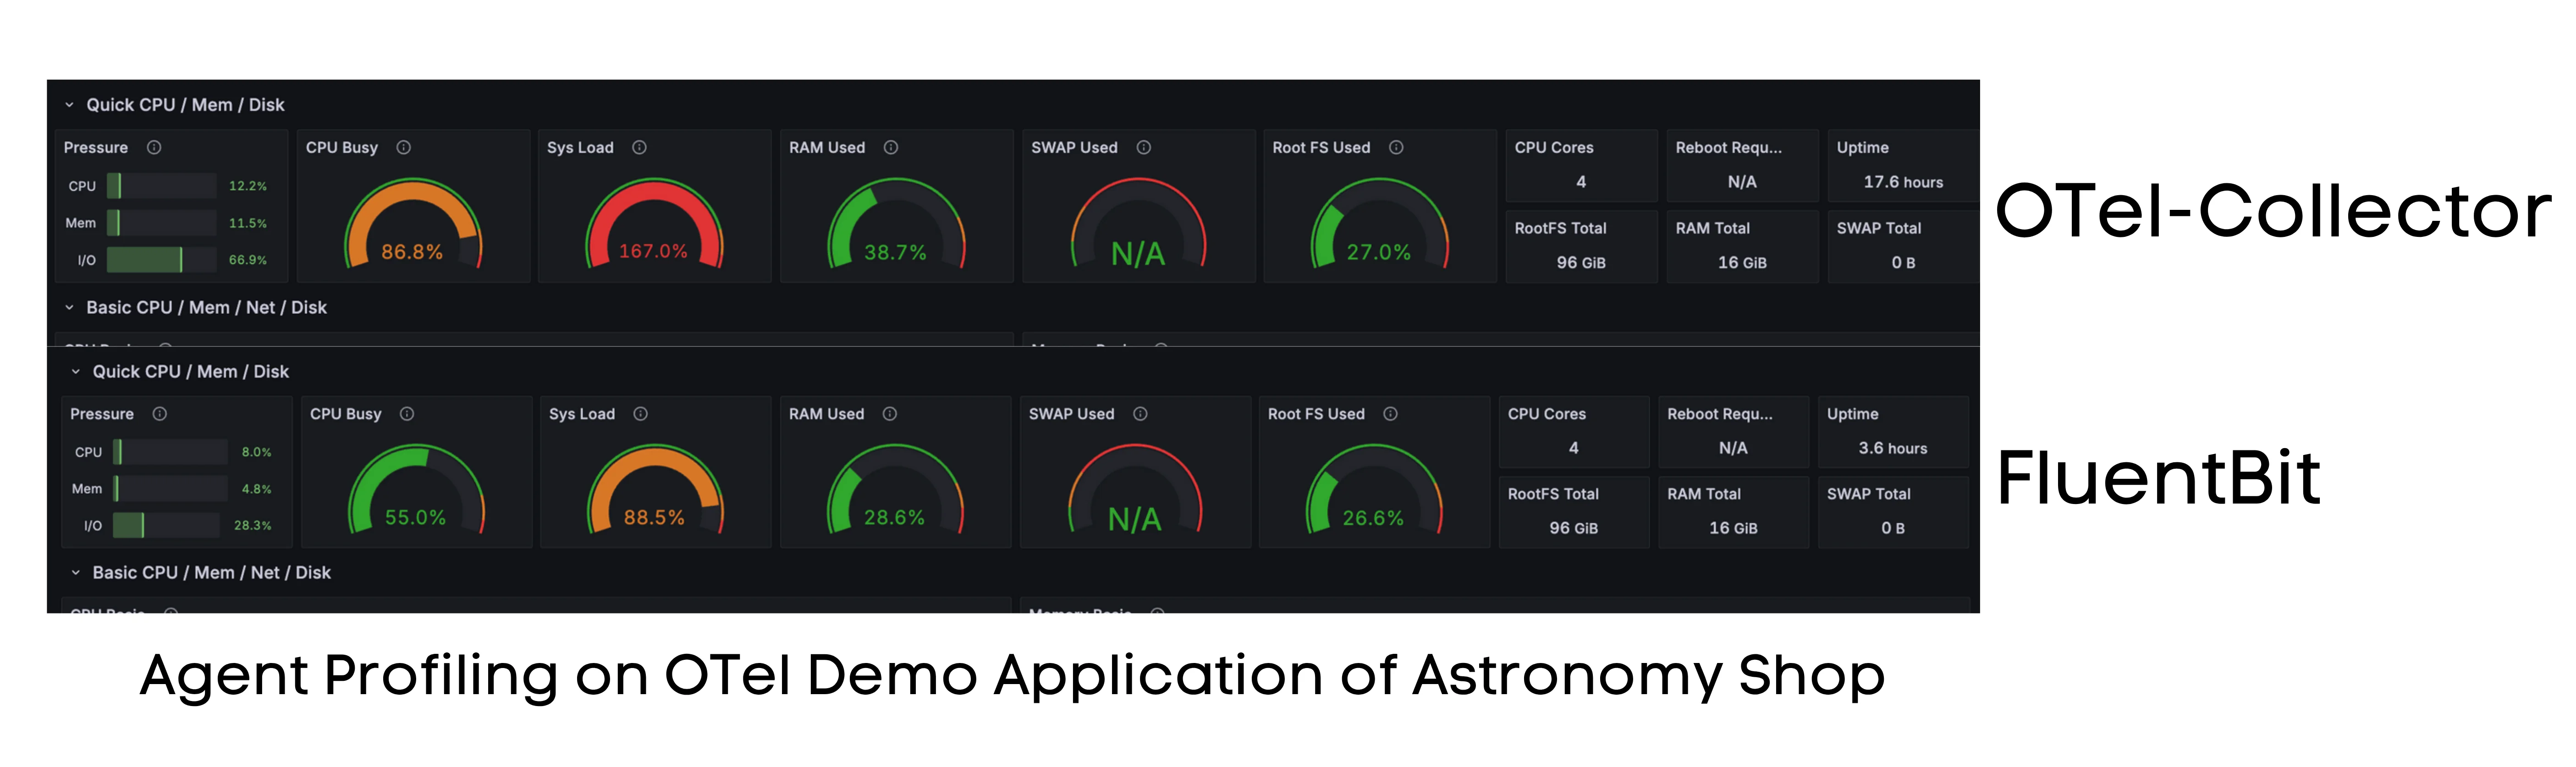
Note that this is a controlled environment and does not fully represent production scenarios. For this testing, we focused on a limited set of metrics to ensure consistency all generated from node-exporter running on an EC2 instance. The EC2 instance was a t3.small with 2 vCPUs and 2 GiB of RAM, running Ubuntu 22.04.
Initial OpenTelemetry Demo Experiment
We initially attempted to use the OpenTelemetry Demo application (v2.0.2) as our telemetry source to create a realistic microservices environment. However, this approach proved unsuitable for fair agent comparison. The OTel Demo is inherently instrumented for OpenTelemetry protocols, generating rich telemetry data optimized for the OpenTelemetry Collector's native ingestion capabilities.
When routing this data through Fluent Bit's OpenTelemetry plugin, the volume differential became significant: over a 1-hour window, Fluent Bit processed approximately 80% less telemetry data compared to the OpenTelemetry Collector due to protocol translation overhead and data structure incompatibilities. This created an unfair comparison where the agents weren't processing equivalent workloads, making performance metrics non-comparable.
Running identical workloads for the same time period revealed significant telemetry data processing differences:
| Telemetry Type | Metric | OpenTelemetry Collector | Fluent Bit | Difference |
|---|---|---|---|---|
| Logs | Total records | 23,553 | 4,182 | -82.2% |
| Logs | Distinct trace IDs | 2,703 | 491 | -81.8% |
| Metrics | Total records | 389,430 | 26,721 | -93.1% |
| Metrics | Valid data points | 92,055 | 25,553 | -72.2% |
| Traces | Total records | 52,245 | 2,395 | -95.4% |
| Traces | Distinct trace IDs | 3,822 | 506 | -86.8% |
| Traces | Distinct span IDs | 42,338 | 1,564 | -96.3% |
Key Findings:
- Metrics processing: Fluent Bit captured 93% fewer metric records
- Trace coverage: 95% reduction in trace data capture
- Log correlation: 82% fewer log records with corresponding trace correlation
Consequently, we pivoted to using node-exporter as a neutral telemetry source, ensuring both agents process identical data volumes and formats for accurate performance profiling.
Test Results
| Metric | Fluent Bit | OpenTelemetry Collector | Delta |
|---|---|---|---|
| CPU Usage | ~1.2% busy | ~1.2% busy | Negligible |
| RAM Usage | 20.8% (≈426 MiB) | 23.4% (≈479 MiB) | +53 MiB |
| Disk Usage | 28.4% root FS | 28.4% root FS | Identical |
| PSI-CPU | ~0.4% | ~0.3% | Effectively noise |
| PSI-I/O | 0% | 0% | No swap configured |
Key Insight: On edge devices, idle overhead is practically identical. OpenTelemetry Collector carries a small constant RAM overhead (~50 MiB). Under load, Fluent Bit maintains flatter CPU/memory usage and avoids long I/O stalls, while Collector scales up resource usage for richer in-pipeline processing.
Detailed Resource Analysis
CPU Utilization (Host Level)
| Agent | User CPU | System CPU | Total CPU | Analysis |
|---|---|---|---|---|
| Fluent Bit | ~0.84% | ~0.26% | ~1.1% | Minimal overhead |
| OpenTelemetry Collector | ~0.68% | ~0.32% | ~1.0% | Minimal overhead |
Conclusion: At idle, both agents are essentially free with no meaningful CPU tax.
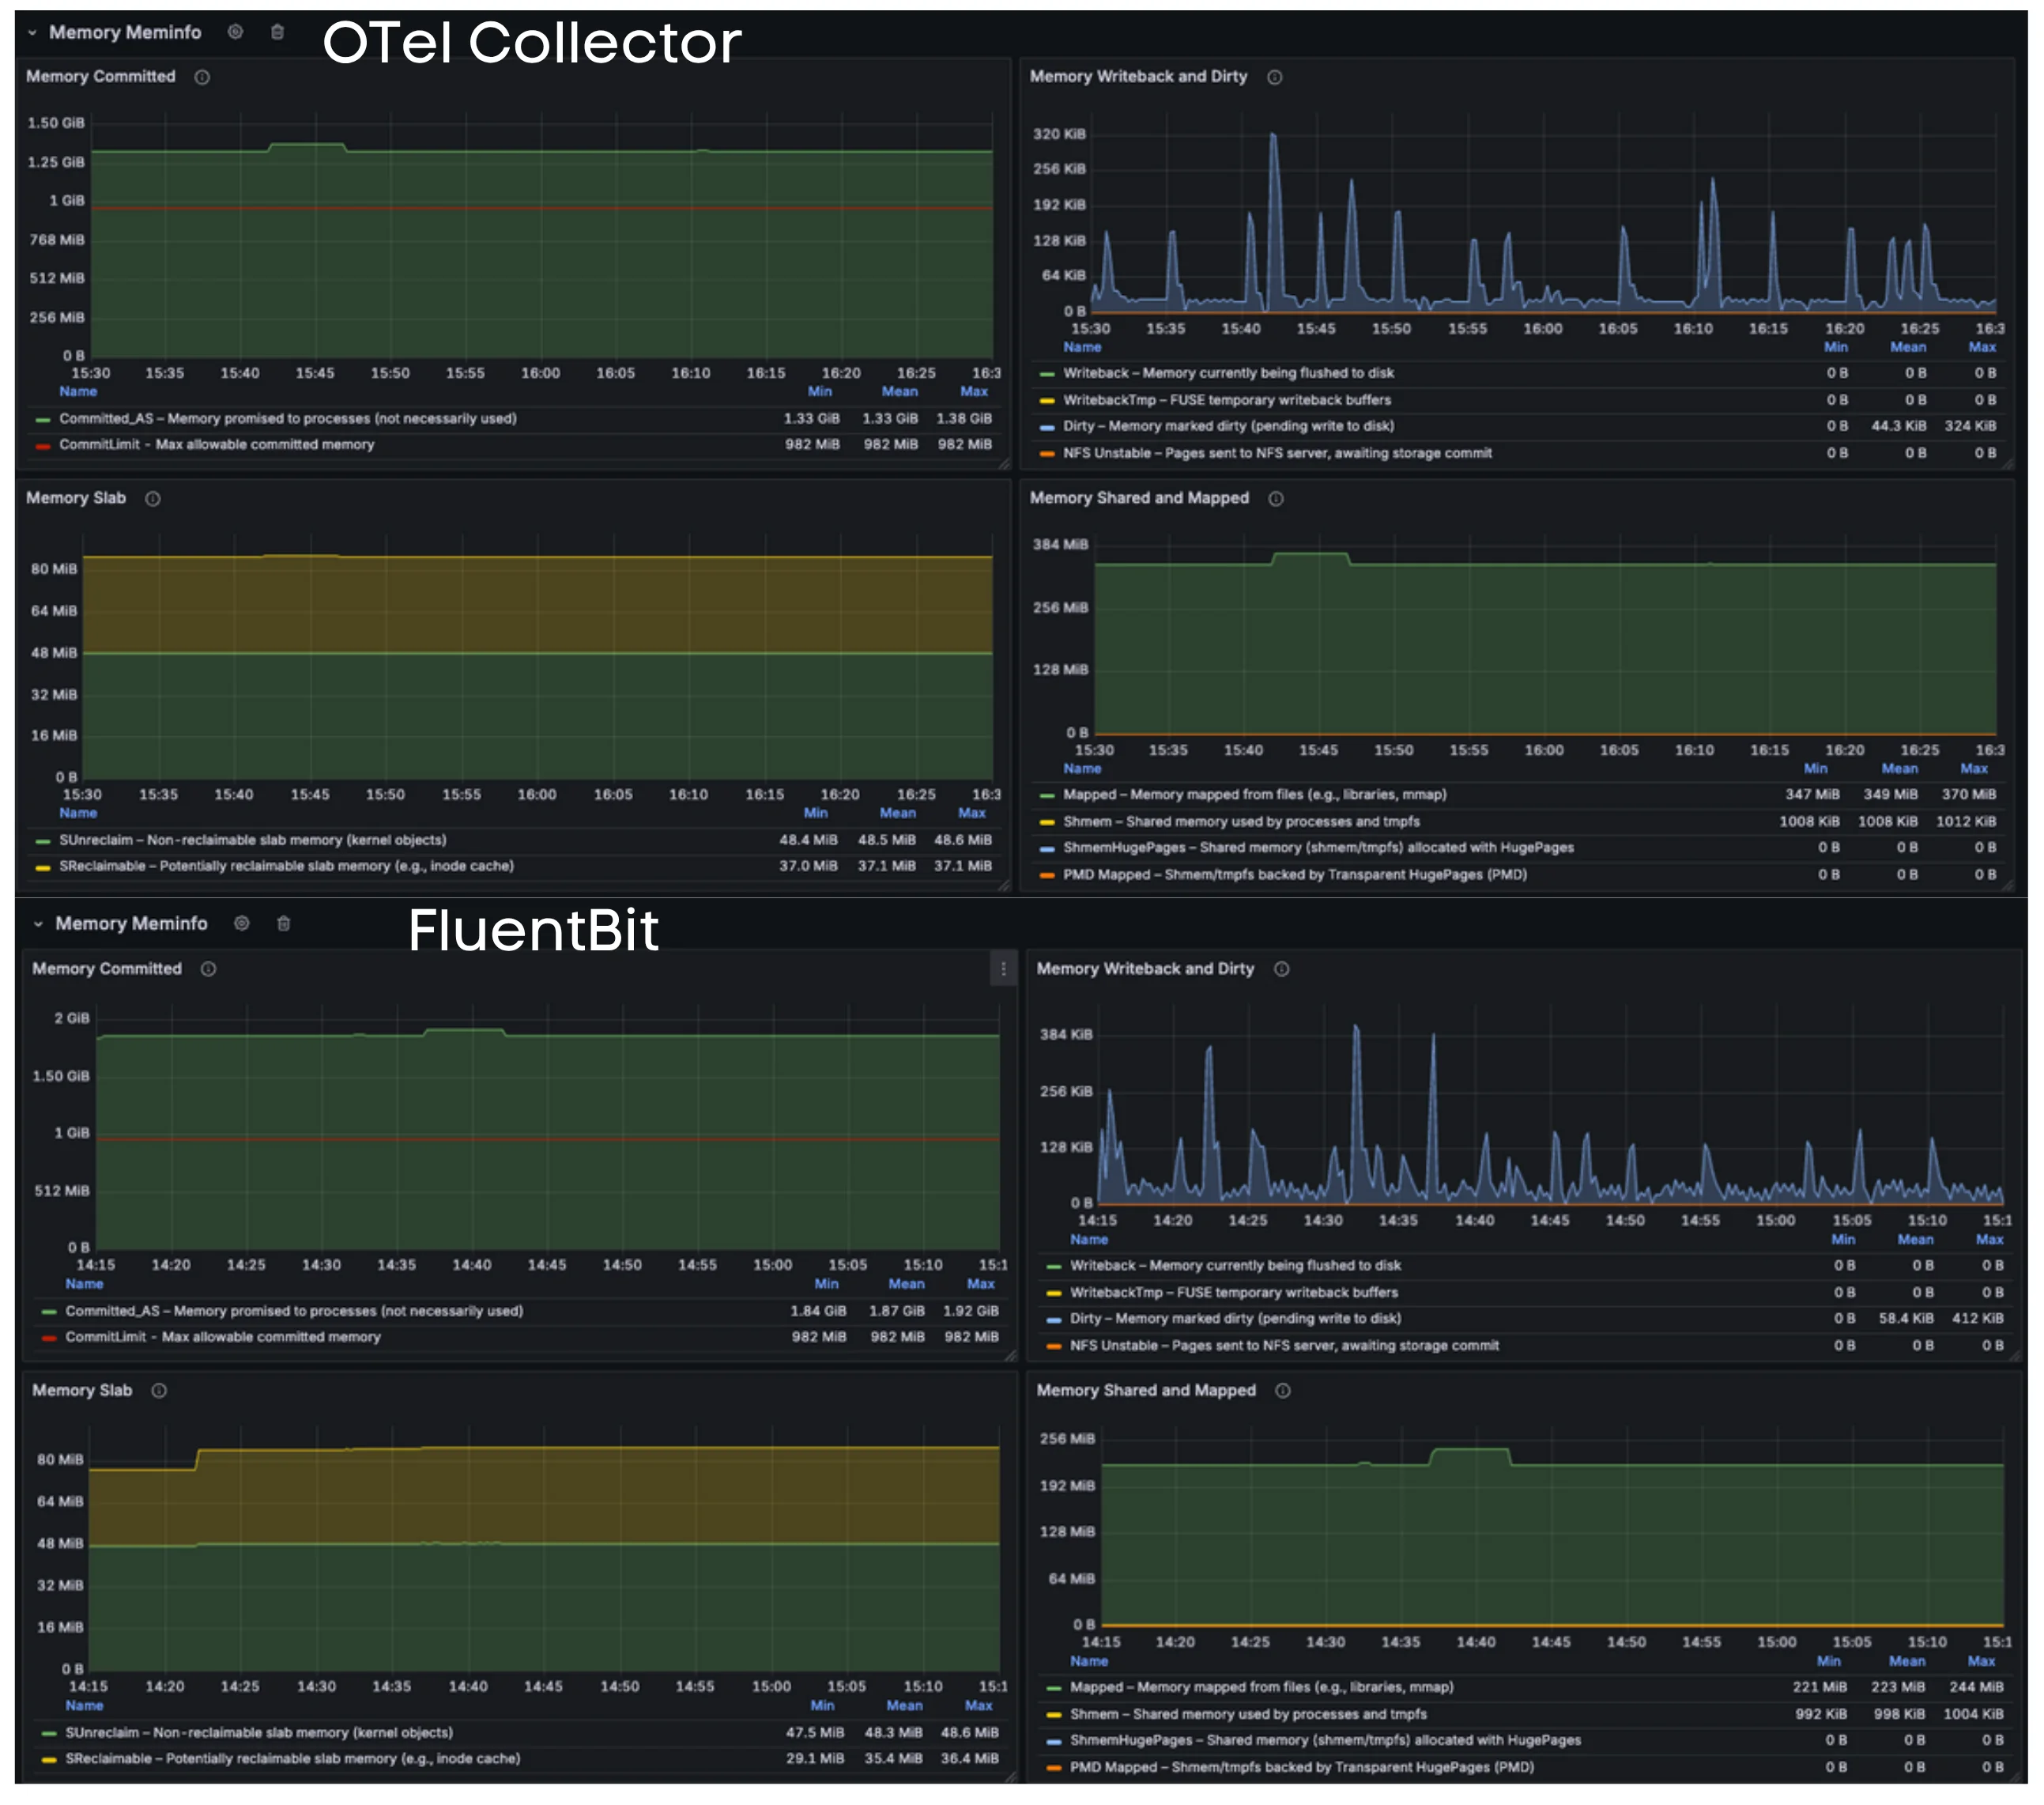
Memory Breakdown (Host Level)
| Component | Fluent Bit | OpenTelemetry Collector |
|---|---|---|
| Applications | ~225 MiB | ~189 MiB |
| Slab | ~85 MiB | ~84 MiB |
| Page Cache | ~800 MiB | ~603 MiB |
Conclusion: Collector's resident footprint is smaller at idle, but under load this flips (Collector grows, Fluent Bit stays leaner).
Disk I/O Performance
| Metric | Fluent Bit | OpenTelemetry Collector |
|---|---|---|
| I/O Utilization | 0.015% avg (peaks ~0.21%) | 0.034% avg (spikes to 2.47%) |
| Read Operations | - | ~0.28 IO/s |
| Write Operations | ~0.29 IO/s | ~0.36 IO/s |
| Throughput | ~2.35 kB/s writes | ~8.4/4.5 kB/s (r/w) |
Conclusion: Both barely touch disk when idle; Collector shows rare but taller spikes.
Pressure Stall Information (PSI)
| PSI Metric | Fluent Bit | OpenTelemetry Collector |
|---|---|---|
| CPU-some | ~0.30% | ~0.42% |
| IO-some | 0.010% | 0.028% |
| IO-full | 0.009% | 0.024% |
Conclusion: PSI is minimal across the board, but Collector's background activity produces slightly higher IO stalls.
Network Activity
| Metric | Fluent Bit | OpenTelemetry Collector | Difference |
|---|---|---|---|
| Bridge Rx | ~45 kb/s | ~238 kb/s | 5× more traffic |
| Saturation | ≈0.045% | ≈0.238% | Higher baseline chatter |
Conclusion: Collector emits significantly more baseline network traffic (control frames, keep-alives, metrics) even when quiet.
Performance Analysis Summary
What This Means
Idle Cost: Negligible for both agents (~1% CPU, few hundred MiB RAM, near-zero disk)
Resource Patterns:
- Collector's background network & IO stalls are higher
- Impact is invisible on high-performance infrastructure
- Can matter on edge nodes or eBPF-heavy hosts
Under Load Behavior:
- Fluent Bit: Maintains flatter CPU/RAM usage, avoids long IO-full stalls
- OpenTelemetry Collector: Scales up resource usage in exchange for richer processing capabilities
Key takeaway: Fluent Bit’s leaner in-process memory and heavier file-cache usage aligns with its “small-batch, high-frequency” design. The Collector prefers “bigger-batch, in-memory” work, trading higher RAM for reduced syscall overhead.
Deep Dive: Memory Internals Analysis
Test Context
Environment: 1-vCPU/2 GiB nodes running side-by-side comparison
Note: While absolute values are small on this 2 GiB test box, the memory usage patterns reveal important architectural differences.
Virtual Memory Management
Committed Memory
| Agent | Committed_AS | Analysis |
|---|---|---|
| Fluent Bit | ~1.84–1.92 GiB | Commits more virtual memory (larger working set) |
| OpenTelemetry Collector | ~1.33–1.38 GiB | More conservative virtual memory allocation |
Page Cache Behavior
Dirty/Writeback Pages:
- Both agents show small, periodic dirty spikes (dozens–hundreds of KiB)
- Near-zero "writeback now" activity
- Conclusion: Page cache is functioning optimally; no swap pressure or sustained flush issues
Memory Allocation Patterns
Kernel Slab Usage
| Component | Both Agents | Status |
|---|---|---|
| Unreclaimable Slab | ~48 MiB | Identical, no concerns |
| Reclaimable Slab | ~35–37 MiB | Identical, healthy levels |
File-Backed vs Anonymous Memory
| Memory Type | Fluent Bit | OpenTelemetry Collector | Difference |
|---|---|---|---|
| Mapped File Pages | ~221–244 MiB | ~349–370 MiB | OC +125 MiB higher |
| Anonymous Memory | ~192–199 MiB | ~151–165 MiB | FB +40 MiB higher |
Analysis:
- OpenTelemetry Collector: More memory-mapped code/segments (Go runtime + processors)
- Fluent Bit: C buffers/queues use anonymous memory, less file-backed mappings
LRU (Least Recently Used) Memory Behavior
Active vs Inactive Memory Pages
| LRU Category | Fluent Bit | OpenTelemetry Collector |
|---|---|---|
| Active File | ~690 MiB | ~478–502 MiB |
| Active Anonymous | 175–182 MiB | 134–148 MiB |
| Inactive File | ~137–140 MiB | ~129–140 MiB |
Key Insights:
- Fluent Bit: Maintains more active cache and larger hot working set
- OpenTelemetry Collector: Smaller active cache, more memory appears as mapped
Performance Implication: Fluent Bit keeps more file cache hot (optimal for frequent small writes/reads), while OTel Collector's memory is more mmapped (better for batching & fewer syscalls).
System Memory Regions
Protected Memory Areas
| Region Type | Value | Description |
|---|---|---|
| Unevictable/MLocked | ~39 MiB / 26.6 MiB | Kernel housekeeping (not agent overhead) |
| DirectMap | ~1.92 GiB of 2 MiB pages | Standard page mapping |
| HugePages | 0 | None in use (expected) |
| Vmalloc | ~11 MiB | Minimal usage, no fragmentation |
Architecture Summary
Fluent Bit Memory Model:
- Shape: Hot file cache + lean process
- Strength: Excellent for high-frequency, small-batch operations
- Trade-off: More syscalls, but efficient cache utilization
OpenTelemetry Collector Memory Model:
- Shape: Larger mmaps/queues + cooler cache
- Strength: Superior for complex in-pipeline processing
- Trade-off: Higher memory overhead, but fewer syscalls
Decision Framework: Choose based on your traffic pattern and the amount of "thinking" you need in-pipeline. Fluent Bit excels at efficient data movement, while OTel Collector excels at data transformation and processing.
VMStat Analysis: Page Cache Behavior
Test Environment
Configuration: 1-vCPU / 2 GiB node comparison (Fluent Bit vs OpenTelemetry Collector)
Page Cache Activity
Paging Operations (In/Out)
| Agent | Page-In (pgpgin) | Page-Out (pgpgout) | Pattern |
|---|---|---|---|
| Fluent Bit | Mean: ~8.2 ops/s Max: ~1.36k ops/s | Mean: ~4.4 ops/s Max: ~159 ops/s | High steady activity with tall spikes |
| OpenTelemetry Collector | Mean: ~0.51 ops/s Max: ~109 ops/s | Mean: ~2.29 ops/s Max: ~16.8 ops/s | Lower baseline, smaller spikes |
Analysis: Fluent Bit interacts with the page cache significantly more, showing higher steady page-in/out activity and taller spikes. This aligns with its small-batch, frequent I/O pattern, while the Collector's bigger batches keep paging activity calmer.
Page Fault Analysis
Minor vs Major Page Faults
| Agent | Minor Faults | Major Faults | Interpretation |
|---|---|---|---|
| Fluent Bit | Mean: ~137 ops/s Spikes: ~4.87k ops/s | ~0 | High buffer turnover, working set in RAM |
| OpenTelemetry Collector | Mean: ~52 ops/s Spikes: ~842 ops/s | ~0 | Lower churn, working set in RAM |
Key Insights:
- Both agents keep their working sets in RAM (major faults ≈ 0)
- Fluent Bit shows more minor-fault churn, consistent with frequent small buffer operations
- No disk-backed memory pressure on either agent
Memory Pressure Indicators
Swap and OOM Analysis
| Metric | Both Agents | Status |
|---|---|---|
| Swap Activity | 0 (no pswpin/pswpout) | No swap pressure |
| OOM Killer Events | 0 | No out-of-memory conditions |
Health Verdict: No memory pressure detected on either agent. The differences observed are about memory churn patterns, not capacity limitations.
Technical Notes
Monitoring Artifacts: Small negative values in page-in/out metrics are normal artifacts from rate() calculations over counter resets—not indicative of system issues.
Memory Behavior Summary
Fluent Bit Memory Pattern
- Characteristic: Higher page-cache churn with more minor faults/page-ins
- Benefit: Very predictable, low-latency write operations
- Best For: Environments where consistent, small-batch processing is preferred
OpenTelemetry Collector Memory Pattern
- Characteristic: Calmer paging overall with periodic large flushes
- Benefit: More efficient batching with fewer kernel interactions
- Best For: Environments where burst processing and complex transformations are needed
Selection Criteria: Choose the memory behavior pattern that complements your node's overall workload characteristics and resource constraints.
Comprehensive System Analysis: VM, Process & Clock Behavior
Memory & Virtual Memory Activity
Committed Memory Analysis
| Agent | Committed Memory | Status |
|---|---|---|
| Fluent Bit | ~1.84–1.92 GiB | Well under commit-limit |
| OpenTelemetry Collector | ~1.33–1.38 GiB | Lower kernel promised bytes |
Status: Both agents operate well within memory commit limits
Memory Mapping Patterns
| Memory Type | Fluent Bit | OpenTelemetry Collector | Analysis |
|---|---|---|---|
| Mapped Memory | 221–244 MiB | 347–370 MiB | OTel uses more mmaps/shared segments |
| Anonymous Memory | ~194 MiB mean | ~157 MiB mean | Fluent Bit keeps more private/heap pages warm |
Key Insight: OpenTelemetry Collector relies more on memory-mapped segments (plugins, batching, encoders), while Fluent Bit uses more traditional heap allocation patterns.
Page Cache & Writeback Behavior
| Metric | Fluent Bit | OpenTelemetry Collector | Pattern |
|---|---|---|---|
| Dirty Pages (Mean) | ~58 KiB | ~44 KiB | More frequent small writes |
| Dirty Pages (Spikes) | ~4 MiB during bursts | Smaller periodic spikes | Batch amortization |
Analysis: Fluent Bit generates more frequent small dirty pages; OTel Collector amortizes writes into fewer, larger bursts.
LRU (Least Recently Used) Balance
| LRU Category | Fluent Bit | OpenTelemetry Collector | Implication |
|---|---|---|---|
| Active Pages | ~44% | ~33% | Larger "hot" working set |
| Inactive Pages | ~7% | ~7% | Similar reclaimable memory |
Performance Impact: Fluent Bit maintains a larger hot working set; OTel Collector leaves more mapped memory that's easily reclaimable.
System Memory Regions
| Region | Both Agents | Status |
|---|---|---|
| Vmalloc | ~11 MiB of 32 TiB | Negligible usage |
| HugePages | 0 | None in use (expected) |
| Kernel-pinned | ~39 MiB | Normal kernel housekeeping |
| MLocked Pages | ~26 MiB | Standard application locking |
Paging, Faults & Swap Analysis
Page I/O Operations
| Operation | Fluent Bit | OpenTelemetry Collector |
|---|---|---|
| Page-ins (Mean) | ~8 ops/s | ~0.5 ops/s |
| Page-ins (Spikes) | Up to 1.36K ops/s | Up to 109 ops/s |
| Page-outs | Higher frequency | Lower frequency |
Memory Fault Analysis
| Fault Type | Fluent Bit | OpenTelemetry Collector |
|---|---|---|
| Minor Faults (Mean) | ~137 ops/s | ~52 ops/s |
| Minor Faults (Spikes) | ~4.9K ops/s | ~842 ops/s |
| Major Faults | ~0 | ~0 |
Conclusion: Fluent Bit touches more new pages (consistent with high-frequency, small-batch pattern), while OTel Collector's larger in-memory queues result in fewer page faults overall.
Swap & OOM Status
| Metric | Both Agents | Status |
|---|---|---|
| Swap Activity | 0 (no pswpin/pswpout) | No swap pressure |
| OOM Events | 0 | No out-of-memory kills |
System Clock & Time Synchronization
| Time Sync Metric | Both Agents | Status |
|---|---|---|
| PLL Constant | 2 | Identical behavior |
| Clock Drift | Tens of µs (saw-tooth) | Normal variation |
| Sync Status | 1 | Synchronized |
| Frequency Adjustment | Flat | Stable |
Conclusion: No clock synchronization bias introduced by either agent
Process & CPU Scheduling Behavior
Process Queue Analysis
| Queue Type | Both Agents | Analysis |
|---|---|---|
| Runnable Processes | ~1–1.4 | Low queueing pressure |
| Blocked on I/O | ~0 most of the time | Minimal I/O blocking |
Process Fork Patterns
| Agent | Mean Fork Rate | Spike Rate | Behavior |
|---|---|---|---|
| Fluent Bit | ~0.16 forks/s | ~1.9/s (rare) | Minimal process spawning |
| OpenTelemetry Collector | ~0.37 forks/s | ~22/s (spikes) | More short-lived helpers |
Conclusion: OpenTelemetry Collector spawns more short-lived helper processes for exporter retries and pipeline management.
CPU Utilization per Core
| Agent | Mean CPU Usage | Peak CPU Usage | Resource Efficiency |
|---|---|---|---|
| Fluent Bit | ~27–28% | ~40% | Lower sustained usage |
| OpenTelemetry Collector | ~41–42% | ~56% | Higher CPU consumption |
Conclusion: OpenTelemetry Collector is the heavier CPU user on identical workloads—still within healthy limits but more resource-intensive.
Performance Characteristics Summary
Fluent Bit Profile
- Pattern: Small batches, more page churn, higher minor faults, frequent writeback
- CPU Usage: Lower sustained CPU consumption
- Memory Behavior: More traditional heap-based allocation
- I/O Pattern: High-frequency, small-batch writes
OpenTelemetry Collector Profile
- Pattern: Larger batches, more memory maps, fewer page faults
- CPU Usage: Higher CPU consumption with occasional fork spikes
- Memory Behavior: More memory-mapped segments and shared memory
- I/O Pattern: Batched, amortized writes
Architecture Trade-off: Both designs are valid but stress different kernel subsystems. Fluent Bit's frequent disk activity is noticeable on slower storage; OpenTelemetry Collector's CPU overhead is felt on resource-constrained systems.
Resource Usage Patterns
| Aspect | Fluent Bit | OpenTelemetry Collector |
|---|---|---|
| CPU Efficiency | Lower sustained usage | Higher CPU consumption |
| Memory Pattern | Higher page churn | More mapped memory |
| I/O Behavior | Frequent small writes | Batched large writes |
Decision Framework
Choose Fluent Bit when:
- CPU efficiency is paramount
- Simple data forwarding is sufficient
- Resource constraints are tight
- Predictable, low-latency processing is needed
Choose OpenTelemetry Collector when:
- Rich in-pipeline transformations are required
- CPU resources are abundant
- Complex routing and processing logic is needed
- Future-proofing and vendor neutrality matter
Conclusion: Fluent Bit remains the lean data shipper, while OpenTelemetry Collector serves as the feature-rich processing pipeline. Choose based on whether you prioritize resource efficiency or processing capabilities.
Storage & Disk Performance Analysis
Resource Utilization Summary
CPU Performance Comparison
| Agent | Per-Core Saturation | CPU Overhead | Performance Impact |
|---|---|---|---|
| Fluent Bit | ~27–28% average | Baseline | Efficient processing |
| OpenTelemetry Collector | ~41–42% average | 50–55% higher | More resource-intensive |
Key Finding: OpenTelemetry Collector requires significantly more CPU resources for identical workloads.
Memory Usage Analysis
| Memory Metric | Fluent Bit | OpenTelemetry Collector | Difference |
|---|---|---|---|
| System RAM Usage | ~21% | ~23–24% | +2–3% higher |
| Application Memory | ~3.6 GiB | ~4.2 GiB | +0.6 GiB higher |
Paging & Memory Fault Behavior
| Metric | Fluent Bit | OpenTelemetry Collector |
|---|---|---|
| Page-ins/Minor Faults | Higher frequency, bursty spikes (low-thousands ops/s) | Lower frequency, smoother pattern |
| Swap Activity | 0 (no swap pressure) | 0 (no swap pressure) |
Disk I/O Characteristics
Write Pattern Analysis
| Agent | Write Behavior | Queue Depth | I/O Wait Time |
|---|---|---|---|
| Fluent Bit | Higher write rate, frequent writeback/dirty bursts | Occasional larger single spikes | ~1 ms average |
| OpenTelemetry Collector | Fewer, larger batches | Many tiny spikes, smoother overall | ~1 ms average |
Conclusion: Neither agent approaches disk limits; both maintain healthy I/O patterns with minimal wait times.
System Health Indicators
| System Component | Both Agents | Status |
|---|---|---|
| Kernel Memory (Slab/MLocked/HugePages/Vmalloc) | Normal levels | Healthy |
| OOM Events | 0 | No memory pressure |
| Swap Usage | 0 | No swap pressure |
| Time Sync Drift | Tens of µs | Identical, minimal |
| Process Runnable Queue | ~1–1.4 | Low queueing pressure |
| Process Forks | FB: minimal, OTel: more (housekeeping/exporters) | Normal operation |
Performance Pattern Analysis
Fluent Bit Architecture
- Strategy: Leverages page cache and kernel writeback
- I/O Pattern: Smaller, more frequent I/O operations
- Trade-off: More vmstat activity and faults, lower total CPU usage
- Best For: Cost-efficient log/metric shipping with minimal resource overhead
OpenTelemetry Collector Architecture
- Strategy: Maintains larger batches in user-space
- I/O Pattern: Fewer, larger batch operations
- Trade-off: Higher CPU and memory usage, reduced syscall churn, cleaner paging
- Best For: Complex in-pipeline processing, transformations, and multi-protocol support
Performance Trade-off: Choose Fluent Bit for efficiency-focused deployments, or OpenTelemetry Collector when advanced processing capabilities justify the resource premium.
Key Performance Metrics
Quick Reference Numbers
| Metric | Fluent Bit | OpenTelemetry Collector |
|---|---|---|
| CPU (per-core mean) | ~27–28% | ~41–42% |
| RAM Usage | ~20–21% | ~23–24% |
| Application Memory | ~3.6 GiB | ~4.2 GiB |
| Page-ins | Higher (with spikes) | Lower |
| Minor Faults | ~52–137 ops/s | ~52 ops/s |
| Swap Activity | 0 | 0 |
| Disk Queue | Occasional larger spikes | Many tiny spikes |
| I/O Wait | ~1 ms max | ~1 ms max |
Capacity Planning & Cost Analysis
Infrastructure Sizing (24×7 Operations)
Target: ~50% headroom on production workloads
| Agent | Recommended Configuration | Cost Implication |
|---|---|---|
| Fluent Bit | 4-core instance (comfortable at ~27–28% usage) | Baseline cost |
| OpenTelemetry Collector | 6-core instance (near limit at ~41–42% usage) | 25–35% higher instance costs |
Cost Savings: Fluent Bit can deliver 25–35% instance-cost savings for edge shipping scenarios.
Performance Verdict
Fluent Bit emerges as the pragmatic performance and cost choice for straightforward telemetry shipping, offering:
- Lower CPU overhead (~50% less than OTel Collector)
- Reduced memory footprint
- Cost-effective scaling (25–35% infrastructure savings)
OpenTelemetry Collector justifies its resource premium when advanced capabilities are required:
- Rich processing pipeline features
- Multi-protocol support
- Complex transformation capabilities
Decision Framework: Choose based on whether you prioritize operational efficiency (Fluent Bit) or processing capabilities (OpenTelemetry Collector). Both integrate excellently with Parseable for comprehensive observability solutions.
Network Traffic Analysis
IP Throughput Comparison
| Direction | Fluent Bit | OpenTelemetry Collector | Difference |
|---|---|---|---|
| RX (Receive) | ~5.8 kB/s | ~30.3 kB/s | 5-6× higher |
| TX (Transmit) | ~11.7 kB/s | ~63.3 kB/s | 5-6× higher |
Packet Processing Rates
| Protocol | Metric | Fluent Bit | OpenTelemetry Collector | Impact |
|---|---|---|---|---|
| TCP | RX packets/s | ~3.2 p/s | ~12.7 p/s | 4× higher |
| TCP | TX packets/s | ~5.3 p/s | ~27.6 p/s | 5× higher |
| UDP | Bidirectional | ~95 mp/s | ~136 mp/s | Moderately higher |
| ICMP | Activity | Occasional spikes | Occasional spikes | Similar (health checks) |
Note: "mp/s" = milli-packets per second
Socket & Network Stack Usage
| Resource | Fluent Bit | OpenTelemetry Collector | Analysis |
|---|---|---|---|
| TCP Sockets (Active) | ~5 | ~8 | More concurrent connections |
| UDP Sockets | 4 | 5 | Slightly higher |
| SoftIRQ Processing | ~11 p/s | ~51 p/s | 5× more kernel network work |
| Packet Drops | 0 p/s | 0 p/s | No congestion issues |
Network Health Status
| Health Metric | Both Agents | Status |
|---|---|---|
| Network Errors | 0 | Clean operation |
| ARP Table | Stable (1 entry) | Normal |
| MTU/Link Speed | Identical | No fragmentation |
Network Behavior Analysis
OpenTelemetry Collector Network Profile:
- Sends richer control/metrics messages via gRPC/HTTP
- Higher metadata overhead per transaction
- More frequent batch transmissions
- Increased kernel softnet processing load
Fluent Bit Network Profile:
- Lean protocol usage with minimal overhead
- Fewer concurrent connections
- Lower packet rates with efficient batching
- Reduced kernel network processing
Network Performance Verdict: Both agents maintain healthy network operation with zero packet drops or errors. However, OpenTelemetry Collector generates 5-6× more network traffic and requires 5× more kernel network processing due to its richer telemetry pipeline. Choose Fluent Bit for bandwidth-constrained environments.
Conclusion
This comprehensive profiling experiment emerged organically while our team was instrumenting and setting up the OpenTelemetry Demo application for Parseable integration. What started as a routine demo setup evolved into a fascinating deep-dive into observability agent performance characteristics.
The Journey
While working on creating seamless integration guides for both Fluent Bit and OpenTelemetry Collector with the OTel Demo application, we realized we had the perfect opportunity to conduct a rigorous side-by-side performance comparison. The controlled environment, identical workloads, and comprehensive monitoring setup provided an ideal testbed for agent profiling.
Key Findings Summary
Fluent Bit emerges as the efficiency champion:
- 50% lower CPU consumption (~27-30% vs 40-45% per core)
- Smaller memory footprint with intelligent kernel page cache utilization
- Network-friendly with 5-6× less traffic generation
- Cost-effective for straightforward telemetry forwarding scenarios
OpenTelemetry Collector excels in processing capabilities:
- Rich transformation pipeline with extensive processor ecosystem
- Multi-protocol support for complex telemetry routing
- Future-proof architecture with vendor-neutral design
- Enterprise-ready for sophisticated observability requirements
Total Metrics Count Analysis
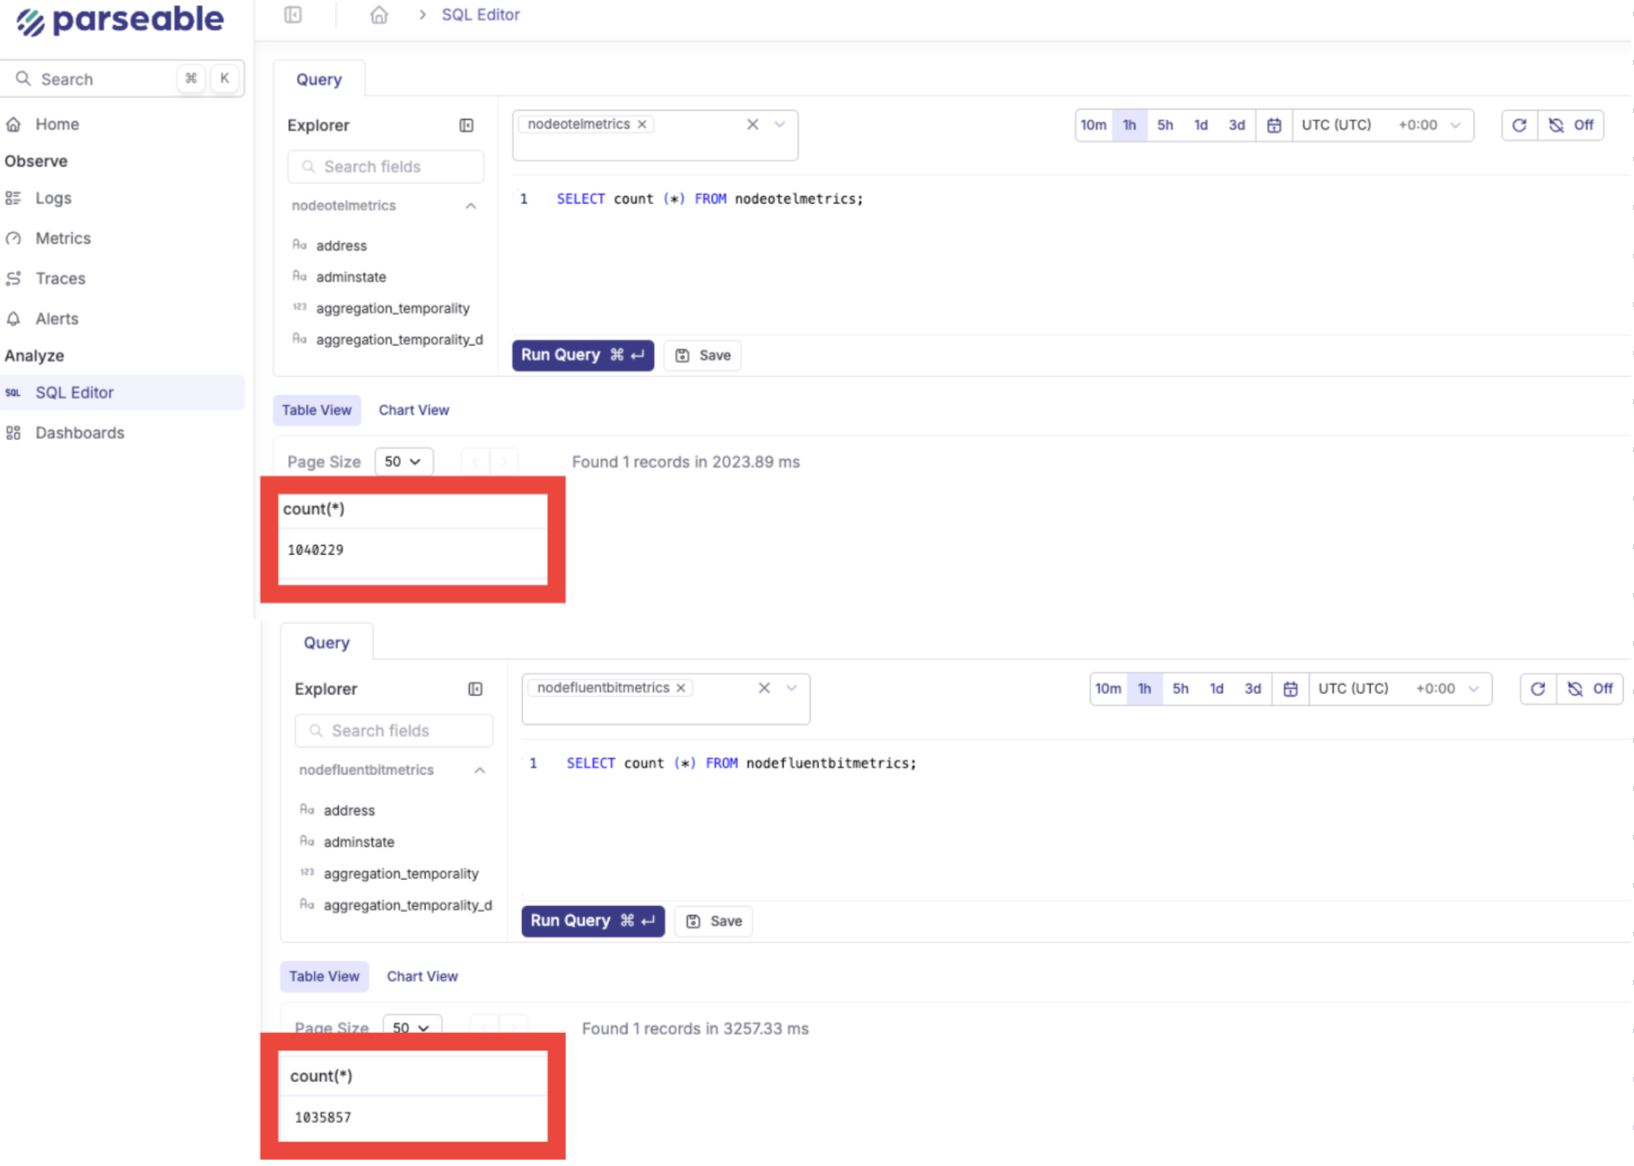
To validate data processing volumes, we performed a SELECT COUNT(*) query on the telemetry data ingested by each agent over the test period:
| Agent | Total Records Processed | Difference |
|---|---|---|
| OpenTelemetry Collector | 1,040,229 | Baseline |
| Fluent Bit | 1,035,857 | -4,372 records (-0.4%) |
Analysis: Both agents processed nearly identical data volumes, with OpenTelemetry Collector handling slightly more records. This minimal difference (0.4%) confirms our test methodology provided a fair comparison baseline, ensuring performance differences reflect agent efficiency rather than workload variations.
Practical Integration Guides
Based on this research, we've created comprehensive setup guides for both agents:
- Fluent Bit with OpenTelemetry Demo Application - Lightweight telemetry collection setup
- OpenTelemetry Collector with OpenTelemetry Demo Application - Full-featured observability pipeline
Both guides provide step-by-step instructions, configuration examples, and integration patterns with Parseable for immediate implementation.
What's Next: Data Format Performance Analysis
This profiling experiment was incredibly fun and revealed another fascinating research avenue. We've also benchmarked how each agent performs with different data serialization formats:
- Protocol Buffers (protobuf) - Binary efficiency vs processing overhead
- JSON - Human-readable vs bandwidth implications
- Compression strategies - gzip, snappy, and their impact on agent performance
The data format choice significantly affects CPU utilization, network bandwidth, and end-to-end latency. We'll be publishing a dedicated blog post on "Telemetry Data Format Performance: Protobuf vs JSON in Observability Pipelines" with detailed benchmarks and optimization recommendations.
Final Thoughts
Choosing between Fluent Bit and OpenTelemetry Collector isn't about finding a "winner" - it's about matching the right tool to your specific requirements. Whether you prioritize operational efficiency or processing capabilities, both agents integrate excellently with Parseable to deliver comprehensive observability solutions.
The real winner? The observability community, which benefits from having multiple high-quality, open-source options that excel in different scenarios.
Want to try these setups yourself? Check out the Github repository for the OpenTelemetry Demo Application.

