Introduction
Your customer support agent just told a user their refund was processed. It wasn't. The agent hallucinated a transaction ID, apologized for the "delay," and closed the ticket. Your dashboard shows 100% task completion. Your support queue is filling with angry customers.
This is the reality of running AI agents in production. They're powerful, autonomous, and completely opaque. When things go wrong and they always do, you're left staring at a black box, wondering what happened.
The traditional observability stack wasn't designed for this. Metrics, logs, and traces work beautifully for deterministic systems. But agents are probabilistic. They reason, they iterate, they make decisions that even their creators can't always predict. And yet, we're trying to monitor them with tools built for web servers.
This is the central tension of AI infrastructure today: we're deploying systems we don't fully understand, into production environments that demand reliability.
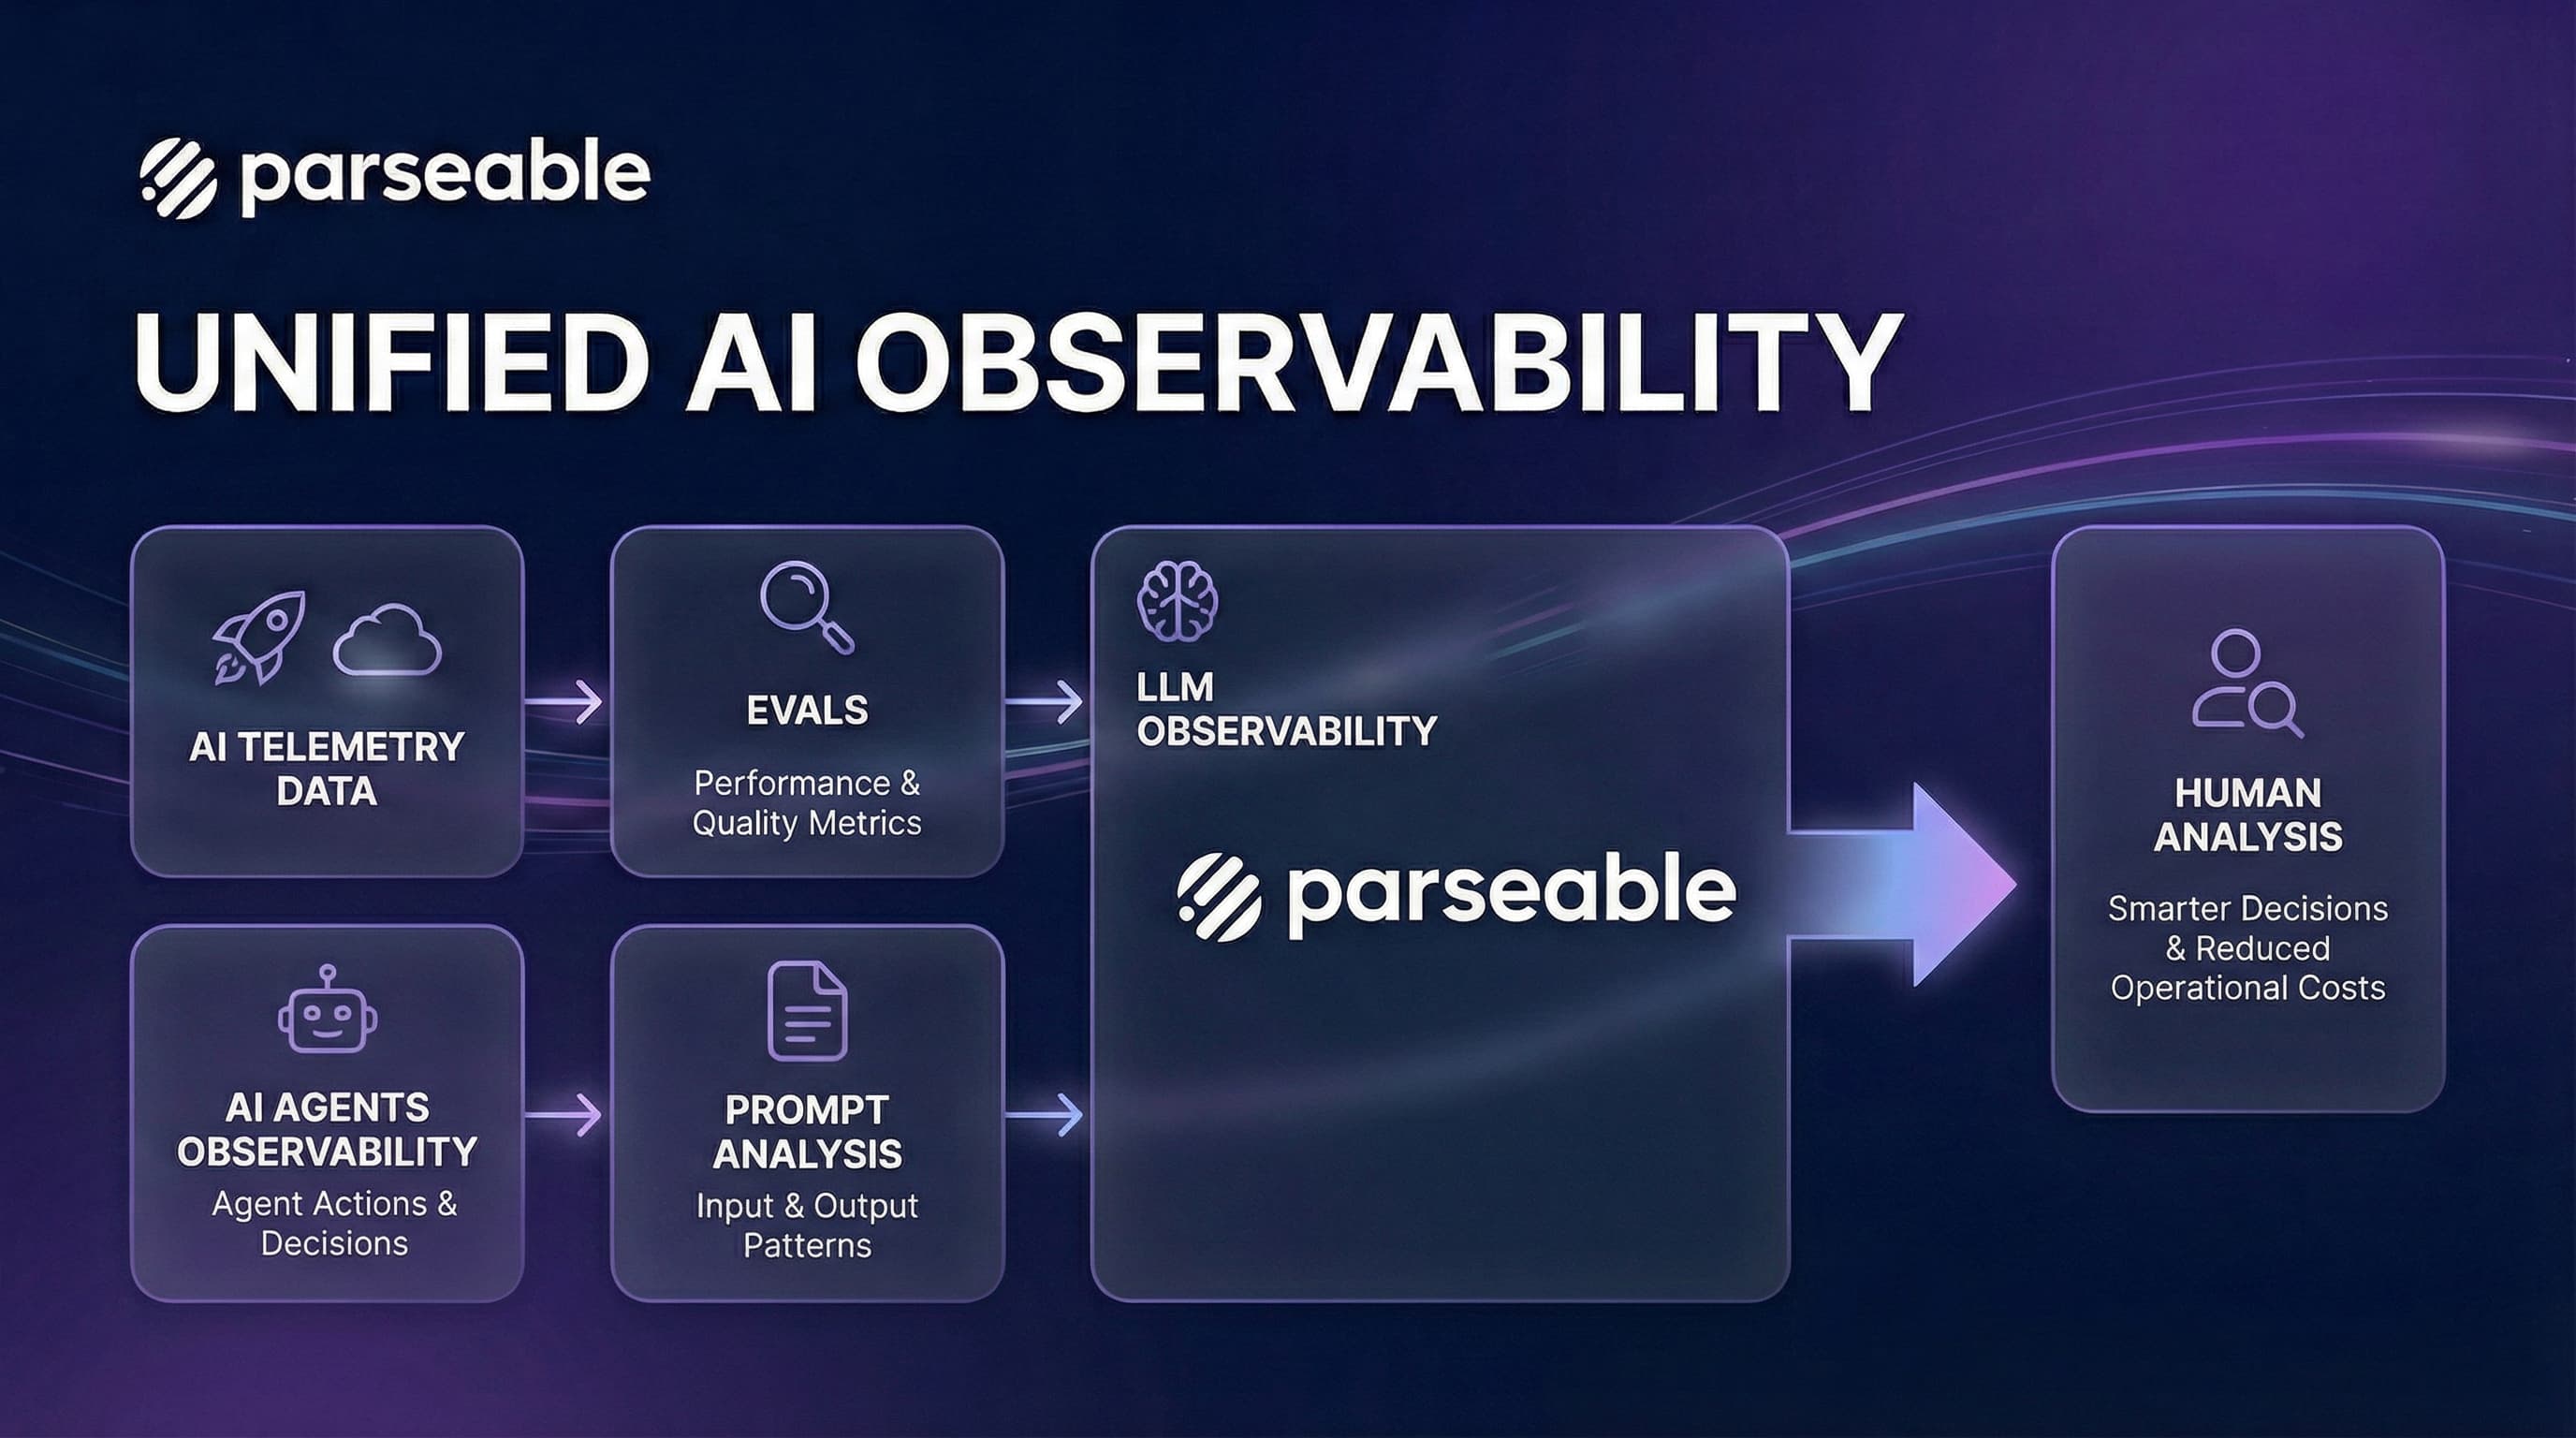
The solution isn't a single tool or technique. It's a new mental model—one that recognizes agent observability as three interconnected pillars: Evals (pre-production validation), LLM Observability (runtime monitoring), and Prompt Analysis (continuous optimization). Each pillar serves a distinct purpose, but they must work together to create a complete picture.
The Observability Gap in AI Systems
Before we dive into the pillars, let's understand why traditional observability falls short.
The Determinism Problem
Picture this: You deploy a coding agent on Monday. It handles 50 tasks flawlessly. Tuesday morning, the same agent, same code, same prompts, starts producing garbage. Nothing changed on your end.
What happened? Anthropic quietly updated Claude's weights overnight. Or OpenAI rotated to a different model instance. Or the agent's context window accumulated just enough cruft from previous sessions to push critical instructions out of memory.
In a traditional microservice, the same input produces the same output. You can write unit tests, integration tests, and end-to-end tests with confidence that passing tests mean working code.
Agents break this assumption. The same prompt can produce different outputs based on:
- Temperature settings: Higher temperature means more randomness
- Context window state: What the agent "remembers" from previous interactions
- Model version: Subtle changes in model weights affect behavior
- Time of day: Some providers route to different model instances based on load
This non-determinism means traditional testing is necessary but insufficient. You can't just write a test that says "given input X, expect output Y" because output Y might be different tomorrow.
The Latency Problem
Traditional services have predictable latency profiles. A database query takes 5ms or 500ms, and you can set alerts accordingly.
Agent latency is fundamentally different. Consider a real example from a coding agent:
- Task: "Add input validation to the signup form"
- Attempt 1: Agent reads the form, writes validation, runs tests. 45 seconds, $0.12. Done.
- Attempt 2 (same task, different day): Agent reads the form, gets confused by a comment, reads 15 more files "for context," writes validation for the wrong form, runs tests, fails, tries again, fails again, eventually times out. 8 minutes, $3.40. Failed.
Latency in agent systems isn't just about speed, it's about cost. Every second of "thinking" is tokens being consumed. Every retry loop is money being spent. And unlike traditional services, you often can't tell if the agent is making progress or spinning its wheels.
The Failure Mode Problem
Traditional systems fail in predictable ways: timeouts, null pointers, connection errors. You can enumerate failure modes and handle them.
Agents fail in novel ways. We've started naming these patterns because they're so common:
-
The Confident Hallucinator: The agent confidently produces incorrect information. It doesn't say "I don't know", it invents plausible-sounding answers. Your customer support agent tells users their order shipped when it didn't. Your coding agent claims tests pass when they failed.
-
The Goal Drifter: You ask the agent to "fix the login bug." Somewhere around iteration 5, it decides the real problem is the database schema and starts rewriting your ORM layer. Twenty minutes later, you have a broken codebase and no login fix.
-
The Infinite Apologizer: The agent tries something, fails, says "I apologize for the confusion," and tries the exact same thing again. And again. And again. Your logs show 47 iterations of the same failed approach.
-
The Context Amnesiac: You told the agent "don't modify the config files" in your system prompt. Thirty tool calls later, the context window is full, and that instruction has been pushed out. The agent cheerfully rewrites your production config.
These failures often don't throw exceptions. The agent reports "success" while producing garbage. Traditional error monitoring is blind to these semantic failures.
Evals
Evals are the first line of defense. They answer the question: "Is this agent ready for production?"
Think of evals as the pre-flight checklist for AI agents. Before an airplane takes off, pilots run through a checklist, not because they don't trust the plane, but because the stakes are too high for assumptions. Evals serve the same purpose.
What Evals Actually Measure
Evals go beyond traditional testing. They measure:
| Dimension | What It Captures | Example Metric |
|---|---|---|
| Correctness | Does the agent produce accurate outputs? | Accuracy on benchmark tasks |
| Consistency | Does the agent behave predictably? | Variance across repeated runs |
| Robustness | Does the agent handle edge cases? | Performance on adversarial inputs |
| Efficiency | Does the agent use resources wisely? | Tokens per successful task |
| Safety | Does the agent avoid harmful outputs? | Refusal rate on unsafe prompts |
The Eval Lifecycle
Evals aren't a one-time gate. They're a continuous process:
┌─────────────────────────────────────────────────────────────────────┐
│                        EVAL LIFECYCLE                               │
├─────────────────────────────────────────────────────────────────────┤
│                                                                     │
│   ┌──────────┐    ┌──────────┐    ┌──────────┐    ┌──────────┐      │
│   │  Design  │───▶│   Run    │───▶│ Analyze  │───▶│  Iterate │      │
│   │  Evals   │    │  Evals   │    │ Results  │    │  Prompts │      │
│   └──────────┘    └──────────┘    └──────────┘    └──────────┘      │
│        │                                               │            │
│        └───────────────────────────────────────────────┘            │
│                                                                     │
└─────────────────────────────────────────────────────────────────────┘-
Design Evals: Create test cases that represent real-world usage. Include happy paths, edge cases, and adversarial inputs.
-
Run Evals: Execute the agent against your test suite. Run multiple times to capture variance.
-
Analyze Results: Look beyond pass/fail. Examine token usage, latency distributions, and failure patterns.
-
Iterate Prompts: Use eval insights to refine system prompts, tool descriptions, and agent architecture.
Types of Evals
- Functional Evals: Does the agent complete the task correctly?
For example, if you have a coding agent, you might give it 100 different coding tasks and measure how many it solves correctly. A customer support agent might be evaluated on whether it correctly identifies the issue and provides accurate solutions. One team we know runs their agent against 500 historical support tickets every week—any drop below 92% accuracy blocks deployment.
- Behavioral Evals: Does the agent behave appropriately?
- Does it refuse harmful requests?
- Does it acknowledge uncertainty instead of hallucinating?
- Does it stay within defined boundaries?
For instance, a financial advisor agent should refuse to give specific stock tips ("I can't recommend specific investments, but here's how to think about diversification..."). A medical triage agent should always recommend seeing a doctor for serious symptoms rather than diagnosing ("These symptoms could indicate several conditions—please see a healthcare provider today").
- Performance Evals: Is the agent efficient?
- Token consumption per task type
- Latency percentiles (p50, p95, p99)
- Tool call efficiency (successful calls / total calls)
An agent that solves a problem correctly but uses 10x more tokens than necessary is burning money. One company discovered their "optimized" agent was actually 3x more expensive than the previous version—it solved problems faster but made twice as many LLM calls to do it. Performance evals caught this before production.
- Regression Evals: Did the latest change break anything?
- Compare current performance against baseline
- Track metrics over time
- Alert on significant degradation
When Anthropic releases a new Claude model or you tweak your system prompt, regression evals tell you if something broke. We've seen prompt changes that improved accuracy by 5% but increased token usage by 40%. Without regression evals, you'd never know.
Evals in CI/CD
The most mature teams integrate evals into their deployment pipeline. Every pull request that touches prompts or agent logic triggers an eval run. If evals fail, the PR doesn't merge. This is the same discipline we apply to unit tests, extended to AI systems.
The Eval-Production Gap
Here's the uncomfortable truth: evals don't guarantee production success.
An agent can pass every eval and still fail in production because:
- Real users phrase requests differently than eval prompts
- Production data has distributions your evals didn't anticipate
- Edge cases in production are infinite; eval cases are finite
- The production environment has latency, rate limits, and failures that evals don't simulate
This is why evals are necessary but not sufficient. They're the first pillar, not the only one.
LLM Observability
LLM observability answers the question: "What is the agent doing right now, and is it healthy?"
If evals are the pre-flight checklist, LLM observability is the black box flight recorder. It captures everything that happens during operation, so when something goes wrong—and it will—you can understand why.
Beyond Traditional APM
Traditional Application Performance Monitoring (APM) tracks:
- Request latency
- Error rates
- Throughput
- Resource utilization
LLM observability adds AI-specific dimensions:
| Signal | What It Captures | Why It Matters |
|---|---|---|
| Token Usage | Input/output tokens per call | Cost tracking and budget enforcement |
| Model Calls | Which models, how often | Understand model dependencies |
| Tool Executions | Which tools, success rates | Identify integration issues |
| Context Saturation | How full is the context window | Predict memory-related failures |
| Reasoning Chains | Step-by-step agent decisions | Debug complex failures |
The Trace Structure for Agents
A well-instrumented agent produces traces that tell a story:
invoke_agent "Fix authentication bug" (duration: 45.2s)
├── chat gpt-4o (3.1s) [iteration 1]
│   └── tokens: 2100 in, 450 out
│   └── "Let me explore the codebase..."
├── execute_tool find_file (0.8s)
│   └── args: {"pattern": "auth*.py"}
│   └── result: ["auth_middleware.py", "auth_utils.py"]
├── execute_tool read_file (0.2s)
│   └── args: {"path": "auth_middleware.py"}
├── chat gpt-4o (4.2s) [iteration 2]
│   └── tokens: 3200 in, 520 out
│   └── "I see the issue in the token validation..."
├── execute_tool edit_file (0.3s)
│   └── args: {"path": "auth_middleware.py", "changes": [...]}
├── execute_tool run_tests (12.1s)
│   └── result: "All tests passed"
└── chat gpt-4o (2.1s) [iteration 3]
    └── tokens: 3800 in, 180 out
    └── "Fix complete. All tests pass."
This trace reveals:
- The reasoning path: How the agent approached the problem
- Token accumulation: Context growing with each iteration
- Tool efficiency: Which tools were used and their outcomes
- Time distribution: Where the agent spent its time
Key Metrics for LLM Observability
- Cost Metrics: Track daily spend by model, identify which agents or features are most expensive, and catch runaway costs before they blow your budget.
Real example: A team noticed their daily LLM spend jumped from $200 to $800 overnight. The traces showed a single customer's workflow was triggering a loop—the agent kept calling a search API that returned no results, then asking the LLM "what should I try next?" 400 times. Total cost for that one stuck session: $340.
-
Performance Metrics: Monitor latency percentiles across your agent fleet. If your p95 latency suddenly jumps from 5 seconds to 30 seconds, you want to know immediately—not when users start complaining.
-
Reliability Metrics: Track tool failure rates, model error rates, and task completion rates. A 2% increase in tool failures might indicate an API change or rate limiting issue that needs attention. One team caught a breaking change in their database API this way—tool failures spiked from 0.1% to 15% over two hours.
Alerting for AI Systems
Traditional alerts don't capture AI-specific failures. You need:
Token Budget Alerts:
- Alert when hourly token usage exceeds threshold
- Alert when single agent run exceeds token limit
- Alert on anomalous token consumption patterns
Behavioral Alerts:
- Alert when agent iteration count exceeds threshold (possible loop)
- Alert when tool failure rate spikes
- Alert when context saturation exceeds 80%
Cost Alerts:
- Alert when daily spend exceeds budget
- Alert on cost anomalies (sudden spikes)
- Alert when cost-per-task exceeds threshold
The Observability-Eval Feedback Loop
Here's where the pillars connect: production observability feeds back into evals.
When you observe a failure pattern in production:
- Capture the trace: Record the full execution path
- Extract the scenario: Identify the input and context that caused the failure
- Create an eval case: Add this scenario to your eval suite
- Fix and validate: Iterate on the agent until the new eval passes
- Deploy with confidence: The failure mode is now covered
This creates a virtuous cycle where production failures become eval cases, preventing the same failure from recurring.
Prompt Analysis
Prompt analysis answers the question: "Why did the agent behave this way, and how can we improve it?"
The Prompt as Code
In traditional software, behavior is determined by code. In AI systems, behavior is determined by prompts. This shift has profound implications:
- Prompts are artifacts: They should be version-controlled, reviewed, and tested
- Prompts have bugs: Ambiguous instructions cause unpredictable behavior
- Prompts need optimization: Small changes can dramatically improve performance
Here's a real example of a "prompt bug." A coding agent's system prompt said:
"Be thorough. Read all relevant files before making changes."
Sounds reasonable, right? The agent interpreted "thorough" as "read every file that might possibly be related." For a simple bug fix, it was reading 40+ files, burning through context window and tokens. The fix? Change "thorough" to "focused":
"Be focused. Read only the files directly needed for the current task."
Token usage dropped 60%. Same agent, same capabilities, one word changed.
What Prompt Analysis Reveals
- Instruction Clarity: Are the agent's instructions unambiguous?
Common issues:
- Conflicting directives ("be concise" vs. "explain your reasoning"—which wins?)
- Missing constraints ("don't modify config files" was never stated, so the agent modified them)
- Assumed context (instructions reference "the standard format" but never define it)
- Tool Descriptions: Do tool descriptions accurately convey capabilities?
Common issues:
- Vague descriptions lead to tool misuse ("search_code: searches the codebase" doesn't tell the agent it only searches function names, not file contents)
- Missing parameter documentation causes argument errors
- Overlapping tool capabilities confuse the agent (when should it use
grepvsfind_filevssearch_code?)
- Example Quality: Do few-shot examples guide the right behavior?
Common issues:
- Examples don't cover edge cases
- Examples accidentally demonstrate anti-patterns (your "good" example shows the agent reading 10 files, so it thinks that's normal)
- Examples are too similar (all examples are simple cases, so the agent doesn't know how to handle complex ones)
Prompt Analysis Techniques
- Token Attribution: Which parts of the prompt influence which outputs?
By analyzing attention patterns and token probabilities, you can identify:
- Which instructions the model "pays attention to"
- Which parts of the context are ignored
- Where the model's confidence drops
- A/B Testing: Which prompt variant performs better?
For example, you might test three versions of your system prompt:
- Version A: "Answer in 2-3 sentences."
- Version B: "Provide a comprehensive answer with examples."
- Version C: "Answer using bullet points."
Run each variant through your eval suite and compare accuracy, token usage, and user satisfaction. Often, small wording changes yield surprising improvements. One team found that adding "Think step by step" to their prompt improved accuracy by 12% but increased token usage by 25%. Whether that's a good trade-off depends on your use case.
- Failure Clustering: What patterns emerge in failed runs?
Group failures by:
- Input characteristics (length, complexity, domain)
- Failure type (hallucination, tool error, timeout)
- Context state (saturation level, iteration count)
This reveals systematic issues that prompt changes can address.
The Prompt Optimization Workflow
┌─────────────────────────────────────────────────────────────────────┐
│                    PROMPT OPTIMIZATION WORKFLOW                     │
├─────────────────────────────────────────────────────────────────────┤
│                                                                     │
│   Production    ──▶   Failure      ──▶   Root Cause   ──▶  Prompt   │
│   Traces             Analysis           Identification     Change   │
│                                                                     │
│        │                                                     │      │
│        │                                                     ▼      │
│        │                                              ┌──────────┐  │
│        │                                              │   Eval   │  │
│        │                                              │  Suite   │  │
│        │                                              └────┬─────┘  │
│        │                                                   │        │
│        │              ◀────────────────────────────────────┘        │
│        │                                                            │
│        ▼                                                            │
│   Improved                                                          │
│   Production                                                        │
│   Behavior                                                          │
│                                                                     │
└─────────────────────────────────────────────────────────────────────┘- Identify Failure Patterns
Query your observability data to find systematic issues. Look for patterns like "tool X fails 15% of the time" or "requests longer than 500 words have 3x higher failure rates." These patterns point to specific prompt improvements.
- Analyze Root Causes
For each failure pattern, examine the traces:
- What was the agent trying to do?
- What context did it have?
- Where did the reasoning go wrong?
- Hypothesize Prompt Changes
Based on root cause analysis:
- Add missing constraints
- Clarify ambiguous instructions
- Improve tool descriptions
- Add relevant examples
- Validate with Evals
Before deploying prompt changes:
- Run the full eval suite
- Specifically test the failure scenarios
- Check for regressions in other areas
- Deploy and Monitor
After deployment:
- Watch for the specific failure pattern
- Monitor overall metrics for regressions
- Capture new failure patterns for the next iteration
Pre-Production vs. Post-Production
The three pillars operate across two phases: pre-production and post-production. Understanding how they interact is crucial.
Pre-Production
| Activity | Pillar | Goal |
|---|---|---|
| Design eval suite | Evals | Define success criteria |
| Run benchmark evals | Evals | Measure baseline performance |
| Analyze prompt effectiveness | Prompt Analysis | Optimize before deployment |
| Set up instrumentation | LLM Observability | Prepare for production monitoring |
| Define alert thresholds | LLM Observability | Establish operational boundaries |
Key Question: Is this agent ready for production?
Success Criteria:
- Eval pass rate above threshold (e.g., 95%)
- Token efficiency within budget
- No critical safety failures
- Latency within SLA requirements
Post-Production
| Activity | Pillar | Goal |
|---|---|---|
| Monitor real-time metrics | LLM Observability | Detect issues early |
| Investigate failures | LLM Observability + Prompt Analysis | Understand root causes |
| Create regression evals | Evals | Prevent recurrence |
| Optimize prompts | Prompt Analysis | Improve performance |
| Track cost trends | LLM Observability | Manage budget |
Key Question: Is this agent performing as expected?
Success Criteria:
- Error rate below threshold
- Cost within budget
- Latency meeting SLAs
- No novel failure patterns
The Continuous Improvement Cycle
The three pillars form a continuous improvement cycle:
                    ┌─────────────────┐
                    │   PRODUCTION    │
                    │   DEPLOYMENT    │
                    └────────┬────────┘
                             │
                             ▼
              ┌──────────────────────────────┐
              │     LLM OBSERVABILITY        │
              │  • Monitor metrics           │
              │  • Detect anomalies          │
              │  • Capture failures          │
              └──────────────┬───────────────┘
                             │
                             ▼
              ┌──────────────────────────────┐
              │     PROMPT ANALYSIS          │
              │  • Analyze failure patterns  │
              │  • Identify root causes      │
              │  • Hypothesize improvements  │
              └──────────────┬───────────────┘
                             │
                             ▼
              ┌──────────────────────────────┐
              │          EVALS               │
              │  • Create regression tests   │
              │  • Validate improvements     │
              │  • Measure impact            │
              └──────────────┬───────────────┘
                             │
                             ▼
                    ┌─────────────────┐
                    │   IMPROVED      │
                    │   AGENT         │
                    └────────┬────────┘
                             │
                             └──────────▶ (back to production)
Implementing the Three Pillars
Architecture for Unified Observability
To implement all three pillars, you need infrastructure that supports:
- Trace Collection: Capture detailed execution traces from agents
- Metric Aggregation: Compute and store performance metrics
- Eval Execution: Run eval suites against agents
- Query Interface: Analyze data across all three pillars
The key insight is that these shouldn't be separate systems. When an agent fails in production, you want to ask: "Has this failure pattern appeared in our evals? What prompt version was running? How does this trace compare to successful runs?" That requires unified data.
┌─────────────────────────────────────────────────────────────────────┐
│                     UNIFIED OBSERVABILITY STACK                     │
├─────────────────────────────────────────────────────────────────────┤
│                                                                     │
│   ┌──────────┐    ┌──────────┐    ┌──────────┐    ┌──────────┐      │
│   │  Agent   │    │  Agent   │    │  Agent   │    │  Eval    │      │
│   │  Prod A  │    │  Prod B  │    │  Prod C  │    │  Runner  │      │
│   └────┬─────┘    └────┬─────┘    └────┬─────┘    └────┬─────┘      │
│        │               │               │               │            │
│        └───────────────┴───────────────┴───────────────┘            │
│                                │                                    │
│                                ▼                                    │
│                    ┌───────────────────────┐                        │
│                    │   OpenTelemetry       │                        │
│                    │   Collector           │                        │
│                    └───────────┬───────────┘                        │
│                                │                                    │
│                                ▼                                    │
│                    ┌───────────────────────┐                        │
│                    │      Parseable        │                        │
│                    │   • Traces            │                        │
│                    │   • Metrics           │                        │
│                    │   • Eval Results      │                        │
│                    └───────────┬───────────┘                        │
│                                │                                    │
│              ┌─────────────────┼─────────────────┐                  │
│              ▼                 ▼                 ▼                  │
│        ┌──────────┐     ┌──────────┐     ┌──────────┐               │
│        │Dashboards│     │  Alerts  │     │  SQL     │               │
│        │          │     │          │     │  Queries │               │
│        └──────────┘     └──────────┘     └──────────┘               │
│                                                                     │
└─────────────────────────────────────────────────────────────────────┘
Instrumentation Best Practices
For Evals:
- Store eval results alongside production traces
- Include eval metadata (suite name, version, timestamp)
- Track eval metrics over time to detect drift
For LLM Observability:
- Use OpenTelemetry GenAI semantic conventions
- Capture token usage at every LLM call
- Record tool arguments and results (with appropriate redaction)
- Track context window utilization
For Prompt Analysis:
- Version control all prompts (yes, in git, with code review)
- Log prompt versions with traces
- Capture prompt-specific metrics (e.g., instruction following rate)
Debugging a Runaway Agent
Consider a coding agent that suddenly starts taking 10x longer to complete tasks. Without observability, you're guessing. With proper instrumentation, you can see:
- The agent is making 15 iterations instead of the usual 3
- Each iteration, it's calling the same "read_file" tool on the same file
- The context window is 95% full by iteration 5
- The agent's reasoning shows it "forgot" the file contents it already read
Root cause: A recent prompt change removed the instruction to summarize file contents before adding them to context. The agent was re-reading files because it couldn't find the information in its bloated context.
Fix: Add back the summarization instruction. Create an eval case for this scenario. Deploy with confidence.
The Future of Agent Observability
As agents become more sophisticated, observability must evolve:
Multi-Agent Systems
When multiple agents collaborate, observability becomes distributed tracing across agent boundaries. Imagine a research agent that delegates to a web search agent, a summarization agent, and a fact-checking agent. When the final output is wrong, you need to trace which agent introduced the error and why.
Long-Running Agents
Agents that run for hours or days (like autonomous coding agents working on large refactors) need:
- Checkpoint-based observability (periodic state snapshots)
- Resource consumption tracking over time
- Drift detection (is the agent's behavior changing as context accumulates?)
Self-Improving Agents
Agents that modify their own prompts or behavior (increasingly common with meta-learning approaches) need:
- Audit trails of self-modifications
- Guardrails to prevent harmful self-optimization
- Rollback capabilities when self-improvement fails
Conclusion
We're past the "demo phase" of AI agents. In a demo, it doesn't matter if the agent takes three attempts, runs the wrong tool, or quietly drops half your instructions. In production, that behavior shows up as blown SLAs, wasted spend, and engineers who no longer trust the system.
The three pillars work together:
- Evals give you confidence before deployment
- LLM Observability gives you visibility during operation
- Prompt Analysis gives you insight for improvement
Without evals, you're deploying blind. Without observability, you're operating blind. Without prompt analysis, you're improving blind.
When something goes wrong—and it will—you need to know where to look:
- If the agent is looping on the same approach, check the Evals for coverage gaps and the Observability traces for iteration patterns
- If it ignores constraints or forgets instructions, check the Observability data for context saturation and the Prompt Analysis for instruction clarity
- If it's burning through budget, check the Observability metrics for token usage and the Prompt Analysis for efficiency optimizations
The teams that master all three pillars will build agents that users can trust. The teams that ignore them will build agents that fail in production, burn through budgets, and erode confidence in AI systems.
Don't wait for the incident to shock you. Start instrumenting today.