

AWS generates a relentless stream of infrastructure and application signals. Every EC2 instance, Lambda function, RDS cluster, ALB, and managed service emits telemetry by default, and most teams enable even more on top of that. The problem is not collection. The problem is turning that volume into a coherent monitoring strategy, and that is where cloudwatch metrics become the foundation of AWS-native observability.
This guide explains what cloudwatch metrics actually are, how they work under the hood, and how to implement them properly across real workloads. It is written for DevOps engineers, SREs, and platform teams who already operate in AWS and want a practical reference, not a glossary.
We will also cover the two publishing paths most teams need to choose between: AWS-vended metrics emitted automatically by AWS services, and custom metrics published through OpenTelemetry or the CloudWatch PutMetricData API. The choice between them shapes everything downstream, from dimensions and queries to retention and cost.
What are CloudWatch metrics?
A CloudWatch metric is a time-ordered set of data points representing a single monitored variable over time. Each data point is a numeric value attached to a timestamp, and metrics are stored as time series inside Amazon CloudWatch.
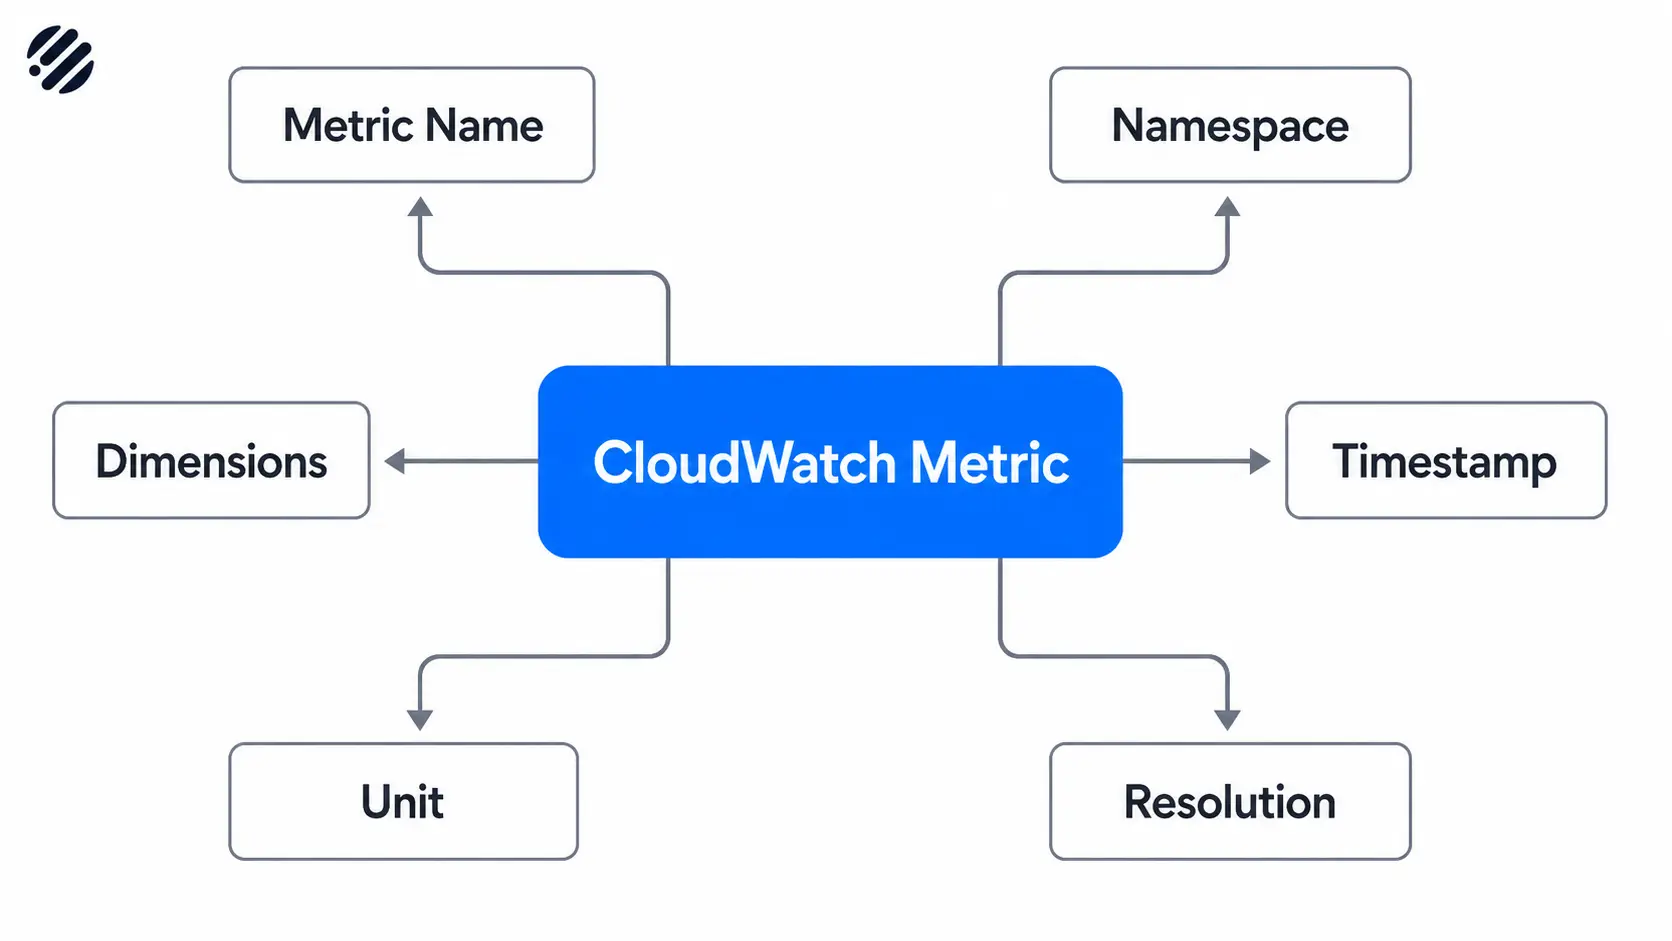
Every cloudwatch metric is identified by a small set of structural elements:
- Metric name. The variable being measured, such as
CPUUtilizationorRequestLatency. - Namespace. A logical container that isolates metrics from different sources. AWS services use namespaces like
AWS/EC2orAWS/Lambda. Custom metrics should use your own namespace, such asMyApp/Checkout. - Dimensions. Key-value pairs that scope a metric to a specific resource or attribute, like
InstanceId=i-0abc123orService=payments. Dimensions are how CloudWatch differentiates metrics that share a name. - Timestamp. The time the data point was recorded. CloudWatch accepts timestamps up to 2 weeks in the past and 2 hours in the future.
- Unit. The unit of measurement, such as
Bytes,Percent, orCount. Units are mostly metadata but matter for graphs and conversions. - Resolution. Standard resolution stores values at 1-minute granularity. High resolution stores values at 1-second granularity.
Together, these elements form the metric identity that CloudWatch uses to store, aggregate, and query data.
CloudWatch metrics vs logs vs traces
Metrics, logs, and traces are not interchangeable. Metrics are numeric, low-cardinality, and pre-aggregated. They are ideal for trends, thresholds, and alerting. Logs are high-cardinality event records used for investigation and forensics. Traces follow a single request across services and are essential for diagnosing latency in distributed systems.
If you want to know that latency is rising, a metric is the right signal. If you want to know why a specific request failed, you need logs and traces. Mature teams collect all three, but the workflows around each are different.
AWS-vended metrics vs custom metrics
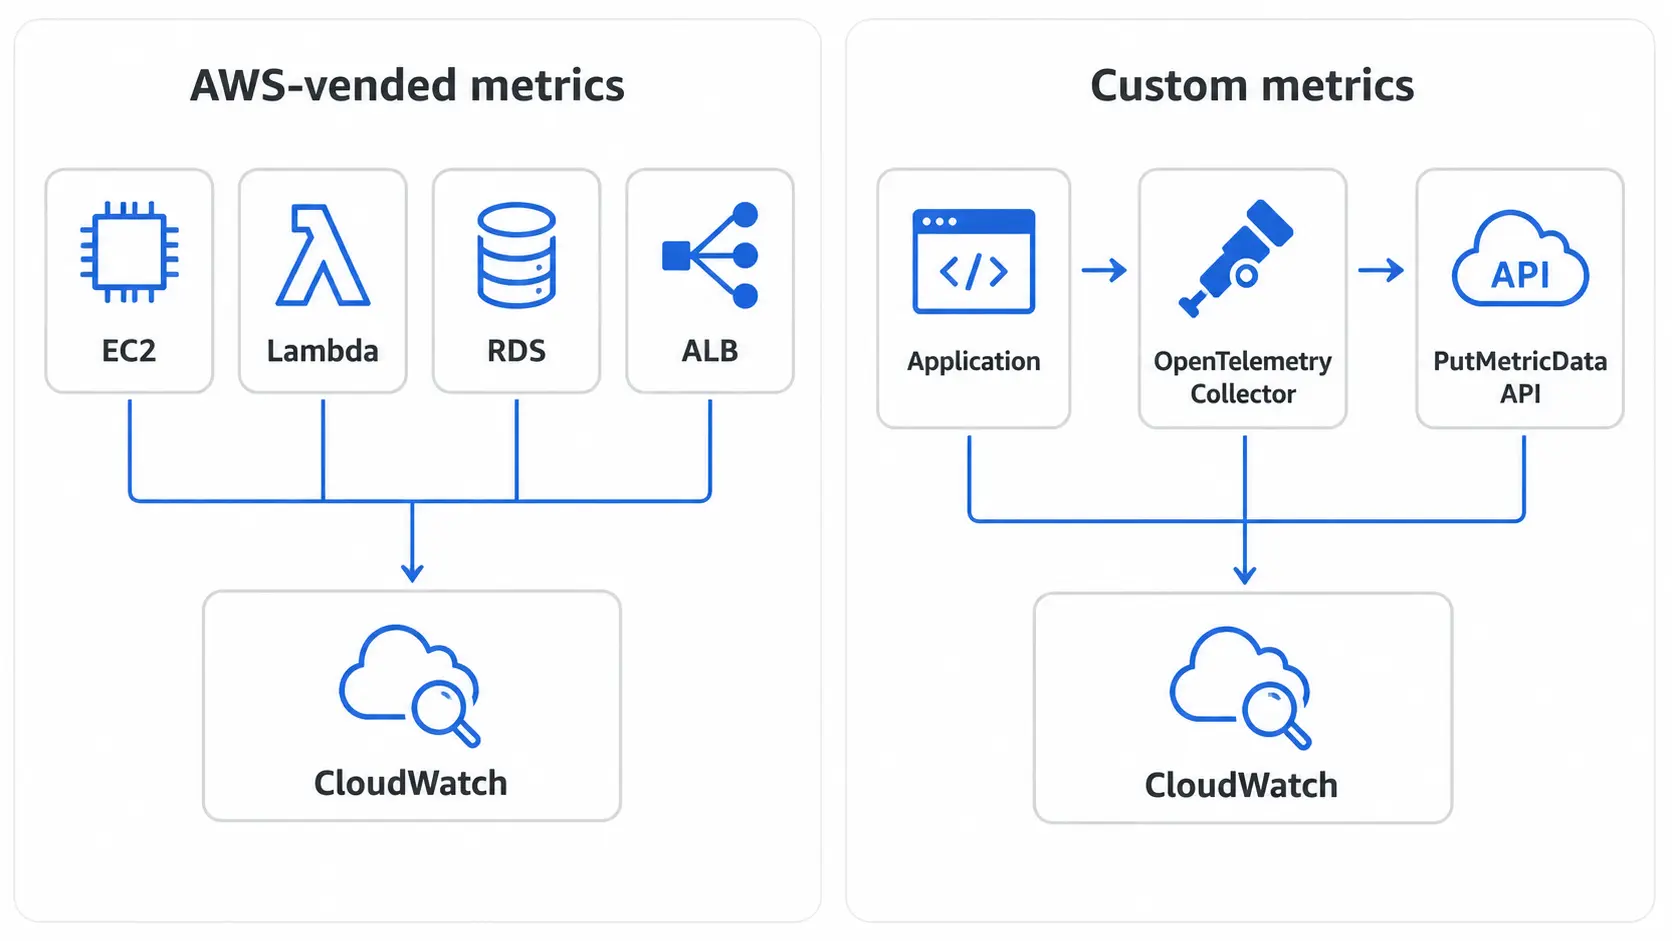
AWS services publish a curated set of metrics for you automatically. EC2 emits CPU, network, and disk metrics. Lambda emits invocation counts, errors, durations, and throttles. RDS emits CPU, IOPS, connection counts, and replication lag. These vended metrics arrive in CloudWatch without any configuration on your part.
Custom metrics are everything else. Application-level KPIs, business signals, queue depths, internal SLIs, anything CloudWatch does not provide by default. You publish these yourself, either through an agent, the OpenTelemetry Collector, or a direct PutMetricData API call.
The rule of thumb is simple: exhaust the vended metrics catalog before you start building custom ones. Most teams discover they already have 60 to 80 percent of what they need.
How CloudWatch metrics work
1. Metric collection
AWS services emit their default metrics automatically with no setup required. For deeper visibility into your workloads, you collect metrics through:
- The CloudWatch agent installed on EC2 instances or on-prem servers, for memory, disk, and process metrics that EC2 itself does not expose.
- The OpenTelemetry Collector, which can scrape, transform, and forward metrics from applications, Kubernetes clusters, and AWS services.
- Application SDKs that publish custom metrics directly using
PutMetricDataor an OpenTelemetry instrumentation library. - Embedded Metric Format (EMF) logs, where structured log entries are automatically converted into metrics by CloudWatch.
2. Metric publishing paths
There are two main ways to get custom metrics into CloudWatch, and the choice between them has long-term consequences.
Publish via OpenTelemetry. AWS now recommends OpenTelemetry (OTLP) for new metric implementations. The AWS Distro for OpenTelemetry (ADOT) ships an OTel Collector that can export metrics to CloudWatch using the awsemf exporter or the OTLP endpoint.
OTLP supports a richer metric model than the legacy CloudWatch API, including histograms, exponential histograms, and arbitrary labels. It also keeps your instrumentation vendor-neutral, which means the same SDK that emits to CloudWatch can also emit to Prometheus, Parseable, or any other OTLP-compatible backend.
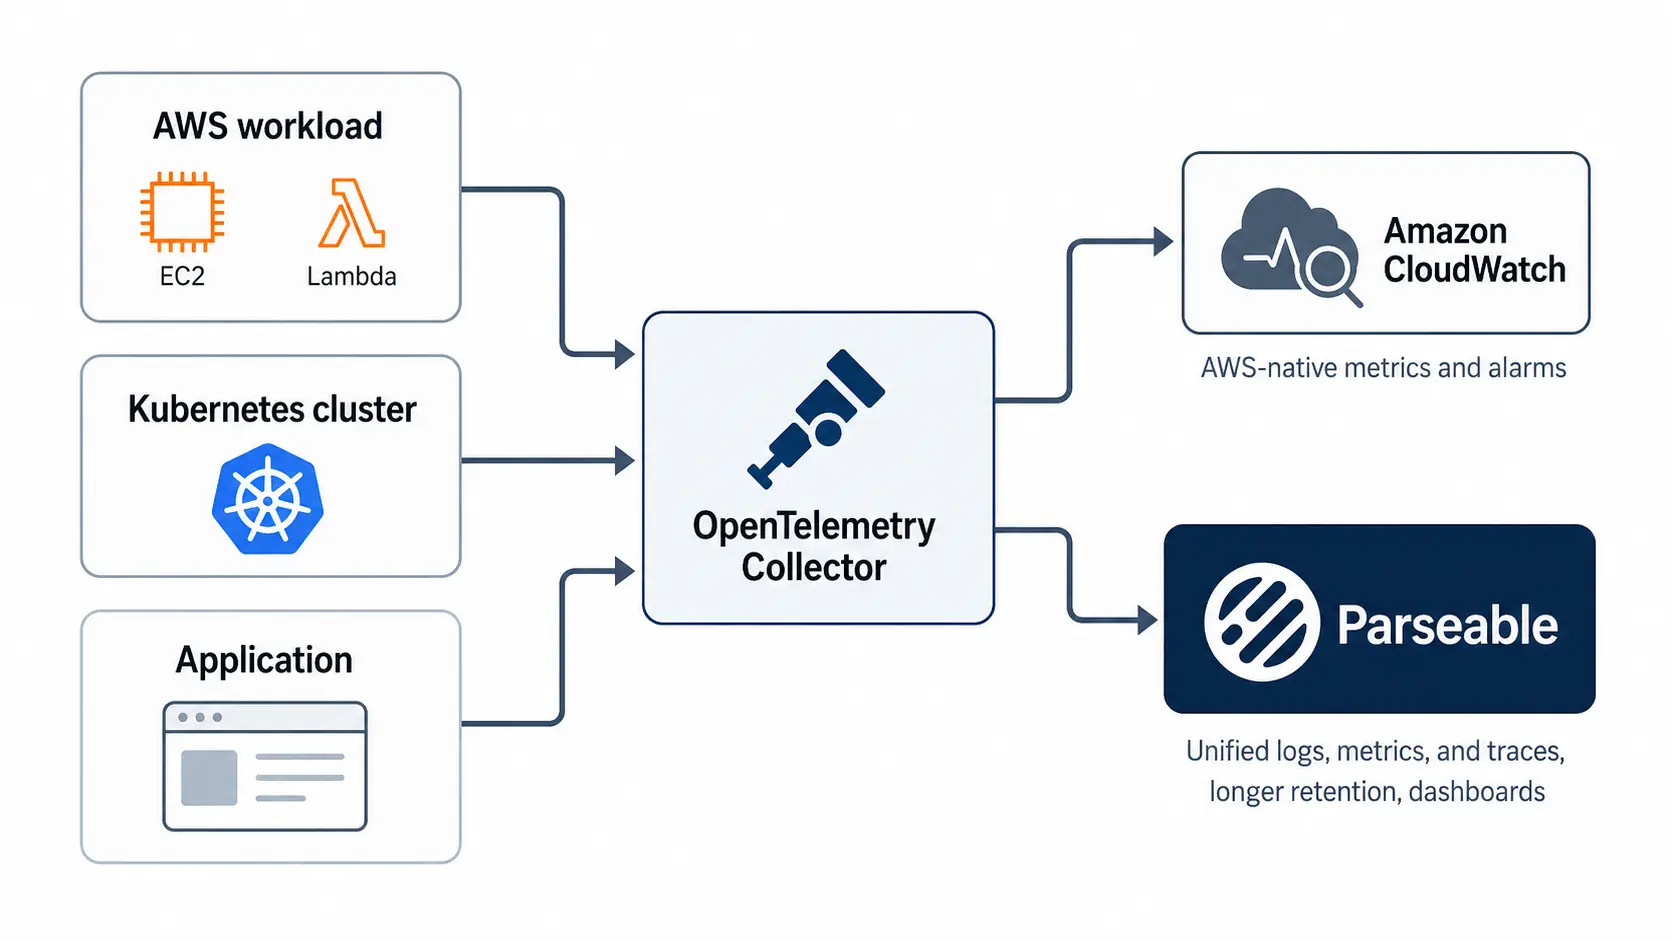
Teams that already run an OTel Collector should treat metrics as a routing decision, not a destination lock-in. The same pipeline can forward AWS-related telemetry to CloudWatch while also sending a copy to a unified observability backend like Parseable for longer retention, broader dashboards, and correlated logs and traces.
Publish via CloudWatch API / PutMetricData. The PutMetricData API is the original way to publish custom metrics. It accepts up to 1,000 metric data points per request, supports up to 30 dimensions per metric, and is straightforward to call from any language with an AWS SDK. It is still a perfectly good option for small, well-scoped publishing needs, especially when you already use the AWS SDK and do not want to run a Collector.
The trade-off is that PutMetricData ties you to CloudWatch's metric model. There are no histograms, only statistic sets. Dimensions are limited compared to OTLP labels. And every metric you publish is an API call you pay for.
3. Storage, retention, and aggregation
CloudWatch automatically rolls up metric data over time. The longer a data point ages, the coarser its resolution becomes:
- Sub-minute high-resolution data: retained for 3 hours.
- 1-minute data: retained for 15 days.
- 5-minute data: retained for 63 days.
- 1-hour data: retained for 455 days (15 months).
After 15 months, the data is deleted. This rollup is not optional and not configurable. Aggregation affects what you can analyze later: a one-second spike that mattered at 9 AM will be invisible by 9 PM next week.
For most infrastructure monitoring, this retention curve is enough. For SLO reporting, compliance, capacity planning, or incident post-mortems weeks later, it is often not. Teams that need longer, easier-to-query retention across signals frequently add a platform like Parseable around CloudWatch.
Parseable Pro includes 365 days of retention along with dashboards and alerts, so historical context survives well beyond CloudWatch's rollup window.
4. Querying and visualization
Once metrics are in CloudWatch, you can:
- View them in the CloudWatch console as line graphs, stacked area charts, or numeric widgets.
- Pin them to CloudWatch dashboards for at-a-glance views.
- Trigger alarms on thresholds or anomalies.
- Query them with CloudWatch Metrics Insights, a SQL-like language for ad hoc exploration.
- Use PromQL against OpenTelemetry-published metrics through CloudWatch's PromQL support.
- Apply metric math to derive new series from existing ones, such as error rate from error count divided by request count.
For AWS-native monitoring, CloudWatch can stay the source of infrastructure and service-level signals. But when teams want longer retention, unified logs, metrics, and traces, broader dashboards, or a simpler OTEL-driven pipeline, routing telemetry through the OpenTelemetry Collector into Parseable lets them keep CloudWatch in the workflow while reducing the burden of managing separate storage, retention, and analysis layers. Many teams eventually want one place to explore metrics, logs, and traces together, and Parseable fits that need.
Point your OTel collector to Parseable, and it will handle everything else.
Core CloudWatch metric concepts you need to understand
| Concept | What it means | Why it matters |
|---|---|---|
| Namespace | Logical container that groups related metrics | Prevents collisions between AWS-vended and custom metrics, and isolates teams |
| Metric name | The variable being measured | Becomes the primary identifier in queries and alarms |
| Dimensions | Key-value pairs that scope a metric | Define cardinality and granularity, directly affect cost |
| Standard vs high-resolution | 1-minute vs 1-second data points | High resolution costs more and is only useful for short-burst workloads |
| Statistics and periods | Sum, average, min, max, p99 over a time window | Determine how raw data is aggregated for queries and alarms |
| Regions and scope | CloudWatch metrics are region-scoped | Multi-region workloads need cross-region dashboards or aggregation |
A namespace is a strong boundary. Two metrics with the same name but different namespaces are completely separate time series. Use that to your advantage to keep team-owned metrics organized.
Statistics deserve extra attention. The same CPUUtilization metric viewed as Average versus Maximum will tell two very different stories. Alarm design depends on choosing the right statistic and period for the signal you care about.
Types of CloudWatch metrics
AWS default metrics
These ship with every AWS service. EC2 publishes CPUUtilization, NetworkIn, NetworkOut, DiskReadOps, and others at 5-minute intervals by default. Lambda publishes Invocations, Errors, Duration, Throttles, and ConcurrentExecutions.
RDS publishes CPUUtilization, DatabaseConnections, FreeStorageSpace, and replication metrics. AWS publishes a full catalog of vended metrics by service, and it is worth scanning before you build anything custom.
Detailed monitoring metrics
Several AWS services offer detailed monitoring as an opt-in upgrade. For EC2, detailed monitoring drops the default 5-minute interval to 1-minute and costs extra per instance. It is worth enabling on production-critical workloads but rarely necessary on every instance in a fleet.
Custom metrics
Custom metrics are published by your code, your agents, or your Collector. Typical examples include queue depth for an internal job processor, checkout funnel conversion rates, internal API SLIs, or feature flag evaluation counts. They are billed per metric per month, so designing them deliberately matters.
Metrics derived from logs
CloudWatch Logs can extract metrics from structured or unstructured log data using metric filters. A filter pattern matches log events and increments a metric counter. This is useful for surfacing application errors that appear in logs but are not emitted as metrics by the code. The Embedded Metric Format takes this further: structured JSON log entries in a specific shape are automatically parsed into metrics with no filter required.
When should you use CloudWatch metrics?
CloudWatch metrics fit best when you need:
- Infrastructure monitoring for EC2, ECS, EKS, RDS, ALB, NAT Gateway, and other AWS resources.
- Autoscaling triggers for EC2 Auto Scaling groups, ECS services, and Application Auto Scaling targets.
- Application health signals like request rates, error rates, and latency percentiles.
- SLO indicators that drive alerting and error budget calculations.
- Billing and cost alerts through the
AWS/Billingnamespace. - Security and anomaly detection for unusual patterns in API call volume, login failures, or network traffic.
- Business KPIs when AWS-native monitoring is sufficient and you do not need separate analytics infrastructure.
CloudWatch is a good default for any AWS-heavy workload. It stops being the right answer when you need long-term metric retention, cross-cloud correlation, or unified analysis of metrics alongside high-volume logs and traces.
Monitor your CloudWatch metrics with ease using Parseable.
Try for freeHow to implement CloudWatch metrics
Step 1. Identify the metrics that matter
Before you publish anything, list the signals you actually need. A useful framework is to group them into four buckets:
- Resource metrics. CPU, memory, disk, network. The basics of infrastructure health.
- Service health metrics. Request rate, error rate, latency. The RED method, or the four golden signals if you also track saturation.
- User-impact metrics. Things your users would notice: checkout success rate, login latency, time to first byte.
- Business metrics. Orders per minute, revenue per region, signup conversion. Often optional in CloudWatch and better suited to a data warehouse, but useful for operational alerting.
Step 2. Decide what is already available by default
Audit the vended metrics for every AWS service you use. Most teams discover that EC2, Lambda, RDS, ALB, and SQS already publish 60 to 80 percent of what they need. Custom metrics should fill the gaps, not duplicate what AWS already provides.
Step 3. Choose your publishing path
Option A. OpenTelemetry-based implementation
AWS recommends OTLP for new implementations because it future-proofs your instrumentation. OpenTelemetry SDKs exist for every major language, the metric model supports histograms and exponential histograms, and the labels are far more expressive than CloudWatch's native dimensions.
A typical setup runs the AWS Distro for OpenTelemetry Collector as a sidecar or daemonset. Applications emit OTLP to the Collector, and the Collector exports to CloudWatch via the awsemf exporter. The same Collector can simultaneously fan out to other backends, which is why this path scales better than PutMetricData.
Option B. PutMetricData implementation
If you do not need histograms, only publish a handful of custom metrics, and want to keep your stack lean, PutMetricData is still reasonable. Design your namespaces upfront. Use Company/Service or Team/Service patterns. Keep dimensions consistent across metrics in the same namespace so dashboards and alarms compose cleanly.
Batch your PutMetricData calls. The API accepts up to 1,000 data points per request and is far cheaper that way than one call per metric.
Connect it to Parseable (recommended)
After choosing your publishing path, the simplest next move is to point your OpenTelemetry Collector at Parseable and stop there. From that point on, Parseable takes over ingestion, retention, dimension handling, dashboards, and alerts for your metrics as part of the platform, so the configuration work that would normally follow collapses into a single integration step.
Parseable is a unified observability backend that ingests metrics, logs, and traces over OpenTelemetry into a single high-cardinality store. It ships with built-in dashboards, alerting, and a query interface, and includes up to 365 days of retention on the Pro plan. Because metrics sit alongside the logs and traces from the same workloads, you can move from a metric spike straight into the related events without switching tools or re-correlating timestamps.
If you are not routing metrics through Parseable, the remaining steps below cover the work you still need to handle yourself inside CloudWatch: dimension design, resolution choices, dashboard layout, and alarm setup.
Step 4. Set dimensions carefully
Dimensions are powerful and dangerous. Each unique combination of dimension values creates a separate metric, and each metric is billed independently. A metric with dimensions Service, Region, and Environment is manageable. The same metric with UserId as a dimension will explode into millions of separate time series and a punishing bill.
Treat dimensions like a small, fixed schema. If you want per-user analysis, that belongs in logs, not metrics.
Step 5. Choose metric resolution and period
Standard resolution (1-minute) is the right default for almost everything. High resolution (1-second) is for genuinely bursty workloads where 1-minute granularity hides incidents. High-resolution metrics cost more and only retain sub-minute granularity for 3 hours, so the use case must justify both.
Match the alarm period to the metric resolution and the signal's natural rhythm. A noisy metric with a 1-minute period and a single-datapoint alarm threshold will page you constantly. The same metric averaged over 5 minutes will catch real problems and ignore noise.
Step 6. Build queries, graphs, and dashboards
Start with one dashboard per service, not one dashboard per metric. Group related signals together so an on-call engineer can see request rate, error rate, latency, and saturation on a single screen.
Use Metrics Insights for ad hoc exploration when you do not know exactly which dimension combination matters. Use PromQL when your metrics come from OpenTelemetry. Use metric math to derive composite signals like error rate without publishing them as separate metrics.
Step 7. Add alarms and anomaly detection
Threshold alarms work well for metrics with stable baselines. Anomaly detection works better for metrics that follow daily or weekly patterns, like request volume. Metrics Insights queries can power fleet-level alarms that alert when any instance in a fleet crosses a threshold, without needing one alarm per instance.
Alarm design matters as much as metric collection. A noisy alarm gets muted. A muted alarm is worse than no alarm.
OpenTelemetry vs PutMetricData for CloudWatch metrics
| Aspect | OpenTelemetry (OTLP) | CloudWatch API (PutMetricData) |
|---|---|---|
| Best for | New implementations, multi-backend pipelines, modern metric types | Small custom metric needs, AWS-only stacks, simple scripts |
| Labels / dimensions | Rich, arbitrary labels supported | Limited to 30 dimensions per metric |
| Metric types | Counter, gauge, histogram, exponential histogram, summary | Statistic sets only |
| Granularity | Configurable, supports high resolution | Standard or high resolution |
| Query language | PromQL, Metrics Insights | Metrics Insights, CloudWatch console |
| Alarms | Full CloudWatch alarm support | Full CloudWatch alarm support |
| Instrumentation style | Vendor-neutral SDKs | AWS SDK only |
If you are starting fresh and expect to scale beyond a single backend, OpenTelemetry is the right answer. If you have a small, stable set of custom metrics and no plans to expand, PutMetricData is fine.
Collect, store, monitor and analyze your CloudWatch metrics in one platform.
Try for freeHow to query CloudWatch metrics effectively
Use the CloudWatch console for quick inspection
The console is the fastest way to plot a single metric, compare a few resources, or sanity-check that data is flowing. It is not a real analysis tool.
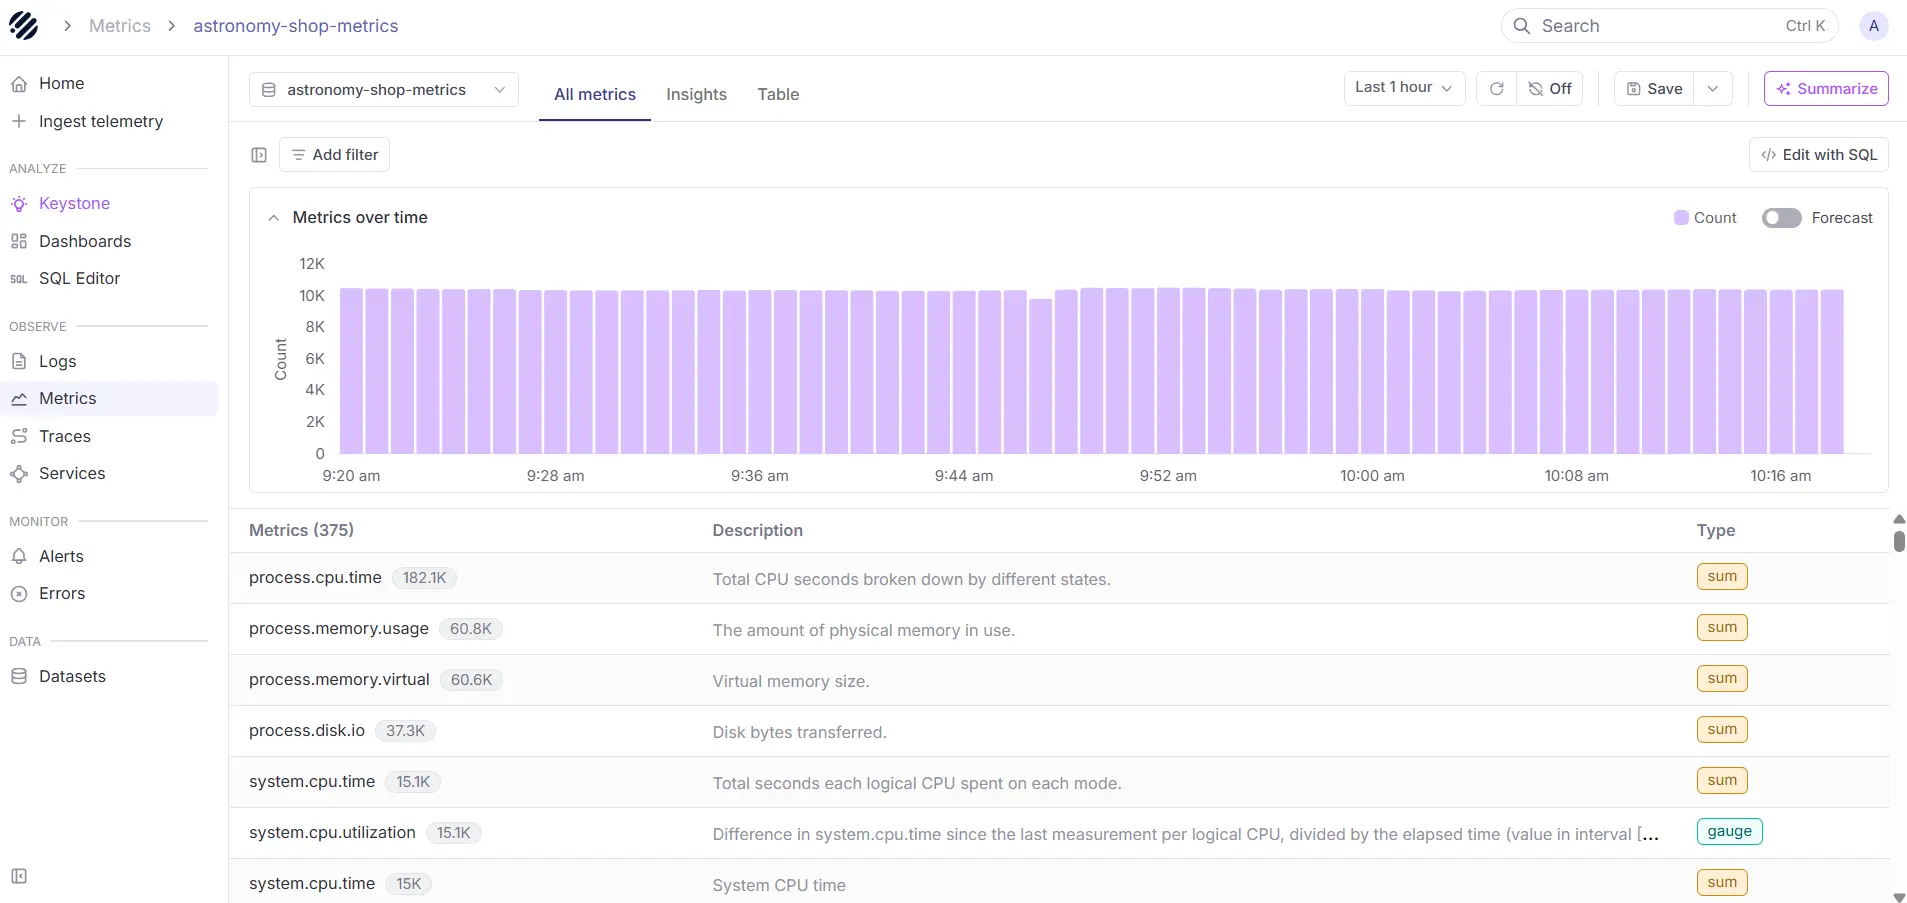
Use Parseable for unified visibility
The CloudWatch console is effective for quick checks, but Parseable gives teams a more complete place to work with telemetry in context. By bringing metrics, logs, and traces into one platform, Parseable enables SQL-based querying, dashboards, alerts, and anomaly detection from a single interface, which makes it better suited for unified visibility and ongoing operational analysis.
See Parseable in action with your own CloudWatch metrics.
Sign up for freeUse Metrics Insights for SQL-style analysis
Metrics Insights is a SQL-like language for querying CloudWatch metrics across many dimensions at once. It is the right tool when you need to answer questions like "top 10 Lambda functions by error rate in the last hour" without manually picking each function. Use it for fleet-wide investigations and for building dashboards that scale as resources come and go.
Use PromQL for OTLP and OpenTelemetry metrics
If you publish metrics through OpenTelemetry, PromQL is often more natural than Metrics Insights because the metric model maps directly. CloudWatch supports PromQL queries against OTLP-ingested metrics, which makes migration from Prometheus-based stacks far less painful.
Use metric math for derived signals
Metric math lets you compute new series from existing ones inside a single graph or alarm. The classic example is error rate: (errors / requests) * 100. Other common uses include moving averages, percent change over time, and combining metrics across resources. Metric math runs at query time, so you do not pay to store the derived series.
The decision between these query paths is not which is best in isolation. It is which fits the question you are trying to answer. Console for quick checks, Metrics Insights for fleet-level questions, PromQL for OTLP pipelines, metric math for composite signals.
Common CloudWatch metric implementation mistakes
Publishing too many custom metrics too early
The most common mistake is treating custom metrics as cheap and infinite. They are not. Every unique metric-dimension combination is a separate billed series. Teams routinely discover they are paying for thousands of metrics nobody queries.
Poor namespace and dimension design
Inconsistent namespaces and ad hoc dimensions make dashboards harder to build and queries harder to write. Pick a namespace convention early and document it. Treat dimensions as a schema, not a free-form tag bag.
Choosing the wrong resolution
High-resolution metrics cost more and retain detail for only 3 hours. Most workloads do not need them. Default to standard resolution and upgrade only specific metrics where 1-second visibility is justified.
Treating dashboards as the implementation goal
A dashboard is not a monitoring strategy. It is a viewing surface. The real work is in choosing the right metrics, alarms, and SLOs. A dashboard with 40 graphs that nobody acts on is worse than 5 graphs tied to clear alerts.
Skipping alarm design
Teams often collect metrics and forget alarms entirely, or set them up with default thresholds that page nobody. Every important metric should have a defined response: alert, ticket, or accepted-as-informational.
Ignoring pricing and retention implications
CloudWatch costs scale with custom metric volume, API call volume, and dashboard complexity. Retention is fixed at 15 months with rollups. Teams that need longer history or cheaper storage end up needing a second tool anyway. Planning for that from the start is much easier than retrofitting later. Our comparison guide on log aggregation tools cover the broader landscape if you are weighing options.
CloudWatch metrics pricing and retention considerations
What is free by default
AWS-vended metrics from most services are free. The CloudWatch agent metrics are free to collect (you pay for custom metrics they publish, not the agent itself). Up to 10 dashboards with up to 50 metrics each are included in the free tier, and 10 alarms are included.
What increases cost
- Custom metrics. Billed per metric per month. Multiplied by every unique dimension combination.
- Detailed monitoring. Per-instance charge to upgrade from 5-minute to 1-minute resolution on services that support it.
- API calls.
GetMetricData,GetMetricStatistics, andListMetricsare all billed per request. Heavy dashboard refreshes can add up. - High-resolution metrics. Same per-metric cost structure but with finer granularity, and the storage tier shifts.
- Dashboards beyond the free tier. Each additional dashboard incurs a monthly charge.
How retention changes what you can analyze
The 15-month rollup ceiling is the biggest functional limit. After 63 days, you only have 5-minute resolution. After 15 days, 1-minute resolution is gone. This is fine for most operational monitoring, but it breaks down for capacity planning, year-over-year comparisons, audit, and long-running incident retrospectives. Plan for those use cases by either exporting metrics to a longer-term store or by sending the same telemetry through OpenTelemetry to a backend that retains it longer.
CloudWatch metrics implementation examples
Example 1: EC2 CPU and memory monitoring
EC2 publishes CPUUtilization by default but does not publish memory metrics, because memory is a guest-OS concern. Install the CloudWatch agent and configure it to publish mem_used_percent and disk_used_percent from the host. Build a dashboard with CPU, memory, and disk as three stacked graphs per instance group. Set anomaly-detection alarms on CPU and threshold alarms at 85 percent on memory and disk.
Example 2: Lambda error-rate dashboard with metric math
Lambda publishes Invocations and Errors separately. Use metric math to derive error rate: (m1 / m2) * 100 where m1 is Errors and m2 is Invocations. Plot the derived series on a dashboard and alarm on it crossing 1 percent for 5 consecutive minutes. This is more useful than alarming on raw Errors because traffic spikes do not trigger false positives.
Example 3: Custom application latency metric
Instrument your service with the OpenTelemetry SDK. Publish a histogram metric called http_request_duration_seconds with dimensions service, route, and status_class. Export through the OTel Collector to CloudWatch via the awsemf exporter. Query p50, p95, and p99 from the histogram using Metrics Insights or PromQL. Alarm on p99 breaching your SLO.
Example 4: Billing alert with CloudWatch
The AWS/Billing namespace publishes EstimatedCharges in the us-east-1 region for every linked account. Create an alarm on EstimatedCharges with a threshold that matches your monthly budget. Use anomaly detection to catch unexpected spikes earlier than a fixed threshold would.
What to look for beyond CloudWatch metrics
Metrics are necessary but not sufficient. As systems grow, a few patterns emerge that pure-metric workflows do not handle well.
Single-metric alarms catch known failure modes but miss novel ones. When a metric is fine and users are still complaining, you need logs and traces to understand why. Distributed systems generate enough cardinality that pre-aggregated metrics start losing signal, and you need ad hoc query power over high-cardinality data.
Mature observability eventually means correlating metrics, logs, and traces in one place, with retention that matches your operational and compliance needs. CloudWatch covers the metric side well.
For the broader picture, many teams pair CloudWatch with a unified observability platform like Parseable that ingests OpenTelemetry data, retains it longer, and lets engineers query across all three signal types from one interface. Pricing and retention details are covered on the Parseable pricing page.
Conclusion
CloudWatch metrics are the core AWS-native way to monitor infrastructure, services, and applications running on AWS. They are well-integrated, broadly supported, and good enough as a default for any AWS-heavy workload.
Real implementation success depends less on collecting metrics and more on how they are named, published, queried, alarmed on, and retained. Start with AWS-vended metrics, add custom metrics only where they add real operational value, design dimensions carefully, and pick OpenTelemetry as the publishing path if you expect to grow into multi-backend or unified observability over time.
If you reach the point where CloudWatch retention or single-signal analysis becomes a limit, route your OpenTelemetry pipeline into a broader observability layer. Sign up for Parseable to see how that pattern works in practice.

