

A CloudWatch to Parseable migration usually starts the same way: a team adopts CloudWatch because it is already built into AWS, then gradually discovers that CloudWatch is quite complex, rigid and offers minimum customizations. CloudWatch cost is also a major factor for teams to migrate.
CloudWatch gives teams real-time monitoring for AWS resources and applications, along with metrics, alarms, dashboards, and log collection. That makes it a strong starting point. But as telemetry volume grows, workflows spread across multiple CloudWatch surfaces, and engineers need deeper correlation across signals, the operational overhead becomes harder to ignore.
That is where Parseable enters the conversation. Parseable is a unified observability platform for logs, metrics, and traces, with SQL-based analysis, plain-English querying, built-in dashboards, and real-time alerting with anomaly detection.
Instead of treating observability as a set of disconnected tools, it brings telemetry into a single system built on open standards such as OpenTelemetry, Parquet, and object storage. For engineering teams, the appeal is practical: fewer handoffs between tools, faster investigation workflows, and a platform that is easier to reason about as usage grows.
This guide explains how to migrate from AWS CloudWatch to Parseable in a way that is safe, staged, and realistic for production teams. It covers what needs to move, how to assess the current CloudWatch setup, which migration approach to choose, how to handle live and historical data, and what to validate before cutover.
Why teams migrate from CloudWatch to Parseable
CloudWatch is a strong starting point for AWS teams. It gives them built-in metrics, logs, dashboards, alarms, and application monitoring inside the AWS ecosystem. The migration conversation usually starts later, when telemetry volume grows, workflows become harder to manage, and the team wants more control over how data is stored, queried, and priced.
Parseable fits that next stage well. It is built around SQL/PromQL querying, Apache Parquet, and S3-compatible object storage. That makes it appealing for teams that want a simpler investigation workflow and a pricing model that is easier to reason about as usage scales.
- More predictable costs: CloudWatch pricing is split across logs, metrics, alarms, dashboards, and other observability features. Parseable Pro is priced at $0.39/GB ingested and includes 365 days of retention, dashboards, alerts, anomaly detection, and API access.
- Better query flexibility: CloudWatch supports Logs Insights, PromQL, and Metrics Insights depending on the data type. Parseable takes a SQL-first approach across logs, metrics, and traces, which is often easier for engineering teams that want one query model.
- Open storage model: Parseable stores telemetry in Apache Parquet on S3-compatible object storage, which gives teams a more open and portable data layer than a fully managed native service workflow. See how this compares in our guide to log aggregation tools.
- Cleaner multi-signal workflows: CloudWatch covers multiple signals, but Parseable is designed to keep logs, metrics, and traces in one query and dashboard layer, which can reduce context switching during investigations.
If CloudWatch is already creating cost or workflow friction, start with Parseable and validate the move with one or two high-value log groups first.
What exactly needs to migrate from CloudWatch
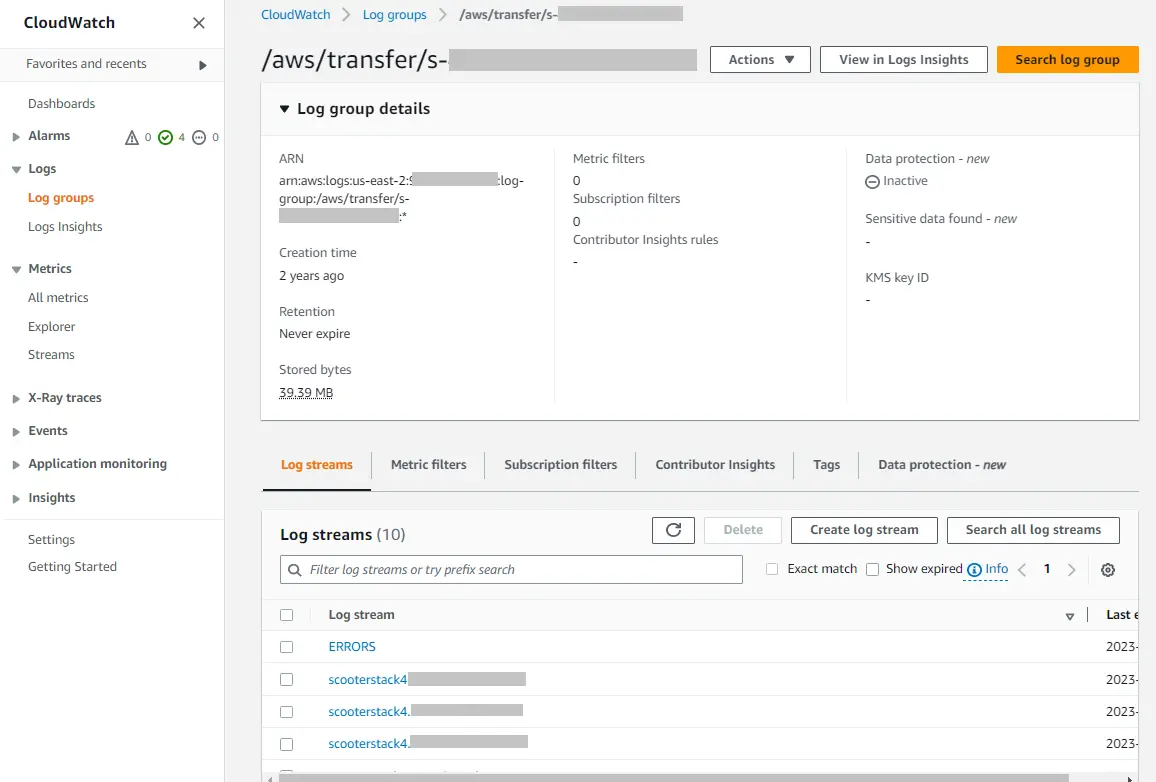
CloudWatch spreads observability across log groups and streams, metrics, alarms, dashboards, and real-time routing rules like subscription filters. That means the migration plan should focus on both data and workflow parity, not just where raw events are stored. CloudWatch itself organizes logs into log groups and streams, supports dashboards, metrics, alarms, and subscription filters, and allows historical log export through CreateExportTask.
Here is what teams usually need to inventory before moving anything:
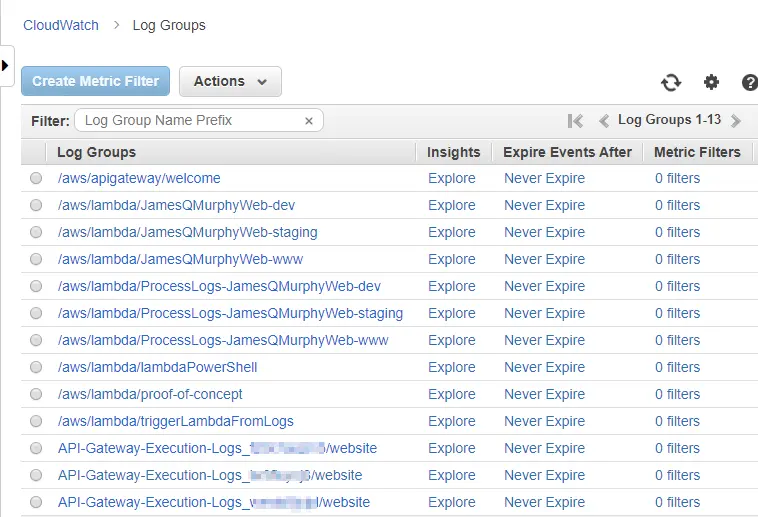
1. Log groups and streams
Identify which applications, Lambdas, clusters, and AWS services are writing into CloudWatch Logs today. CloudWatch stores logs in log groups and streams, so this becomes the basic migration unit.
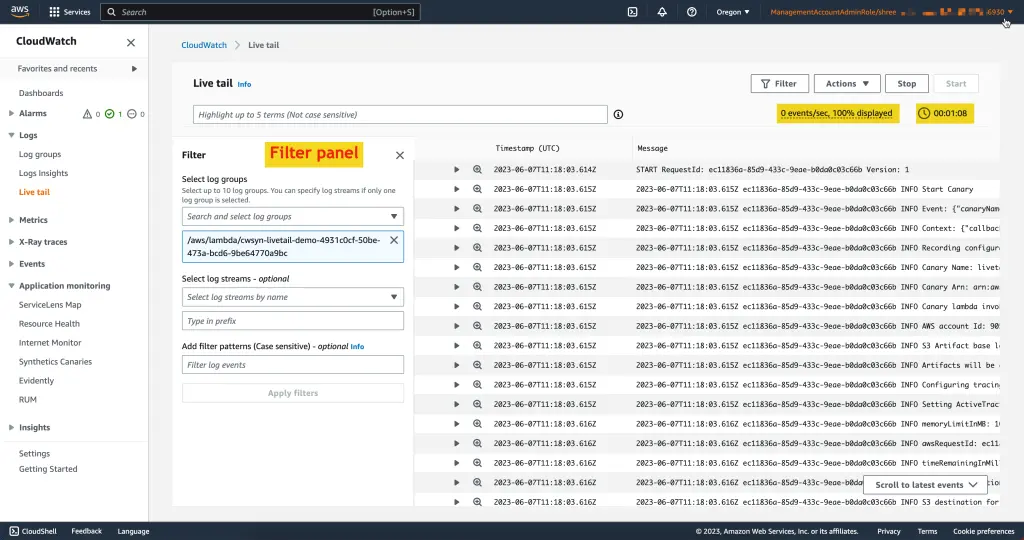
2. Live log forwarding paths
Check whether any log groups already use subscription filters to send data to Lambda, Firehose, or other downstream systems. Those routes need to be recreated or redirected during migration.
3. Historical log data
If old logs still matter for investigations, audits, or retention requirements, plan a backfill. CloudWatch supports exporting log data with CreateExportTask, so historical migration should be treated separately from live forwarding.
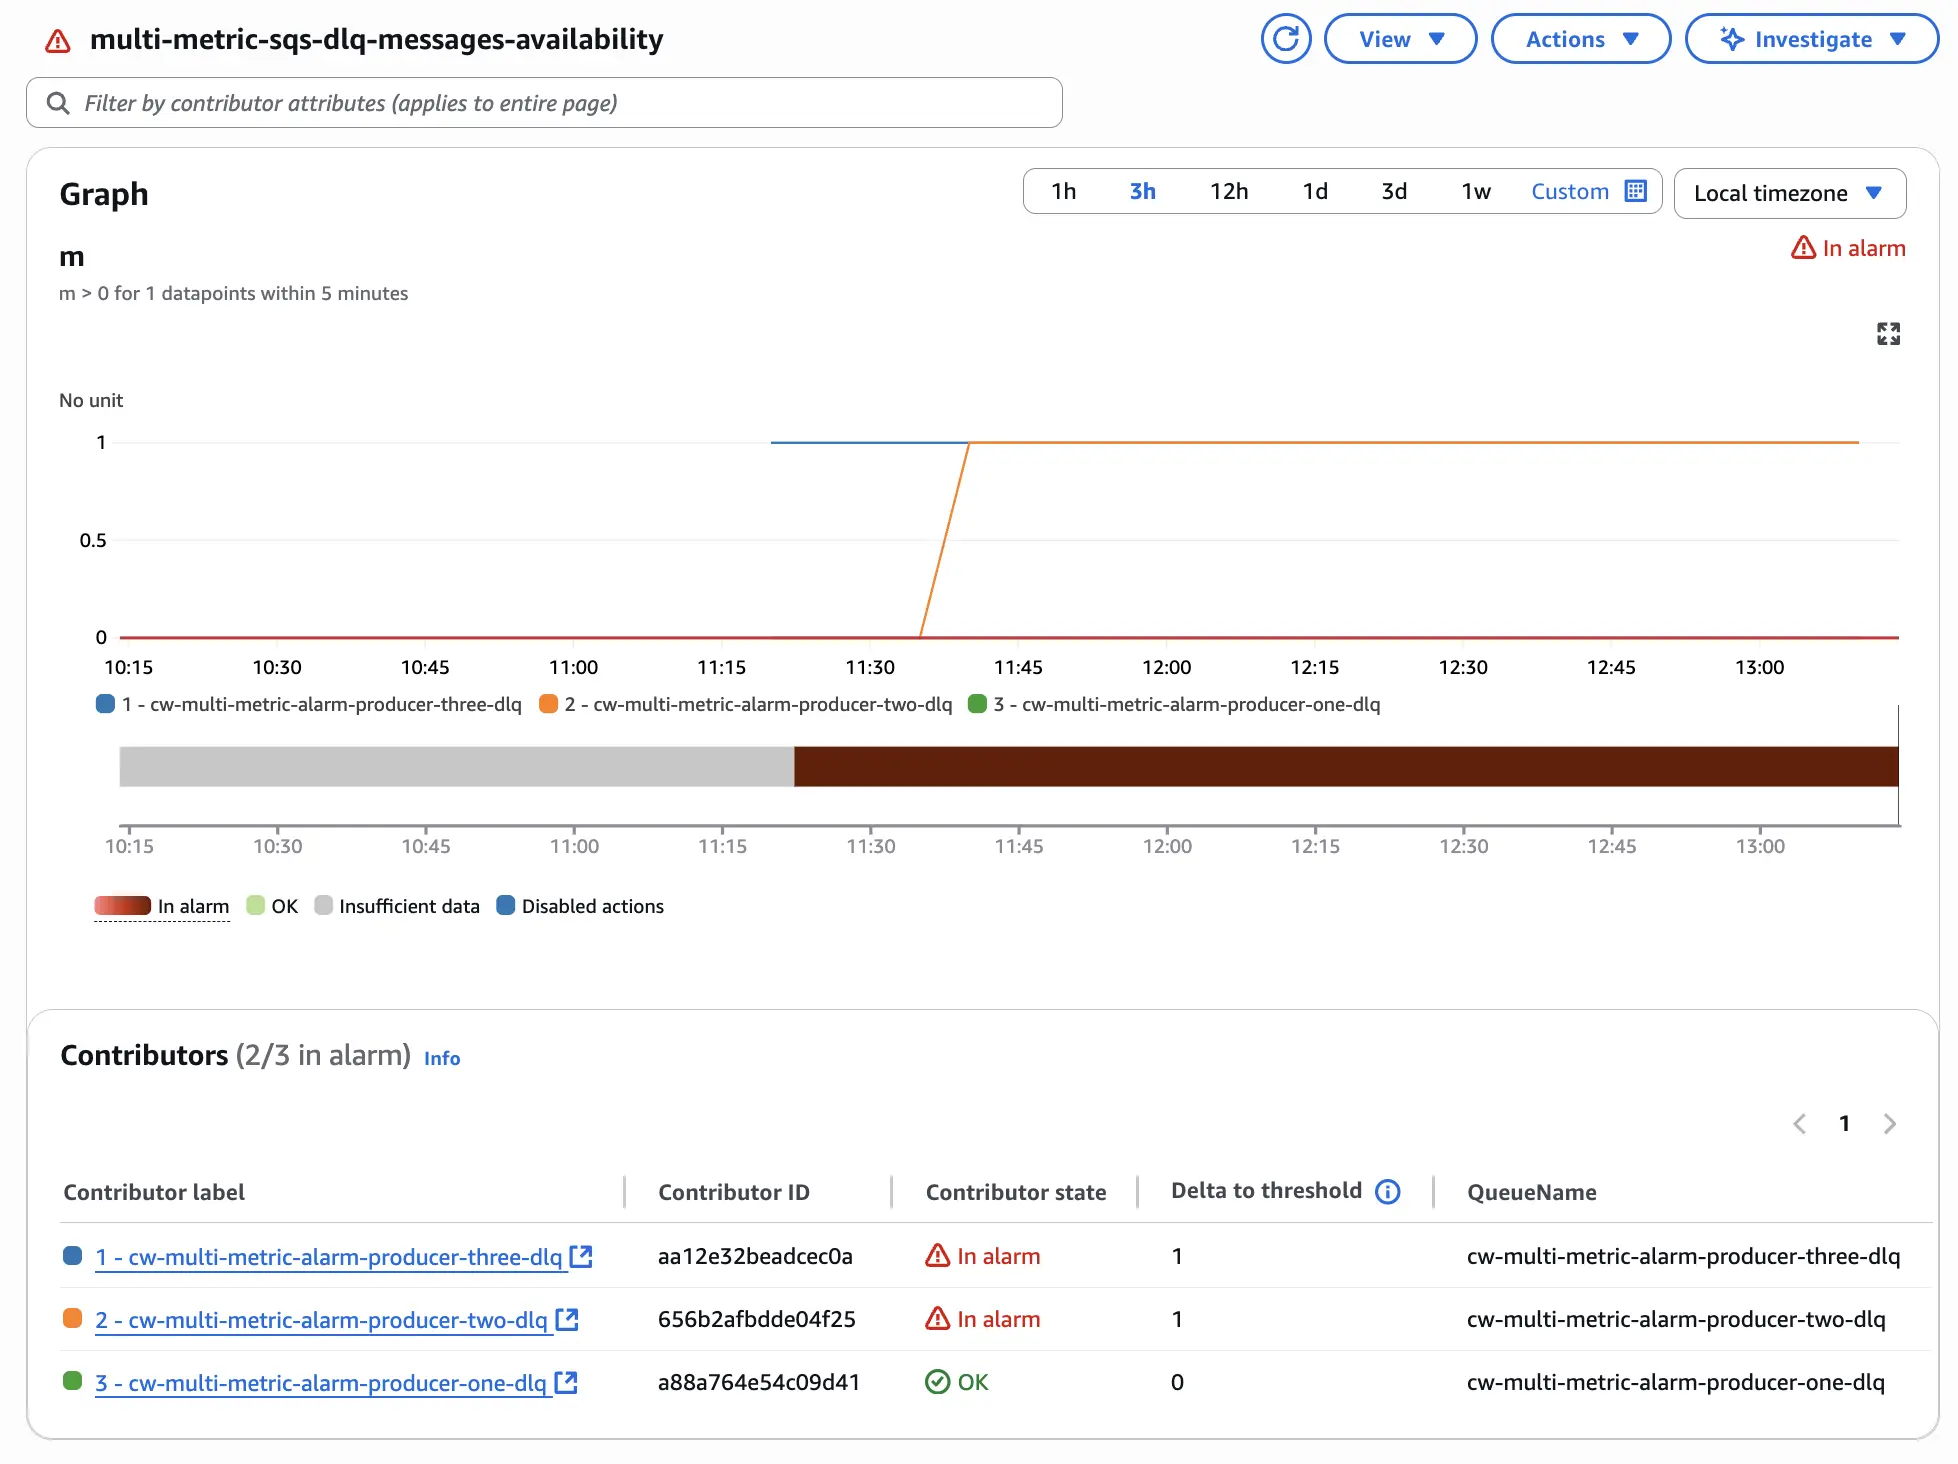
4. Metrics and alarms
Many AWS services send metrics to CloudWatch automatically, and teams often build alarms on top of those metrics. Even if logs are the main migration target, you still need to document which metrics and alarms engineers actually rely on day to day. CloudWatch explicitly positions metrics, alarms, and dashboards as core parts of its monitoring workflow.
5. Dashboards and saved queries
Dashboards do not migrate by themselves. The same is true for Logs Insights workflows. Teams should list the dashboards, queries, and alert views they actually use so they can recreate the high-value ones first in Parseable. CloudWatch’s documentation notes that dashboards provide a unified view of metrics and logs, and Logs Insights is used for interactive log analysis.
6. Target ingestion path into Parseable
On the Parseable side, the main question is how the data will land. Parseable supports JSON over HTTP and OTLP-native ingestion, so teams can choose a simple transformed log path for CloudWatch exports and subscriptions, or route logs, metrics, and traces through an OpenTelemetry Collector where that already exists.
Pre‑migration assessment
Migration success depends on good planning. Perform the following checks before you start moving data:
- Audit log group usage: Identify high‑volume log groups and the AWS services or applications that write to them. Look at ingestion rates and retention periods to estimate storage and network costs.
- Review metrics and alarms: Export a list of custom and default metrics, along with their namespaces, dimensions and alarm thresholds. This helps you know which metrics to instrument in Parseable or via OpenTelemetry.
- Assess dashboards and saved queries: Document which CloudWatch dashboards your teams use regularly, and collect Insights queries that need to be reimplemented.
- Understand dependencies: Some downstream systems might consume CloudWatch metrics or logs (e.g., AWS Auto Scaling, EventBridge or third‑party integrations). Ensure they will continue to work during and after migration.
- Define success criteria: Decide what “done” means for your migration. This could include: parity in alert coverage, equivalent dashboards, data retention goals and cost reduction targets.
Choose a migration approach
You can migrate to Parseable using three common strategies. The right choice depends on your risk tolerance, existing pipeline complexity and the amount of data to backfill.
Parallel migration
In a parallel migration, you continue sending logs and metrics to CloudWatch while duplicating them to Parseable. Once Parseable has all necessary data and dashboards, you gradually cut over alerting and search to Parseable. This approach minimises risk because you can switch back to CloudWatch if something goes wrong. However, it doubles ingestion costs during the migration period.
Phased migration
Under a phased migration, you move one workload at a time to Parseable. For example, start with development environments or less critical services, then migrate production once you’re comfortable. This approach reduces immediate cost duplication but takes longer and may create a split‑brain state where logs and metrics are in different systems for some services.
Cutover migration
With a cutover migration, you plan a maintenance window during which you halt ingestion to CloudWatch and switch everything to Parseable at once. This minimises duplicate cost but requires careful planning to avoid data loss or downtime. Use this only if you have a small CloudWatch footprint or if you can tolerate a brief monitoring gap.
Teams that want the fastest path to validation should use a phased rollout, then move to a broader cutover only after Parseable dashboards, alerts, and log coverage are in place. Start free.
How does CloudWatch to Parseable migration work
We recommend using the OpenTelemetry Collector to send log data from CloudWatch to Parseable. The OpenTelemetry awscloudwatch receiver, can read logs from CloudWatch Log Groups and forward them to Parseable through the otlphttp exporter. In practice, that means the migration flow is:
CloudWatch Log Groups → OpenTelemetry Collector → Parseable.
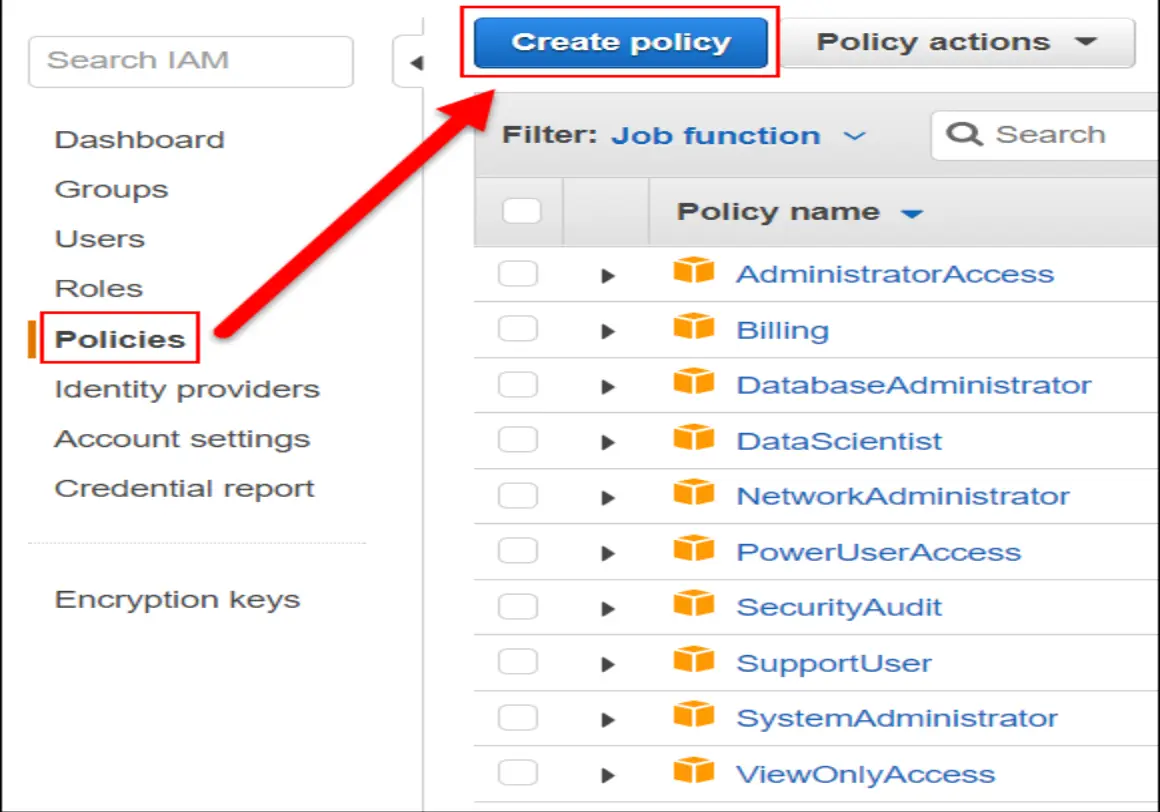
1. Grant the collector permission to read CloudWatch Logs
Start by giving the collector read access to CloudWatch Logs. The IAM policy needs permission to discover log groups, discover streams, read log events, and filter log events. To access IAM policy, open the AWS Console, search for IAM, create a new policy, and use the policy below:
{
  "Version": "2012-10-17",
  "Statement": [
    {
      "Effect": "Allow",
      "Action": [
        "logs:DescribeLogGroups",
        "logs:DescribeLogStreams",
        "logs:GetLogEvents",
        "logs:FilterLogEvents"
      ],
      "Resource": "*"
    }
  ]
}
Without these permissions, the collector will not be able to enumerate log groups or pull events. If the collector runs in Kubernetes on EKS, attach these permissions through IAM Roles for Service Accounts (IRSA). If it runs in Docker or on a VM, use an IAM user, role, or mounted AWS credentials.
2. Configure OTel Collector CloudWatch receiver
Next, create the collector configuration. The OTel Collector documentation has detailed information on how to configure the receiver. Refer to the examples here.
At a minimum, the config needs:
- the AWS region
- a poll interval
- the CloudWatch log group selection method
- the Parseable endpoint
- Parseable request headers for authentication and stream routing
It is important to choose the right log group selection method based on your goals.
-
Autodiscover log groups: use autodiscovery when the goal is fast coverage. In this mode, the collector automatically finds log groups and starts reading from them. Parseable’s example also supports a discovery limit so the collector does not try to pull everything at once. This is a good choice for pilot environments or small AWS estates.
-
Select named log groups: use named groups when the migration is phased. This is usually the better production approach because it lets you start with a few critical sources, such as:
/aws/lambda/my-function
/aws/ecs/my-cluster
/aws/apigateway/my-api
- Filter by prefix or stream: if log group names follow a predictable convention, use a prefix filter. Parseable’s example shows a prefix like
/aws/lambda/, which is useful when you want to bring over only Lambda logs first. The integration also supports stream-level filtering inside a named group through explicit stream names or prefixes, which is useful when you need to narrow the migration to a specific workload or time pattern.
3. Configure the OTel Collector Parseable
We recommend using the official http exporter for Parseable.
The important part here is to decide which Parseable dataset will receive the logs. Based on the name you decide, ensure to update the field X-P-Stream accordingly.
4. Run the collector
Once the configuration is ready, run the collector in the environment you already use. For most teams, the simplest path is to test the pipeline first with Docker, confirm that logs are reaching Parseable, and then move the collector into Kubernetes or another production environment. If you already run collectors for OpenTelemetry, it is usually better to extend that deployment rather than introduce a completely separate agent stack.
Validation checklist before cutover
Before switching off CloudWatch ingestion, validate that Parseable is fully serving your observability needs:
- Event volume comparison. Confirm that the number of log events ingested in Parseable matches what was received in CloudWatch for the same time frame.
- Schema and field mapping. Verify that key fields (timestamp, message, level, service, request IDs) are parsed correctly and searchable via SQL or filters.
- Timestamp accuracy. Check that timestamps are preserved to the correct timezone and precision.
- Query and dashboard parity. Recreate critical dashboards from CloudWatch in Parseable and ensure they display the same information.
- Alert coverage. Configure equivalent alerts in Parseable and verify they trigger correctly.
- Access control and team workflows. Ensure roles and permissions are configured in Parseable to mirror CloudWatch IAM policies and that on‑call rotation tools integrate smoothly.
Once validation is complete, move the first production workflow to Parseable and let engineers use the new path during normal troubleshooting before shutting anything off in CloudWatch. Start with Parseable.
Common migration mistakes to avoid
A CloudWatch to Parseable migration usually fails for operational reasons, not because the ingestion path is impossible.
The most common problems are over-scoping the first rollout, missing AWS permissions, using the wrong collection pattern for the job, and skipping validation after the collector starts.
Here are some common migrations mistakes that usually team face along with ways to avoid it:
Migrating everything at once
Do not start by pulling every log group in the account. Parseable’s awscloudwatch integration supports named log groups, prefix-based autodiscovery, and autodiscovery limits, which is a strong sign that the safer pattern is to begin with a narrow scope and expand only after validation.
Starting with a handful of critical groups usually makes it much easier to catch field-mapping, region, and throughput issues before they affect the full estate.
Skipping IAM and credential checks
The collector cannot discover groups or read events unless AWS credentials are valid and the IAM policy includes logs:DescribeLogGroups, logs:DescribeLogStreams, logs:GetLogEvents, and logs:FilterLogEvents.
Authentication issues as the first thing to check when logs do not arrive, including expired temporary credentials and region mismatch. In practice, this is one of the fastest ways to lose time during migration because the pipeline may look healthy while returning no useful data.
Wrong migration path for live data versus historical data
Live CloudWatch logs and historical CloudWatch logs should not be handled the same way. AWS documents subscription filters as the real-time delivery path for CloudWatch Logs, while export to S3 is the path for stored historical data.
AWS also notes that export tasks are not intended for continuous archival, exported log data can take time to become available, and export tasks can time out on large ranges. That means teams should avoid treating S3 export as the live migration path or expecting the collector-based live path to solve historical backfill automatically.
Conclusion
A CloudWatch to Parseable migration is worth doing when the problem is no longer data collection, but what happens after it lands. CloudWatch is fine as an AWS-native starting point. It becomes less effective when teams need longer retention, better query flexibility, and one place to work across logs, metrics, and traces. Parseable gives teams that landing zone without forcing a complicated re-architecture of the ingestion path.
Parseable offers unified visibility by combining logs, metrics, and traces in one platform. With a flat ingestion-based model of $0.39/GB on Pro, 365-day retention, and core capabilities like dashboards, alerts, API access, and anomaly detection already included, Parseable gives engineering teams a much stronger platform for storing, querying, and operationalizing telemetry than CloudWatch does once scale becomes a real concern.

