

Databases do not fail loudly. They degrade. Queries that took 50ms last week start taking 800ms. Connection pools silently exhaust under load. Background jobs accumulate lock contention that nobody notices until a checkout flow starts timing out on a Friday evening.
The best database monitoring tools give teams the visibility to catch these problems before users do, and the investigative depth to resolve them fast. But uptime checks and basic threshold alerts are no longer enough. Engineering teams today need query-level visibility, anomaly detection, and the ability to connect database behavior to the rest of their stack.
This guide covers 10 tools worth evaluating in 2026, including purpose-built database monitors, full-stack observability platforms, and open-source options. Use the comparison table below to shortlist, then dig into the detailed breakdowns.
Database monitoring tools at a glance
| Tool | Best for | Deployment | Supported databases | Query monitoring | Alerts | Broader observability | Entry pricing | G2 rating |
|---|---|---|---|---|---|---|---|---|
| Parseable | Cost-efficient unified observability | Cloud, self-hosted, BYOC | PostgreSQL, MySQL + others via OTel | Yes | Yes | Yes | $0.39/GB ingested | Not yet rated |
| Datadog | Enterprise multi-database monitoring | SaaS | MySQL, PostgreSQL, SQL Server, MongoDB, Redis | Yes | Yes | Yes | Custom | 4.4/5 |
| SolarWinds Database Observability | Cloud-native database monitoring | SaaS | MySQL, PostgreSQL, MongoDB, SQL Server | Yes | Yes | Limited | ~$117/DB/month | 4.5/5 |
| Redgate Monitor | SQL Server and PostgreSQL DBA depth | Self-hosted, SaaS | SQL Server, PostgreSQL | Yes | Yes | Limited | Custom | 4.6/5 |
| Dynatrace | AI-driven full-stack observability | SaaS, self-managed | MySQL, PostgreSQL, Oracle, SQL Server, MongoDB | Yes | Yes | Yes | From $7/host/month | 4.5/5 |
| IBM Instana | Automated APM with database coverage | SaaS, on-prem | MySQL, PostgreSQL, MongoDB, Redis, Cassandra | Yes | Yes | Yes | From $18/host/month | Not yet rated |
| Site24x7 | SMB multi-database monitoring | SaaS | MySQL, PostgreSQL, SQL Server, Oracle, MongoDB | Yes | Yes | Yes | From $9/month | 4.6/5 |
| ManageEngine Applications Manager | On-prem enterprise monitoring | On-prem, SaaS | MySQL, PostgreSQL, SQL Server, Oracle, MongoDB | Yes | Yes | Yes | From $395/year | 4.5/5 |
| pganalyze | Deep PostgreSQL query analysis | SaaS, self-hosted | PostgreSQL only | Yes | Yes | Limited | $149/month | 4.4/5 |
| Percona PMM | Open-source MySQL/PostgreSQL monitoring | Self-hosted | MySQL, PostgreSQL, MongoDB | Yes | Yes | Limited | Free (open-source) | 4.5/5 |
What are database monitoring tools?
Database monitoring tools track the performance, health, and behavior of database systems in real time. They collect and surface metrics like query execution time, slow query logs, connection counts, cache hit ratios, replication lag, disk I/O, and resource utilization across your database fleet.
At their core, they help teams answer three questions: Is my database healthy right now? What queries or operations are causing problems? How has performance changed over time?
The distinction between basic monitoring and deeper observability matters here. Basic monitoring checks whether a database is up and fires alerts on threshold breaches. Deeper observability includes query fingerprinting, execution plan analysis, correlation between database events and application behavior, and enough retention to investigate incidents that happened days or weeks ago. Most teams start with basic monitoring and eventually hit its limits in production.
What to look for in the best database monitoring tools
Choosing between tools is not just about feature checklists. The right fit depends on your databases, your team's workflow, and the kinds of problems you actually need to solve. That said, these capabilities consistently separate strong tools from weak ones.
-
Query-level visibility: Aggregate metrics hide problems. You need per-query latency, execution counts, plan changes, and slow query identification at the statement level, not just average response times across all queries.
-
Alerts and anomaly detection: Static thresholds work until your workload pattern changes. Look for tools that support dynamic baselines and intelligent anomaly detection, not just "alert if CPU exceeds 80%."
-
Multi-database support: Most production environments run more than one database engine. A tool that covers MySQL and PostgreSQL but not Redis or MongoDB forces you to maintain separate monitoring stacks.
-
Cloud and on-prem coverage: If your databases span AWS RDS, GCP Cloud SQL, and a self-hosted PostgreSQL instance, your monitoring tool needs to cover all three without requiring a separate agent or integration for each.
-
Logs, metrics, and traces context: Database performance issues rarely exist in isolation. Correlating a slow query with a recent deployment event, a spike in application logs, or a change in upstream traffic patterns makes root cause analysis dramatically faster.
-
Retention and historical analysis: You cannot investigate an incident that happened three weeks ago if your tool only retains 15 days of data. Understand retention limits and the cost of extending them before you commit.
-
Pricing model at scale: Per-database-instance pricing can escalate surprisingly fast. Make sure you understand the cost at your actual database count and query volume, not just the starting price.
-
Deployment flexibility: Some teams need SaaS. Others have compliance requirements that mandate on-prem or bring-your-own-cloud deployments. This often narrows the shortlist faster than features do.
-
Open standards and low lock-in: Tools built on OpenTelemetry, PromQL, or SQL-based query interfaces give you more flexibility over time. Proprietary agent-based tools that make data extraction difficult carry long-term switching costs.
The 10 best database monitoring tools in 2026
1. Parseable: Best database monitoring tool for cost-efficient unified observability
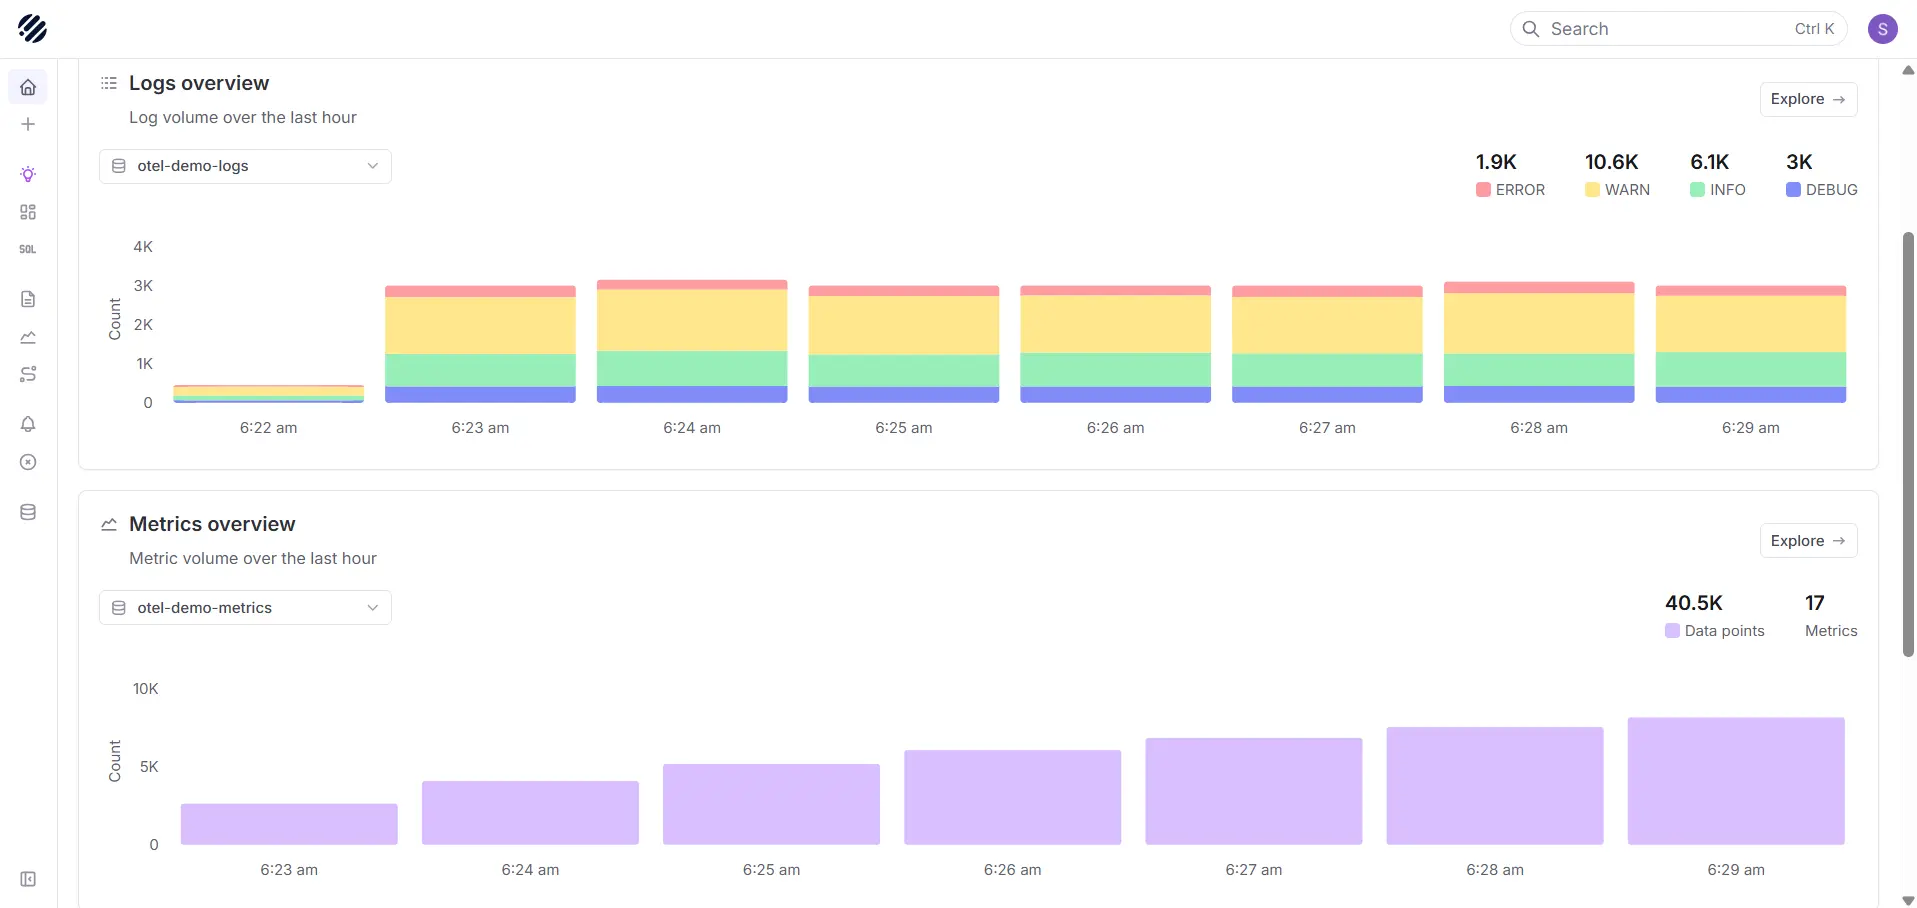
Parseable is a modern observability platform built around an object-storage-first architecture. Unlike tools that treat database monitoring as a separate product, Parseable brings database logs, query events, and performance metrics into the same pipeline as the rest of your infrastructure telemetry. When a slow query surfaces, engineers can immediately correlate it against application logs, deployment events, and system metrics without switching tools or waiting on a support ticket to someone else's dashboard.
What differentiates Parseable among database monitoring tools is its economics. Because it stores data directly in S3-compatible object storage, teams can retain months or years of telemetry at a fraction of what traditional observability platforms charge. For teams dealing with high-cardinality database telemetry at scale, that retention advantage changes what kinds of investigations become practical. Long-running query regressions, gradual connection pool degradation, and slow schema migration effects are all easier to diagnose when historical data is accessible and affordable.
Key features
- Unified ingestion of database logs, query events, and metrics through OpenTelemetry-compatible pipelines
- SQL-based querying for investigation workflows: query your telemetry data using the same interface your team uses for database work
- Proactive monitoring with configurable dashboards and alert rules built for database and infrastructure telemetry
- Object-storage-first architecture (S3-compatible) delivers long retention at low cost
- Self-hosted, bring-your-own-cloud (BYOC), and managed cloud deployment options accommodate compliance and operational requirements
- Lightweight, resource-efficient design suited for high-volume telemetry environments
- Works with PostgreSQL, MySQL, and other databases that emit OpenTelemetry-compatible telemetry
Pricing
- Parseable's Pro tier is priced at $0.39 per GB ingested, with 365 days of retention included and no per-host or per-database seat fee. That makes cost predictable as your database fleet grows.
- An Enterprise plan is available from $15,000/year, adding 24/7 support, BYOC deployment, and flexible retention options.
- Parseable is also open-source and can be self-hosted at no licensing cost.
Pros
- Consumption-based pricing with no per-database seat fees scales more predictably than most commercial alternatives
- Unified logs, metrics, and query events in a single platform reduces the need for multiple monitoring tools
- SQL-based investigation interface lowers the learning curve for teams already comfortable querying databases
- Deployment flexibility (SaaS, self-hosted, BYOC) accommodates strict compliance requirements
- Long retention by default enables historical analysis without hitting additional cost tiers
Cons
- Teams looking for deep, out-of-the-box PostgreSQL execution plan analysis may need to combine Parseable with a specialist tool initially
- Community and third-party integration ecosystem is still growing compared to more mature platforms
Try Parseable for database monitoring for free. Get Started
2. Datadog
Datadog is one of the most widely deployed observability platforms in enterprise engineering. Its Database Monitoring product covers query-level visibility, execution plan capture, and database health metrics across MySQL, PostgreSQL, SQL Server, MongoDB, Redis, and more, all within the same platform used to monitor applications, infrastructure, and logs.
As a database monitoring tool, Datadog's main strength is breadth. Teams that already use Datadog for APM or infrastructure monitoring can extend coverage to their databases without adding another vendor. The tradeoff is cost: Datadog's pricing scales with host count and data volume, and bills can grow significantly for larger fleets.
Key features
- Query-level metrics: latency, call counts, and execution plans per normalized query statement
- Slow query detection and automated blocking query identification
- Database topology maps showing upstream and downstream service dependencies
- Alert policies with dynamic anomaly-based thresholds
- Cross-stack correlation: database metrics alongside APM traces and infrastructure data in the same view
- Support for managed database services including RDS, Aurora, Cloud SQL, and Azure SQL
- Live query sampling for real-time investigation during active incidents
Pricing
Datadog Database Monitoring pricing is not publicly listed and requires a direct conversation with sales. Infrastructure Monitoring starts at $15/host/month; APM starts at $31/host/month billed annually. Database Monitoring is priced separately per database host.
Pros
- Deep query analysis with execution plan capture included out of the box
- Strong cross-stack correlation with APM traces, logs, and infrastructure metrics
- Broad managed database service support across major cloud providers
- Mature alert and dashboard ecosystem with a large library of out-of-the-box integrations
Cons
- Pricing is opaque and can escalate quickly at scale with multiple database hosts
- Full value requires significant Datadog investment across other product lines
- Data retention on lower tiers may require plan upgrades for longer historical analysis
G2 Ratings: 4.4/5
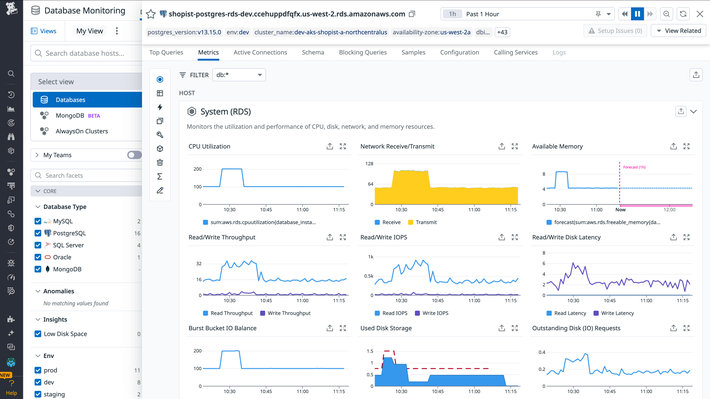
3. SolarWinds Database Observability
SolarWinds Database Observability is a SaaS database monitoring tool designed for cloud-native teams running MySQL, PostgreSQL, MongoDB, Redis, and SQL Server. It provides query analysis, wait-time breakdowns, and execution plan visibility with a lightweight agent model that works well in containerized and cloud-managed database environments.
SolarWinds rebuilt this product significantly from the older DPA (Database Performance Analyzer) line. The result is a more modern interface and stronger cloud database support that reflects how most teams now deploy databases.
Key features
- Query execution analysis with detailed wait-time breakdowns across CPU, I/O, and lock contention
- Execution plan capture with advisor-style optimization recommendations
- Anomaly detection on query performance trends
- Support for RDS, Aurora, Cloud SQL, and other managed database services
- SaaS deployment with lightweight agent-based collection
- Database topology and dependency mapping
Pricing
SolarWinds Database Observability is priced at approximately $117/month per database billed annually, or around $142/month on a monthly term. Pricing scales by database instance count.
Pros
- Strong query wait-time analysis with actionable breakdowns by wait event type
- Clean SaaS interface with fast setup and low configuration overhead
- Works well with AWS RDS and Aurora managed services
- Purpose-built for database monitoring without feature bloat from adjacent products
Cons
- Per-database pricing adds up quickly for teams with large or diverse database fleets
- Limited integration with observability data outside the SolarWinds ecosystem
- No on-prem deployment option for compliance-sensitive environments
G2 Ratings: 4.5/5
Try the AI powered DB Monitoring tool, Parseable. Query in plain english. Get started for free
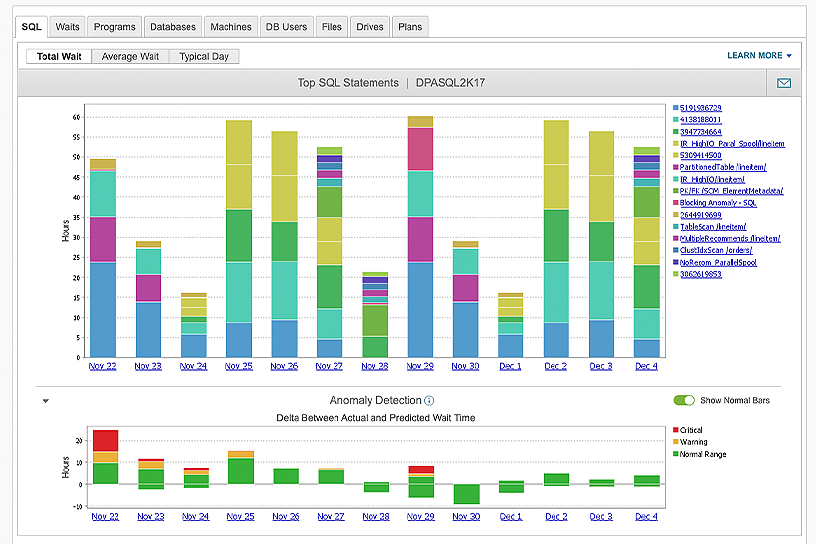
4. Redgate Monitor: Best DB Monitoring tool for SQL Server and PostgreSQL teams
Redgate Monitor (formerly SQL Monitor) is one of the longest-standing database monitoring tools in the SQL Server and PostgreSQL space. It is a strong choice for DBA teams that need deep per-query analysis, blocking chain visibility, and SQL-specific diagnostics rather than broader infrastructure observability.
Its strength is specialization. Rather than covering every database engine, Redgate goes deep on the databases it supports, with execution plan comparison, index advice, and SQL-specific alert conditions that generalist tools rarely match in depth.
Key features
- Real-time and historical query performance monitoring for SQL Server and PostgreSQL
- Blocking chain and deadlock detection with visual dependency mapping
- Execution plan capture and query performance comparison across time periods
- Index fragmentation alerts and missing index recommendations
- Custom alert policies with SQL-based threshold conditions
- Self-hosted and SaaS deployment options
- Role-based access controls built for DBA team workflows
Pricing
Redgate Monitor uses a per-server per-year subscription model with volume discounts for 5 or more instances. Specific pricing loads dynamically and is not published as a flat rate. Contact Redgate for a quote or use their online pricing calculator.
Pros
- Deep SQL Server and PostgreSQL diagnostic capabilities that generalist tools cannot match
- Execution plan comparison is among the best available in this category
- Flexible self-hosted deployment for air-gapped or compliance-driven environments
- Strong long-term track record with DBA teams at enterprise scale
Cons
- Limited to SQL Server and PostgreSQL: no coverage for MongoDB, Redis, or other NoSQL databases
- Observability context is limited to database-level data with no cross-stack correlation to application logs or traces
- Interface can feel dated compared to newer SaaS-native monitoring platforms
G2 Ratings: 4.6/5
5. Dynatrace
Dynatrace is a full-stack observability platform with database monitoring built into its broader Davis AI engine. It automatically discovers database services, captures query-level performance data, and surfaces anomalies without requiring manual alert configuration. Davis AI continuously maps dependencies between databases, applications, and infrastructure, making it well suited for complex microservices environments where a database performance problem often has multi-hop causes.
For teams that want database monitoring as part of a full observability platform rather than a standalone tool, Dynatrace is a mature and capable option.
Key features
- Automatic database discovery and dependency mapping via the OneAgent sensor
- Query-level performance monitoring with execution plan analysis
- Davis AI: automated anomaly detection and root cause analysis without manual threshold tuning
- Database-to-service topology showing which microservices call which databases and at what rate
- Support for MySQL, PostgreSQL, Oracle, SQL Server, MongoDB, and additional engines
- Full-stack correlation: database events alongside application traces and infrastructure metrics
- Code-level profiling available on Full-Stack tiers
Pricing
Dynatrace pricing starts at $7/host/month (Foundation), $29/host/month (Infrastructure Monitoring), and $58/month per 8 GiB of host memory (Full-Stack). Database Monitoring capabilities are part of the Full-Stack tier.
Pros
- Davis AI significantly reduces alert noise compared to static threshold-based monitoring
- Automatic discovery minimizes configuration overhead in dynamic environments
- Strong topology mapping for microservices architectures with many database dependencies
- Broad database engine and managed service support
Cons
- Full database monitoring capability requires the Full-Stack tier, which carries the highest per-host cost
- Memory-based pricing can be unpredictable for teams running large hosts
- Platform complexity can be overkill for teams with narrower database monitoring requirements
G2 Ratings: 4.5/5
Thinking of implementing Dynatrace for database monitoring? Try Parseable for free before starting POC.
6. IBM Instana
IBM Instana is an observability platform designed for continuous, automated discovery across microservices and database tiers. It uses sensors rather than traditional agents to detect and monitor database instances automatically, covering MySQL, PostgreSQL, MongoDB, Redis, Cassandra, and others.
Instana's differentiation in the database monitoring tools space is its low operational overhead. Most configurations require no manual setup for discovered database types, and performance data starts flowing immediately after sensor deployment. That makes it particularly useful for large enterprise environments where manually configuring monitoring for every database instance is not practical.
Key features
- Automatic database discovery and sensor-based collection with near-zero configuration
- Query performance monitoring with latency, error rate, and throughput metrics
- Anomaly detection with automated correlation to upstream application calls
- Database health dashboards available out of the box
- Support for containerized and Kubernetes-hosted database workloads
- On-prem and SaaS deployment options
- Role-based access and multi-team workspace support
Pricing
IBM Instana pricing starts at approximately $18/host/month (Essentials) and $79.50/host/month (Standard), billed annually. A limited free tier is available. Enterprise pricing is custom.
Pros
- Near-zero configuration for auto-discovered database types speeds up initial deployment
- Strong fit for Kubernetes and containerized database workloads
- Automated root cause analysis reduces manual investigation time during incidents
- Both SaaS and on-prem deployment available for compliance requirements
Cons
- IBM's enterprise procurement model can create friction for smaller or mid-size teams
- Some advanced query-level diagnostics are less detailed than dedicated database monitoring tools
- Interface has a steeper learning curve compared to newer SaaS-native platforms
G2 Ratings: 4.4/5
7. Site24x7: Best for SMB teams needing multi-database monitoring
Site24x7 is a SaaS monitoring platform from Zoho that covers infrastructure, applications, and databases in a single subscription. For small and mid-size teams that want broad monitoring coverage without the cost and complexity of enterprise observability platforms, Site24x7 provides a practical, affordable starting point.
It supports MySQL, PostgreSQL, SQL Server, Oracle, MongoDB, and others. While it does not match the query depth of tools like pganalyze or Redgate Monitor, it provides enough visibility for most operational use cases at a price point that makes sense for smaller environments.
Key features
- Database performance monitoring across multiple engines including MySQL, PostgreSQL, SQL Server, Oracle, and MongoDB
- Slow query detection and connection pool monitoring
- Preconfigured alert templates for common database health issues
- Infrastructure and application monitoring bundled in the same subscription
- Over 100 pre-built integrations including PagerDuty, Slack, and Jira
- Custom dashboards and scheduled reports
- 30-day free trial with full feature access
Pricing
Site24x7 plans start at $9/month. Database monitoring is included in infrastructure and application monitoring plans. Pricing scales by number of monitors configured.
Pros
- Very affordable entry point for SMB and startup engineering teams
- Broad monitoring coverage beyond databases (infrastructure, URLs, applications) in one subscription
- Easy setup with minimal configuration required
- Strong alert integration library for popular DevOps and incident management tools
Cons
- Query-level diagnostic depth is limited compared to specialist database monitoring tools
- Not well suited for large enterprise database fleets with complex DBA workflows
- Advanced customization options can feel constrained for experienced users
G2 Ratings: 4.6/5
Try the overall best DB monitoring tool, Parseabe. Get started for free
8. ManageEngine Applications Manager
ManageEngine Applications Manager is an on-prem application and infrastructure monitoring platform that covers MySQL, PostgreSQL, SQL Server, Oracle, MongoDB, and a wide range of other database engines. It is a strong fit for enterprise teams with compliance or data residency requirements that prevent the use of SaaS-based monitoring tools.
Applications Manager takes a traditional IT monitoring approach: comprehensive coverage across applications, servers, databases, and network infrastructure, managed entirely within the enterprise perimeter.
Key features
- Database performance monitoring for MySQL, PostgreSQL, SQL Server, Oracle, MongoDB, and others
- Query performance analysis and slow query identification
- Resource utilization monitoring across CPU, memory, disk, and connections
- Preconfigured alerts with baseline threshold management
- Integration with ITSM tools including ServiceNow, Jira, and PagerDuty
- Reporting and SLA tracking dashboards
- Free edition available for up to 5 monitors
Pricing
ManageEngine Applications Manager starts at $395/year (Professional edition, 10 monitors). A free edition supports up to 5 applications or servers. The Enterprise edition starts at $3,995/year for 100 monitors.
Pros
- On-prem deployment meets compliance and data residency requirements
- Free tier available for small teams evaluating the platform before purchasing
- Broad application and database coverage in a single platform
- Strong ITSM integrations for enterprise ticketing and escalation workflows
Cons
- On-prem architecture requires internal infrastructure to manage, maintain, and scale
- Interface is less modern than cloud-native alternatives
- Query-level diagnostics are shallower than dedicated database monitoring tools
- Not well suited to cloud-native or containerized workloads
G2 Ratings: 4.5/5
9. pganalyze: Best for deep PostgreSQL query analysis
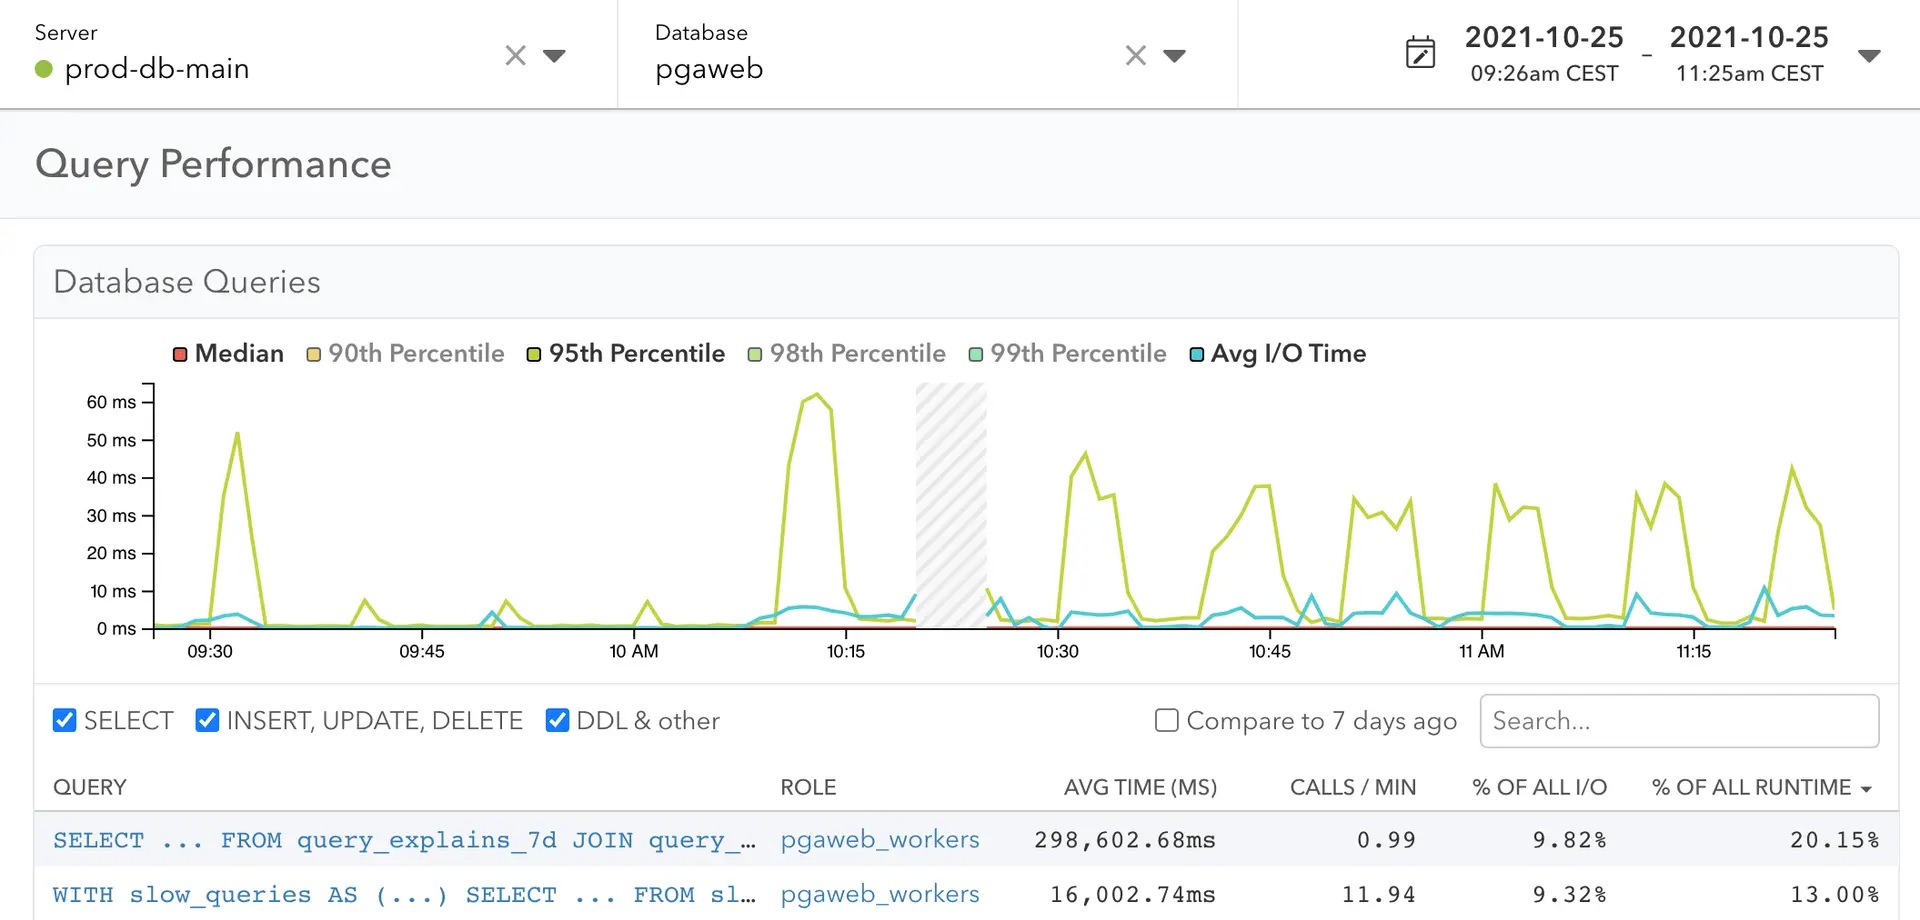
pganalyze is a purpose-built database monitoring tool for PostgreSQL. It goes deeper on query performance than any general-purpose observability platform: per-query execution plans, VACUUM analysis, index advisor recommendations, and wait event breakdowns are all available out of the box.
If your team runs PostgreSQL heavily and needs the diagnostic depth that a senior DBA would want, pganalyze delivers it in a clean, easy-to-navigate SaaS interface. The tradeoff is focus: it covers PostgreSQL only, and it does not connect database events to broader application or infrastructure data.
Key features
- Normalized query tracking with latency trends, call counts, and execution plan history
- VACUUM and autovacuum monitoring with advisor-level recommendations
- Index advisor with unused and missing index detection
- Log-based analysis for slow queries, lock waits, and connection issues
- Query plan visualization and regression detection between deployments
- Automated health checks with prioritized actionable recommendations
- Supports Amazon RDS, Aurora, Cloud SQL, Azure Database for PostgreSQL, Heroku, and self-managed instances
Pricing
pganalyze starts at $149/month for one database server (Production plan). The Scale plan is $399/month for up to 4 servers, with additional servers at $100/month each. Enterprise pricing is custom with self-hosted deployment available.
Pros
- Best-in-class PostgreSQL query diagnostics, particularly for VACUUM and autovacuum analysis
- Clean interface with DBA-focused workflows that make the data immediately actionable
- Supports all major managed PostgreSQL services without additional configuration
- Query plan comparison across time periods surfaces regressions that are hard to catch otherwise
Cons
- PostgreSQL only: not suitable for teams running mixed database environments
- Per-server pricing adds up for larger PostgreSQL fleets
- No broader observability context: database events are not correlated with application logs, traces, or infrastructure data
G2 Ratings: 4.4/5
10. Percona Monitoring and Management (PMM): Best open-source database monitoring tool
Percona Monitoring and Management (PMM) is a free, open-source database monitoring tool for MySQL, PostgreSQL, and MongoDB. It is self-hosted and includes query analytics, performance metrics, and Grafana-based dashboards. For teams with the infrastructure capacity to run it, PMM delivers significant depth at no licensing cost.
PMM is particularly strong for teams running Percona-optimized database distributions (Percona Server for MySQL, Percona XtraDB Cluster), though it works with standard MySQL and PostgreSQL deployments as well.
Key features
- Query Analytics (QAN) with per-query execution time, wait events, and execution plan capture
- Grafana-based dashboards with prebuilt database health views across supported engines
- Alerting via Grafana Alertmanager
- Slow query log analysis for MySQL and PostgreSQL
- Support for MySQL, PostgreSQL, and MongoDB
- No licensing cost: fully open-source and community-supported
- Integration with Percona Advisors for query and schema optimization recommendations
Pricing
Percona PMM is free and open-source. Self-hosting costs apply for the compute and storage running the PMM server. Percona offers commercial support contracts separately for teams that need it.
Pros
- Fully free with no licensing fees, making it the most cost-accessible option in this list
- Strong query analytics for MySQL and PostgreSQL workloads
- Grafana dashboards are customizable and already familiar to most DevOps and SRE teams
- Large open-source community backed by Percona's commercial database expertise
Cons
- Requires self-hosting: your team is responsible for deployment, upgrades, storage scaling, and availability of the monitoring stack itself
- No managed SaaS option for teams that prefer not to operate their own monitoring infrastructure
- MongoDB support is less mature than MySQL and PostgreSQL coverage
- No cross-stack observability context beyond database metrics
G2 Ratings: 4.5/5
How to choose the right database monitoring tool
The comparison table and tool breakdowns above narrow the field considerably. These questions help finalize the decision.
- Start with your database engines. Tools like pganalyze and Redgate Monitor are exceptional but cover only specific databases. If you run MySQL, PostgreSQL, and MongoDB, you need a tool that covers all three, or a clear plan for filling the gaps with a second tool.
Decide whether you need DBA depth or broader observability context. pganalyze and Redgate go very deep on specific databases but tell you nothing about what else changed in your stack when a query degraded. Platforms like Parseable, Datadog, and Dynatrace connect database telemetry to application and infrastructure context. One approach fits DBA-heavy teams. The other matters more for platform and SRE teams doing cross-stack incident investigation.
Estimate your telemetry volume and retention needs. High-cardinality database telemetry at scale can make per-host or per-database pricing expensive quickly. Parseable's consumption-based model and Percona PMM's open-source approach offer more cost-predictable paths for high-volume environments.
Decide whether logs, metrics, and traces need to work together. If your incident response workflow requires correlating a slow database query with an upstream application error and a recent deployment, you need a platform that handles all three. If you only need database metrics, a specialist tool will likely serve you better.
Check cloud vs on-prem requirements. Compliance constraints often make this the deciding factor. ManageEngine Applications Manager and Redgate Monitor support on-prem deployment. Most other tools in this list are SaaS-first, with some BYOC options.
Match the pricing model to your reality. Per-database-instance pricing (SolarWinds, pganalyze) is straightforward but can become expensive at scale. Per-host pricing (Dynatrace, Instana) depends on how many hosts serve database workloads. Consumption-based pricing (Parseable) rewards efficient telemetry pipelines. Run the math at your actual scale before committing.
Use stack fit as a filter, not the final answer. If you already use Datadog for APM, adding Datadog Database Monitoring is frictionless. But that convenience should not stop you from comparing total cost and capability against alternatives like Parseable that may offer better economics for your specific telemetry volume and retention requirements.
Conclusion
There is no single best database monitoring tool for every team. The right choice depends on whether your priority is DBA-level diagnostic depth, broader observability coverage across your full stack, open-source flexibility, or pricing predictability at scale.
For PostgreSQL-heavy environments that need deep execution plan analysis, pganalyze is hard to beat. For organizations already invested in a specific vendor ecosystem, Datadog or Dynatrace offer the path of least resistance. For teams monitoring mixed database environments and wanting to correlate database telemetry with logs, metrics, and traces without paying per-database seat fees, Parseable offers a genuinely different architectural approach to what database monitoring tools can look like in practice.
The strongest tools in 2026 are not just alerting on thresholds. They are giving engineering teams the context to understand why something went wrong, and the retention depth to investigate it properly, whether the incident happened five minutes ago or five weeks ago.
