

This release is about making Parseable easier to operate at scale.
We’ve added dedicated APM support, end-to-end ingestion traces, PromQL support for metrics workflows, and scoped API keys inside Access Management. These updates give teams more visibility into services, pipelines, metrics, and machine access, without stitching together separate systems for every observability workflow.
Here’s what’s included in this release.
APM Support
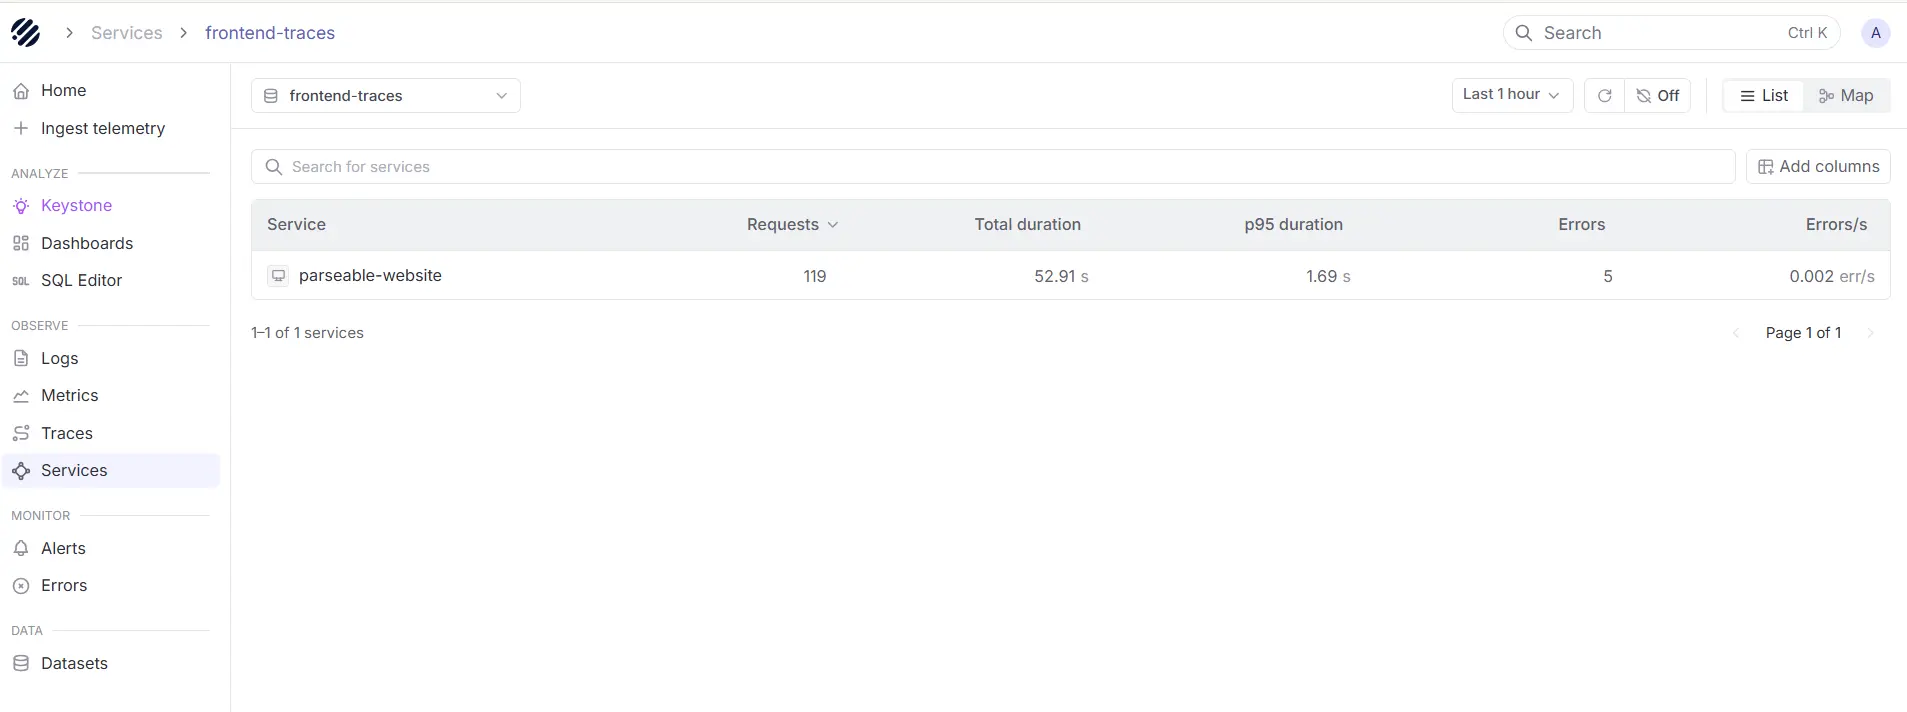
APM is now a dedicated workflow inside Parseable. With this release, a new Services view sits in the sidebar as the entry point for application performance monitoring, listing every service emitting traces and showing requests, error percentage, and latency for each one in a sortable, paginated table.
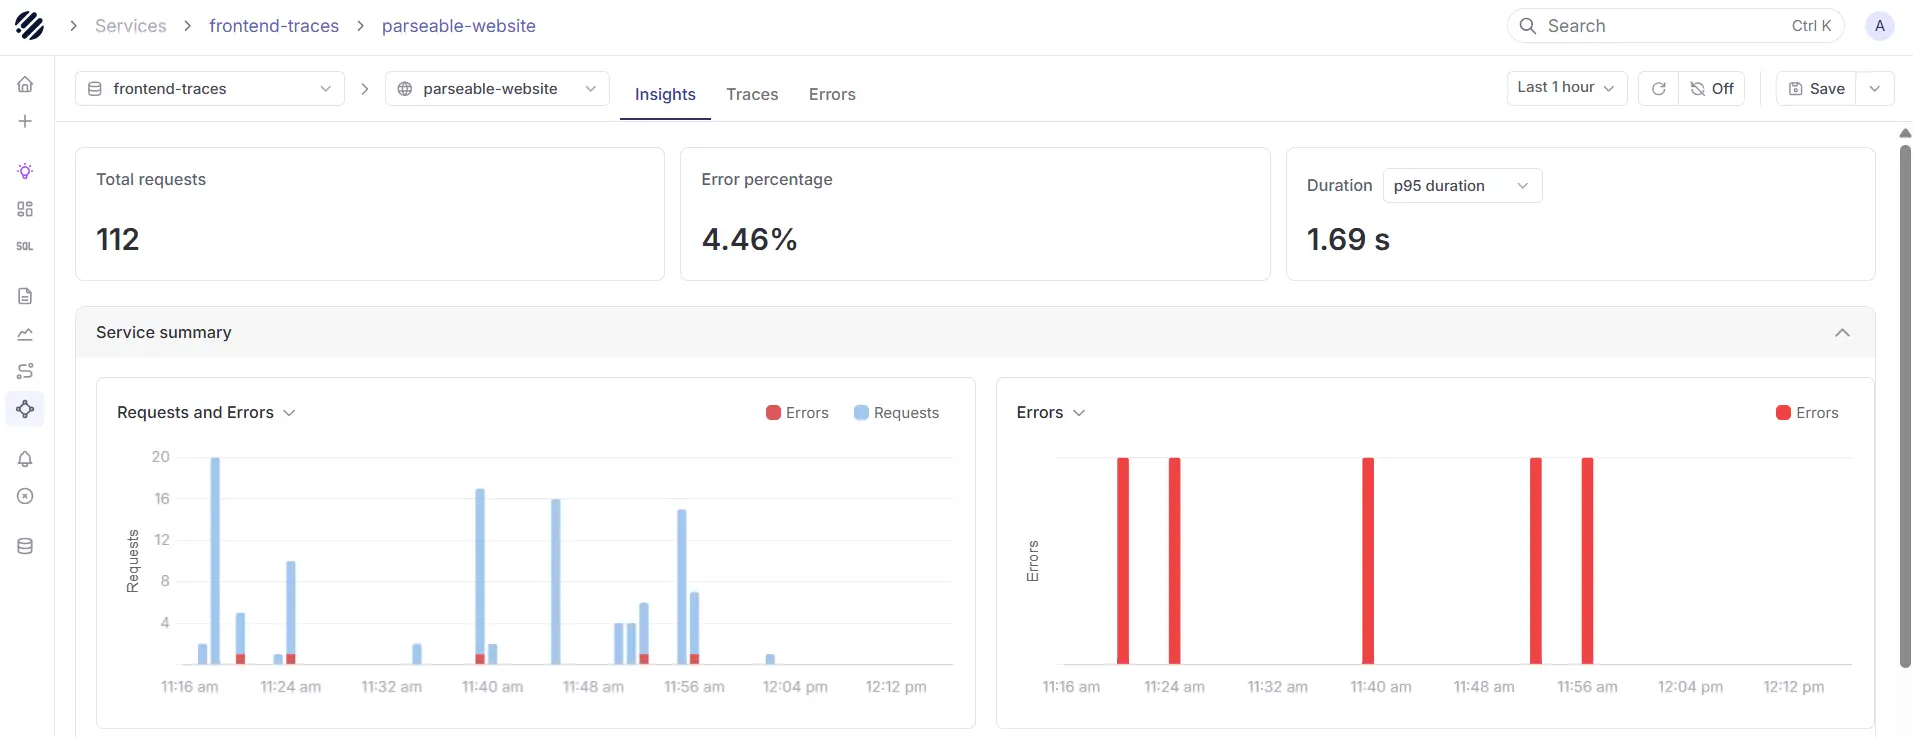
Click into a service and Parseable opens a service-scoped view with three tabs: Insights for detailed metrics and high-level breakdown of errors, Traces for the spans flowing through that service, and Errors for failed requests filtered to it.
What's new:
- Browse every service from a dedicated Services page in the sidebar, with sortable, paginated rows.
- View requests, error percentage, and latency per service through service overview boxes, the standard RED metrics for any APM workflow.
- Drill into a service with Insights, Traces, and Errors tabs scoped to that service.
- Open any service or APM route through deep links from runbooks, alerts, or external tools.
Read the APM and Traces documentation to learn how to instrument services, navigate the Services view, and investigate latency and errors per service in Parseable.
Ingestion Traces
Ingestion is now a fully traced workflow inside Parseable. With this release, the server emits OpenTelemetry spans across the entire ingestion path, from the moment a batch hits the API through schema inference, record-batch conversion, staging, flush, and the final upload to object storage.
What's new:
-
Trace ingestion end to end with OpenTelemetry spans across schema inference, record-batch conversion, staging, flush, and object-store upload, plus the local and remote sync cycles running in the background.
-
Wire Parseable into any OTel collector with standard env vars for auth or routing.
-
Tune the actix server for your traffic profile with new CLI args and matching P_ACTIX_* env vars for request timeout, keep-alive, worker count, connection backlog, and max connections per worker.
-
Run hotter ingest with a batched path that does one schema inference per batch instead of one per record, rayon-parallel per-record processing for partitioned streams, a zero-allocation byte-size counter on the hot path, and guards that skip a tick when the previous local or remote sync cycle is still running.
Read the Ingestion Traces documentation to learn how to point your collector at Parseable, propagate trace context from your upstream services, and tune ingest performance with the new server flags.
PromQL Support
With this release, a built-in PromQL engine sits behind every metrics stream and is exposed through a Prometheus-compatible HTTP API under /prometheus/api/v1, so existing Grafana dashboards and Prometheus-compatible tooling can simply point at Parseable and work without changes.
What's new:
- Query metrics with PromQL through Prometheus-compatible endpoints: instant query, range query, series, labels, and label values, all under /prometheus/api/v1.
- Existing Grafana Prometheus data sources work unchanged, and the Parseable Grafana plugin adds multi-stream support for mixing logs, traces, and metrics in a single dashboard.
- Use the full PromQL surface, including 50+ functions, 12 aggregation operators, arithmetic, comparison, set, and binary operators with vector matching modifiers, and subqueries.
- Run heavy queries safely with distributed execution across queries, query splitting for long ranges, result caching with disk persistence, per-query memory, series, and sample guards, and operational endpoints for cardinality analysis, TSDB status, and currently active queries. Every response returns headers for cache status, samples scanned, and split execution.
Read the PromQL documentation to learn more.
Access Management and API Keys
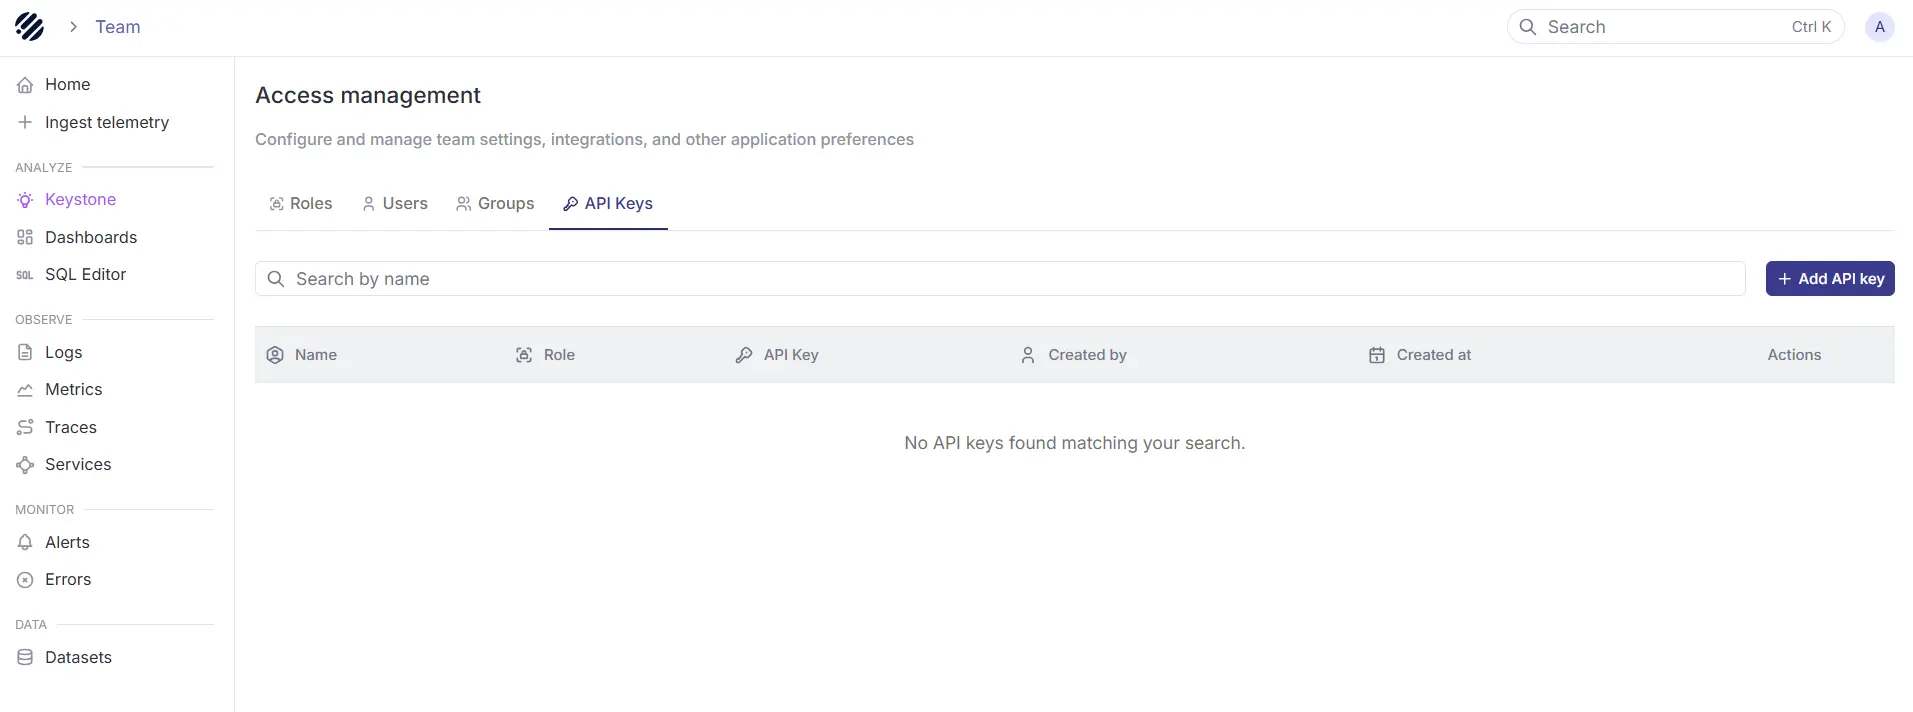
Access Management is now the central place to manage users, roles, and API keys in Parseable. With this release, teams can create scoped API keys for programmatic access to Parseable, without relying on personal user credentials.
API keys are best suited for log forwarders, CLI tools, automation scripts, AI agents, and other clients where Basic Auth or OIDC is not the right fit. Each API key behaves like a Parseable identity, inherits permissions from assigned roles, and can be used through the X-API-Key header.
What’s new:
- Create and manage API keys from Access Management.
- Assign one or more roles to every API key.
- Use dataset-scoped keys to restrict the key to one or more named datasets
- Revoke keys independently without affecting users or other workloads.
- Use API keys for ingestion and query workflows through the X-API-Key header.
Read the API Keys documentation to learn how to create, scope, use, and rotate keys in Parseable.

