
LiteLLM
Send LiteLLM Gateway traces and metrics to Parseable using OpenTelemetry
LiteLLM is an OpenAI-compatible gateway for routing model requests across providers such as OpenAI, Anthropic, Azure OpenAI, Vertex AI, Bedrock, and local model endpoints. Teams usually place it in front of applications when they want one place to manage model routing, keys, retries, budgets, fallbacks, and policy.
Parseable helps you see what is happening inside that gateway. With OpenTelemetry enabled, LiteLLM can emit traces for model requests. With the Prometheus callback enabled, LiteLLM exposes gateway metrics at /metrics. This guide sends both signals to Parseable so you can inspect request paths, model latency, token usage, errors, and proxy-level behavior from one place.
How it works
The cleanest production setup is to keep Parseable credentials in an OpenTelemetry Collector. LiteLLM sends OpenTelemetry traces to the Collector, the Collector scrapes LiteLLM's Prometheus metrics endpoint, and both signals are forwarded into Parseable datasets.
Application
  |
  | OpenAI-compatible request
  v
LiteLLM Gateway
  |                                 |
  | OTLP traces                     | Prometheus scrape
  v                                 v
OpenTelemetry Collector
  |
  +--> litellm-traces   traces dataset in Parseable
  +--> litellm-metrics  metrics dataset in Parseable
Use separate datasets for traces and metrics. Parseable identifies each telemetry signal from its OTLP endpoint.
Prerequisites
Before you start, keep these ready:
- A running Parseable instance
- A Parseable API key with ingest access
- Python 3.10 or later
- A model-provider API key, such as
OPENAI_API_KEY - LiteLLM Proxy or Gateway
- An OpenTelemetry Collector that LiteLLM can reach
Set up LiteLLM with Parseable
Create Parseable datasets
Create a trace dataset for LiteLLM spans:
curl -X PUT "$PARSEABLE_URL/api/v1/logstream/litellm-traces" \
  -H "Authorization: Bearer ${PARSEABLE_API_KEY}" \
  -H "X-P-Telemetry-Type: traces" \
  -H "X-P-Dataset-Tag: agent-observability"
Create a metrics dataset for LiteLLM gateway and GenAI metrics:
curl -X PUT "$PARSEABLE_URL/api/v1/logstream/litellm-metrics" \
  -H "Authorization: Bearer ${PARSEABLE_API_KEY}" \
  -H "X-P-Telemetry-Type: metrics"
The trace dataset appears under traces and agent observability views. The metrics dataset appears in the Metrics page.
Configure LiteLLM
Install LiteLLM Proxy and the OpenTelemetry packages:
pip install "litellm[proxy]" \
  opentelemetry-api \
  opentelemetry-sdk \
  opentelemetry-exporter-otlp-proto-http \
  opentelemetry-instrumentation-fastapi \
  prometheus-client==0.20.0
Create litellm-config.yaml:
model_list:
  - model_name: gpt-4o-mini
    litellm_params:
      model: openai/gpt-4o-mini
      api_key: os.environ/OPENAI_API_KEY

litellm_settings:
  callbacks:
    - otel
    - prometheus

callback_settings:
  otel:
    attributes:
      exclude_list:
        - hidden_params
        - metadata.requester_metadata
        - metadata.requester_ip_address
        - metadata.spend_logs_metadata
        - metadata.mcp_tool_call_metadata
        - metadata.vector_store_request_metadata
        - metadata.prompt_management_metadata
The otel callback enables LiteLLM OpenTelemetry export. LITELLM_OTEL_V2=true turns on the newer trace shape, but the callback still needs to be present. The prometheus callback exposes gateway metrics at /metrics.
The attribute filter matters in production. Some metadata fields are close to unique for every request. If those fields are attached to metrics, they can create too many time series. The example keeps traces useful while keeping metric cardinality more controlled.
Configure the OpenTelemetry Collector
Create otel-collector-config.yaml:
receivers:
  otlp:
    protocols:
      http:
        endpoint: 0.0.0.0:4318

  prometheus/litellm:
    config:
      scrape_configs:
        - job_name: litellm
          scrape_interval: 15s
          static_configs:
            - targets: ["litellm:4000"]
          authorization:
            type: Bearer
            credentials: "${env:LITELLM_MASTER_KEY}"

processors:
  batch: {}

exporters:
  otlphttp/parseable_traces:
    endpoint: "${env:PARSEABLE_URL}"
    encoding: json
    headers:
      Authorization: "Bearer ${env:PARSEABLE_API_KEY}"
      X-P-Stream: litellm-traces

  otlphttp/parseable_metrics:
    endpoint: "${env:PARSEABLE_URL}"
    encoding: json
    headers:
      Authorization: "Bearer ${env:PARSEABLE_API_KEY}"
      X-P-Stream: litellm-metrics

service:
  pipelines:
    traces:
      receivers: [otlp]
      processors: [batch]
      exporters: [otlphttp/parseable_traces]

    metrics:
      receivers: [otlp, prometheus/litellm]
      processors: [batch]
      exporters: [otlphttp/parseable_metrics]
This Collector receives OpenTelemetry traces and optional GenAI metrics from LiteLLM. It also scrapes the LiteLLM /metrics endpoint, which gives you broader gateway metrics such as proxy requests, failures, routing behavior, spend, token usage, rate limits, queues, Redis, and PostgreSQL metrics.
For local testing, if LiteLLM is running on your host instead of inside the same Docker network as the Collector, replace litellm:4000 with host.docker.internal:4000.
Start LiteLLM
Set the LiteLLM and OpenTelemetry environment variables:
export OPENAI_API_KEY="<openai-api-key>"
export LITELLM_MASTER_KEY="<litellm-master-key>"

export LITELLM_OTEL_V2="true"
export LITELLM_OTEL_INTEGRATION_ENABLE_METRICS="true"
export OTEL_EXPORTER="otlp_http"
export OTEL_ENDPOINT="http://localhost:4318"
export OTEL_SERVICE_NAME="litellm-gateway"
export OTEL_ENVIRONMENT_NAME="production"
export OTEL_INSTRUMENTATION_GENAI_CAPTURE_MESSAGE_CONTENT="no_content"
Then start the gateway:
litellm --config litellm-config.yaml --port 4000Send a request through LiteLLM:
curl http://localhost:4000/v1/chat/completions \
  -H "Authorization: Bearer ${LITELLM_MASTER_KEY}" \
  -H "Content-Type: application/json" \
  -d '{
    "model": "gpt-4o-mini",
    "messages": [
      {
        "role": "user",
        "content": "Explain observability in one sentence."
      }
    ]
  }'
For streaming latency metrics, send a streaming request and consume the full response:
curl -N http://localhost:4000/v1/chat/completions \
  -H "Authorization: Bearer ${LITELLM_MASTER_KEY}" \
  -H "Content-Type: application/json" \
  -d '{
    "model": "gpt-4o-mini",
    "stream": true,
    "messages": [
      {
        "role": "user",
        "content": "Explain tracing briefly."
      }
    ]
  }'
Time-to-first-token and time-per-output-token metrics appear only after successful streaming responses with the required timing data.
What you get in Parseable
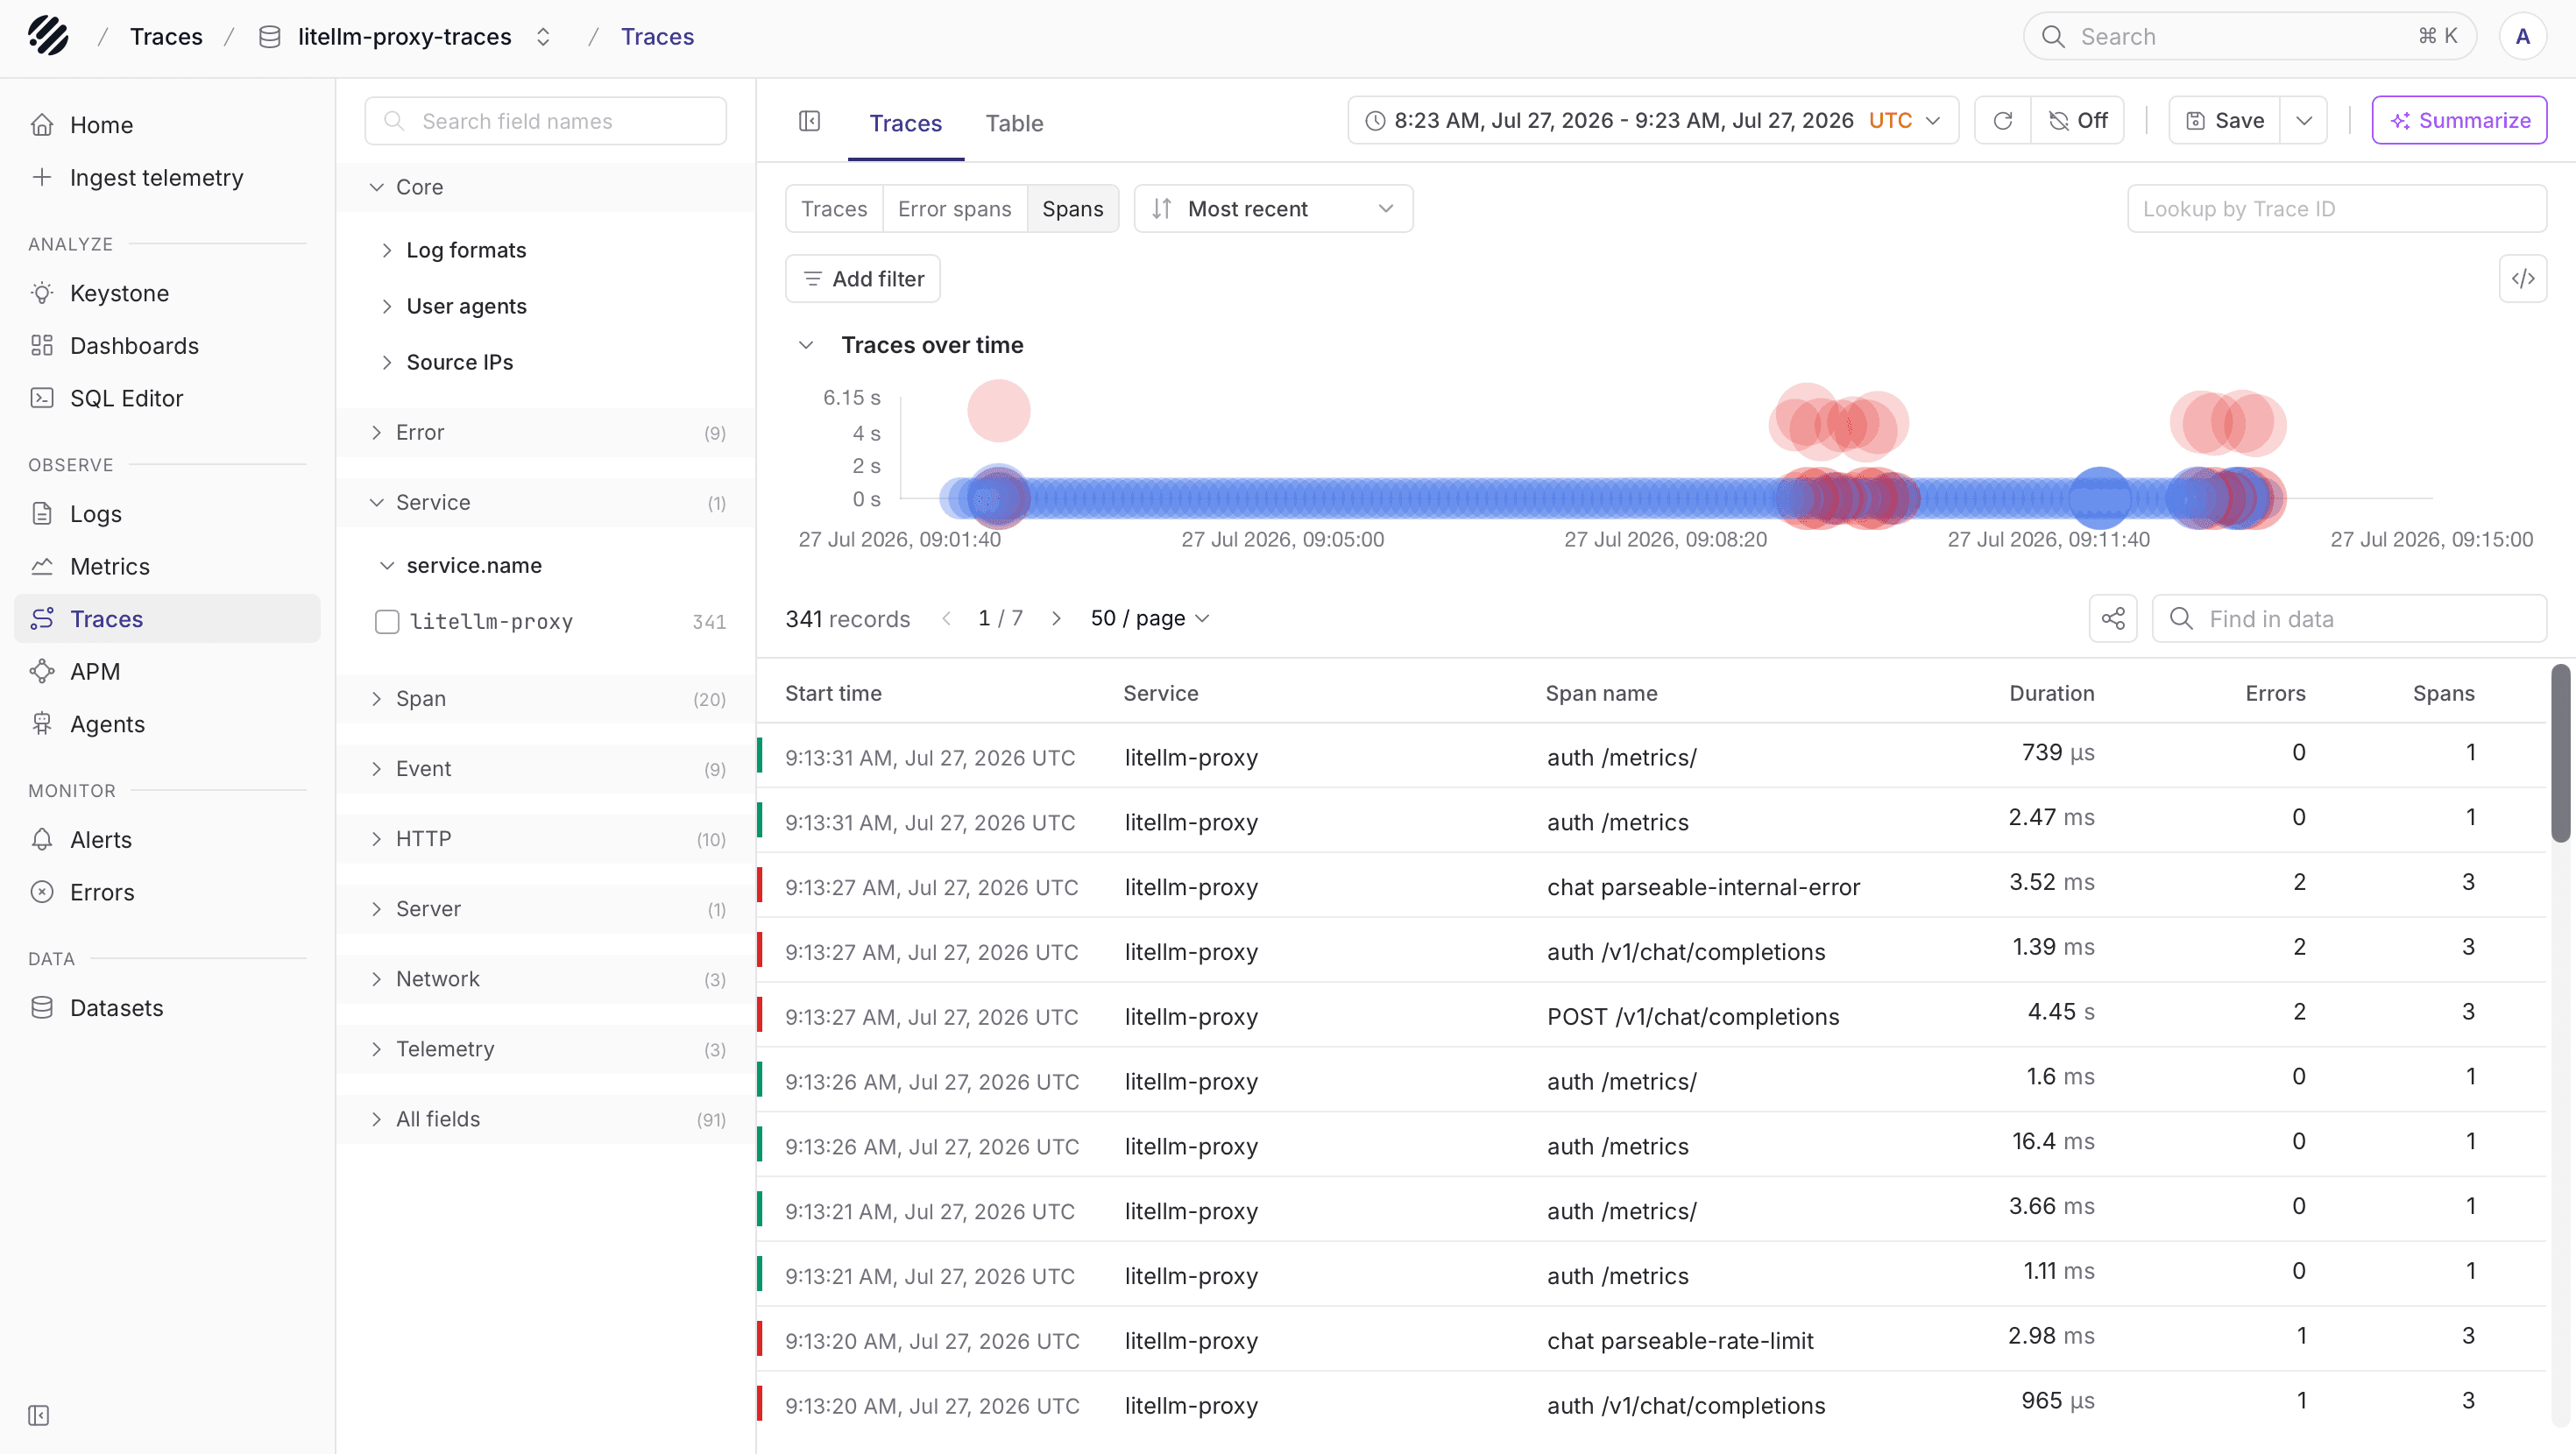
Open litellm-traces from the Traces page. A request can include the incoming HTTP call, routing work, guardrails, cache or database calls, and the LLM provider call. When an upstream application propagates W3C trace context, LiteLLM can continue that trace so the agent, gateway, and model call are connected.
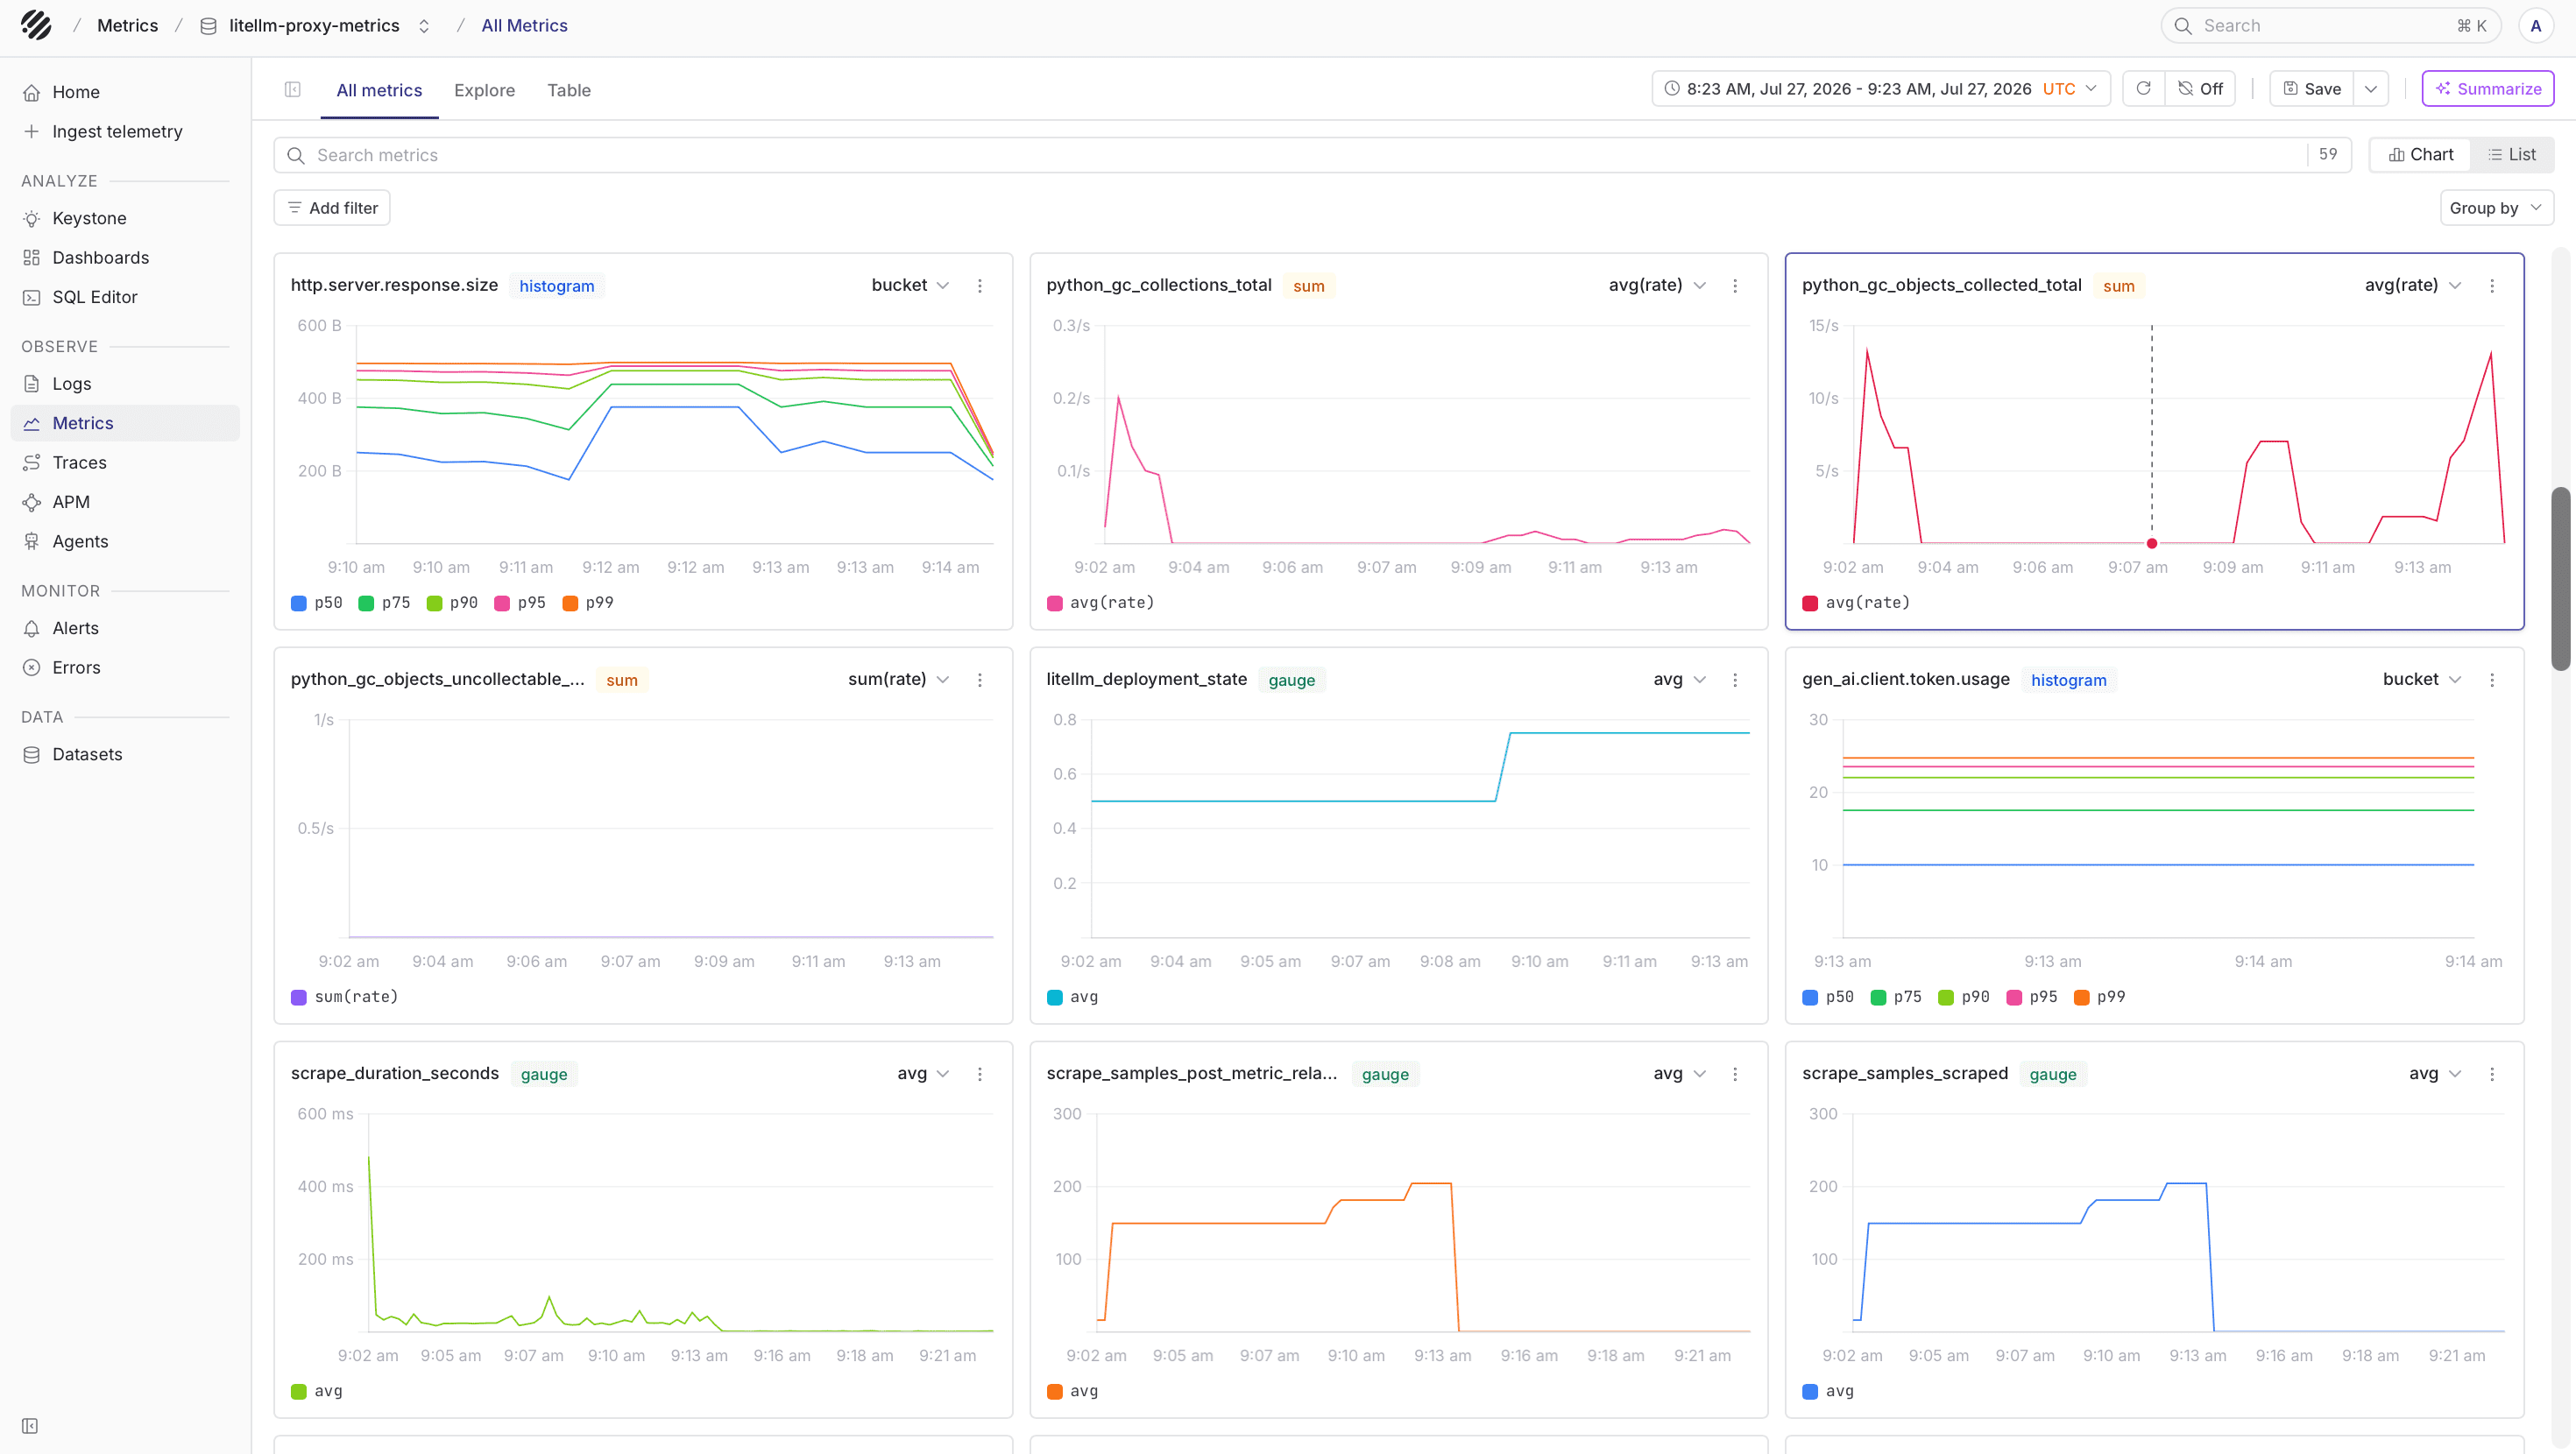
Open litellm-metrics from the Metrics page. You should see LiteLLM proxy metrics from the Prometheus endpoint along with any GenAI metrics emitted by the OpenTelemetry callback.
Common GenAI fields on traces include:
| Field | Meaning |
|---|---|
gen_ai.operation.name | GenAI operation name |
gen_ai.provider.name | Model provider |
gen_ai.request.model | Requested model |
gen_ai.response.model | Model returned by the provider |
gen_ai.usage.input_tokens | Input token count |
gen_ai.usage.output_tokens | Output token count |
litellm.cost.total | Estimated request cost when available |
Common GenAI metrics include:
| Metric | Meaning |
|---|---|
gen_ai.client.operation.duration | End-to-end model call duration |
gen_ai.client.response.duration | Provider response duration |
gen_ai.client.response.time_to_first_token | Time to first streamed token |
gen_ai.client.response.time_per_output_token | Average generation time per output token |
gen_ai.client.token.usage | Input and output token usage |
gen_ai.client.token.cost | Estimated request cost when available |
LiteLLM Prometheus metrics keep their Prometheus-style names, such as litellm_proxy_total_requests_metric and litellm_deployment_failure_responses. Prometheus labels become OpenTelemetry attributes after the Collector receives them.
Message content and privacy
Keep OTEL_INSTRUMENTATION_GENAI_CAPTURE_MESSAGE_CONTENT="no_content" unless you have reviewed the privacy and retention impact. Message capture can store prompts and completions in traces or events.
LiteLLM also supports request-level masking with metadata.mask_input=true and metadata.mask_output=true. For a stronger global setting, use litellm_settings.turn_off_message_logging=true in the LiteLLM config.
Connect LiteLLM to agent traces
If your application already creates agent spans, propagate the W3C traceparent header when it calls LiteLLM. Parseable can then show the agent run, tool work, LiteLLM gateway span, and model provider call in the same trace.
For a Pydantic AI example, see Pydantic AI.
Troubleshooting
-
No traces arrive
Check that
litellm_settings.callbacksincludesotel,LITELLM_OTEL_V2is set totrue, andOTEL_ENDPOINTpoints to the Collector OTLP HTTP receiver. -
No metrics arrive
Check that
litellm_settings.callbacksincludesprometheus, theprometheus-clientpackage is installed, and the Collector can scrapehttp://<litellm-host>:4000/metricswith the LiteLLM bearer token. -
Metrics show too many series
Review the
callback_settings.otel.attributes.exclude_listin the LiteLLM config. For Prometheus metrics, avoid adding high-cardinality custom labels such as raw user identifiers, request IDs, or unique metadata values. -
Streaming metrics are missing
Confirm the request uses
"stream": true, the client consumes the response to completion, and the provider returns timing and token usage information. -
The
/metricsscrape returns unauthorizedLiteLLM requires bearer authentication for
/metricsby default. Make sure the Collector Prometheus receiver uses the sameLITELLM_MASTER_KEYthat LiteLLM expects.
Was this page helpful?