

Ansible Observability with OpenTelemetry and Parseable
When an Ansible playbook fails in production, the default debugging experience is stdout: a wall of text with no timeline, no task duration data, and no structured way to compare the failure to yesterday's successful run. Ansible observability changes that. With a lightweight callback plugin, an OpenTelemetry Collector, and Parseable as the backend, every playbook run becomes a set of structured traces, searchable logs, and queryable records — without rewriting a single playbook.
This guide walks through the complete setup. By the end, you will have Ansible emitting OpenTelemetry traces and logs on every playbook run, an OpenTelemetry Collector routing that telemetry to Parseable, and a working query layer for debugging failures, finding slow tasks, and generating AI-based summaries of what happened.
What you'll build
The Ansible OpenTelemetry pipeline flows like this:
Ansible callback plugin → OTLP HTTP (4318) → OpenTelemetry Collector → Parseable
                                                                         ├── otel-logs stream
                                                                         ├── otel-traces stream
                                                                         └── otel-metrics stream (optional)
By the end of this guide:
- An OpenTelemetry Collector runs on your host, receiving OTLP HTTP on port
4318and gRPC on port4317 - The Ansible callback plugin (
otel.py) emits spans and log records on every playbook and task lifecycle event - The OTLP pipeline routes signals to separate Parseable streams for logs, traces, and optional metrics
- You can filter failed tasks, sort by duration, build SQL queries, and generate AI summaries of any playbook window
Why Ansible runs feel like a black box
Missing task timelines
Standard Ansible output shows tasks completing sequentially, but it does not show how long each task took relative to others, which tasks caused downstream failures, or how this run compares to the last one. Without a trace timeline, causality is invisible.
Slow task blindness
A single slow task can make a fifteen-minute playbook take forty-five minutes. Finding it requires either a careful read of timestamps in stdout or adding explicit timing instrumentation by hand. Neither scales to dozens of playbooks across multiple teams.
Fragmented logs across hosts and runners
In multi-host inventories, stdout is interleaved. Logs for host A and host B arrive in the same stream with no consistent structure for filtering, grouping, or comparing per-host behavior. Centralizing those logs into a structured backend makes per-host analysis practical.
Poor handoffs after failed automation runs
When a playbook failure causes an incident, the person investigating often was not the person who ran the playbook. Without a queryable record of exactly what happened, when, and on which host, handoffs rely on screenshots and memory. Structured traces make the event record self-contained.
See Ansible observability in action with your own data.Get Started with Parseable
Architecture overview: Ansible, OpenTelemetry, and Parseable
How telemetry moves through the pipeline
Ansible playbook runs
  ↓
otel.py callback plugin fires on lifecycle events
(playbook_start, task_start, task_end, playbook_end)
  ↓
OTLP HTTP exporter → OpenTelemetry Collector :4318
  ↓
OTel Collector receives, batches, and enriches signals
  ↓
OTLP HTTP export → Parseable ingestion endpoint
  ↓
Separate streams: otel-logs, otel-traces, otel-metrics
Why this pattern works for Ansible observability
The OpenTelemetry Collector acts as the routing layer. It receives raw OTLP from the callback plugin, applies batch processing to reduce ingest pressure, and can attach resource attributes (environment, team, service version) to all signals before forwarding. Ansible does not need to know about Parseable directly — the Collector handles the routing.
This also means the pipeline is backend-agnostic by design. Parseable is the storage and analysis layer, not a collection dependency. Swapping or adding backends means changing the Collector config, not touching Ansible.
Where Parseable fits
Parseable receives OTLP-formatted telemetry, stores it as structured JSON in named streams, and exposes a SQL query interface for analysis, dashboards, and alerts. For Ansible playbook monitoring, this means: filtered log views by task status and host, trace timelines per playbook run, SQL queries for duration and failure trends, and AI-generated summaries of any time window. Parseable's native OpenTelemetry support accepts traces, logs, and metrics in the same pipeline without separate configuration per signal type.
Prerequisites
Before starting:
- Ansible 2.13 or later
- Python 3.10 or later
- Docker or Podman installed
- A Parseable endpoint with credentials (cloud account or self-hosted)
- Basic familiarity with OpenTelemetry receivers and exporters, and with OTLP HTTP on port
4318 - Access to the demo repository or an Ansible project where callback plugins can be enabled
Quick start
If you want to see the pipeline running before reading the full setup:
git clone https://github.com/parseablehq/ansible-otel-demo
cd ansible-otel-demo

# Copy and edit environment variables
cp .env.example .env

# Start the Collector and Parseable
podman compose up -d

# Confirm Collector is reachable
curl -s -o /dev/null -w "%{http_code}\n" http://localhost:4318

# Run the demo playbook
cd ansible
python -m venv .venv && source .venv/bin/activate
pip install -r requirements.txt
ansible-playbook -i inventory.ini site.yml
After the playbook completes, open Parseable and check the otel-logs and otel-traces streams. You should see log records and spans from the playbook run.
Step-by-step setup
Configure the OpenTelemetry Collector
The OTel Collector receives OTLP from the Ansible callback plugin, batches the telemetry, and exports it to Parseable. Receivers collect telemetry from external sources — in this setup, the Collector's OTLP receiver is the ingestion point for all signals coming from Ansible. See the OpenTelemetry Collector receiver docs for more on how receivers work.
A minimal otel-config.yaml for this setup:
receivers:
  otlp:
    protocols:
      http:
        endpoint: 0.0.0.0:4318
      grpc:
        endpoint: 0.0.0.0:4317

processors:
  batch:
    timeout: 5s
    send_batch_size: 512
  resource:
    attributes:
      - key: service.name
        value: ansible-playbook
        action: upsert

exporters:
  otlphttp/parseablelogs:
    endpoint: ${env:PARSEABLE_ENDPOINT}
    headers:
      Authorization: "Basic ${env:PARSEABLE_BASIC_AUTH_B64}"
      X-P-Stream: ${env:PARSEABLE_LOGS_STREAM}
    tls:
      insecure: true

  otlphttp/parseabletraces:
    endpoint: ${env:PARSEABLE_ENDPOINT}
    headers:
      Authorization: "Basic ${env:PARSEABLE_BASIC_AUTH_B64}"
      X-P-Stream: ${env:PARSEABLE_TRACES_STREAM}
    tls:
      insecure: true

  otlphttp/parseablemetrics:
    endpoint: ${env:PARSEABLE_ENDPOINT}
    headers:
      Authorization: "Basic ${env:PARSEABLE_BASIC_AUTH_B64}"
      X-P-Stream: ${env:PARSEABLE_METRICS_STREAM}
    tls:
      insecure: true

service:
  telemetry:
    logs:
      level: info
  pipelines:
    logs:
      receivers: [otlp]
      processors: [batch, resource]
      exporters: [otlphttp/parseablelogs]
    traces:
      receivers: [otlp]
      processors: [batch, resource]
      exporters: [otlphttp/parseabletraces]
    metrics:
      receivers: [otlp]
      processors: [batch, resource]
      exporters: [otlphttp/parseablemetrics]
Each signal type (logs, traces, metrics) routes to its own Parseable stream via a separate OTLP HTTP exporter. The X-P-Stream header tells Parseable which stream to write to.
Prepare environment variables
Copy .env.example to .env and fill in your values:
OTEL_SERVICE_NAME=ansible-playbook-demo

PARSEABLE_ENDPOINT=http://localhost:8000/api/v1/ingest
PARSEABLE_BASIC_AUTH_B64=REPLACE_ME_BASE64

PARSEABLE_LOGS_STREAM=otel-logs
PARSEABLE_TRACES_STREAM=otel-traces
PARSEABLE_METRICS_STREAM=otel-metrics
Generate the Base64 auth value:
echo -n 'your-username:your-password' | base64Production note: Do not commit .env files. Use a secret manager, CI/CD secret injection, or environment-specific credential handling. Rotate credentials if the demo defaults have been used in a shared environment. Enable TLS for both the Collector endpoint and Parseable in non-local deployments by updating the tls block in the exporter config.
See Ansible observability in action with your own data.Get Started with Parseable for free
Run the Collector
# Docker
docker compose up -d

# Podman
podman compose up -d
Verify the Collector started:
# Check logs
podman compose logs -f otel-collector

# Confirm OTLP HTTP is listening
curl -s -o /dev/null -w "%{http_code}\n" http://localhost:4318
A 200 or 405 response confirms the endpoint is up and accepting connections.
Add the Ansible callback plugin for OpenTelemetry
The demo repository includes callback_plugins/otel.py, a custom callback plugin that fires on Ansible lifecycle events and emits OTLP spans and log records. This guide uses the demo plugin so the telemetry shape is explicit and easy to inspect.
Note: If your team prefers a collection-based path, Ansible's community.general.opentelemetry callback is also available for creating distributed traces from tasks. It can be configured with standard OpenTelemetry environment variables. This guide does not replace the demo plugin with the community callback — if you switch, test the telemetry shape against your Parseable stream schema before adapting any SQL queries.
The demo callback plugin emits:
- Top-level playbook span with
playbook.fileattribute — one per playbook run - Per-task child spans with
task.name,task.action,task.status,host.name - Log records for lifecycle events:
playbook_start,task_start,task_end,playbook_end
Default OTLP endpoints (override with environment variables):
endpoint = os.getenv("OTEL_EXPORTER_OTLP_TRACES_ENDPOINT", "http://localhost:4318/v1/traces")
endpoint = os.getenv("OTEL_EXPORTER_OTLP_LOGS_ENDPOINT",  "http://localhost:4318/v1/logs")
Wire up your Ansible project
Enable the callback plugin in ansible.cfg:
[defaults]
callbacks_enabled = otel
callback_plugins = ./callback_plugins
No changes to your playbooks are needed. The callback fires automatically on every run once it is enabled.
Install the Python dependencies the plugin needs:
pip install opentelemetry-sdk opentelemetry-exporter-otlpRun a playbook and confirm the Collector receives traffic:
ansible-playbook -i inventory.ini site.yml
podman compose logs -f otel-collector
You should see the Collector accepting spans and forwarding them to Parseable.
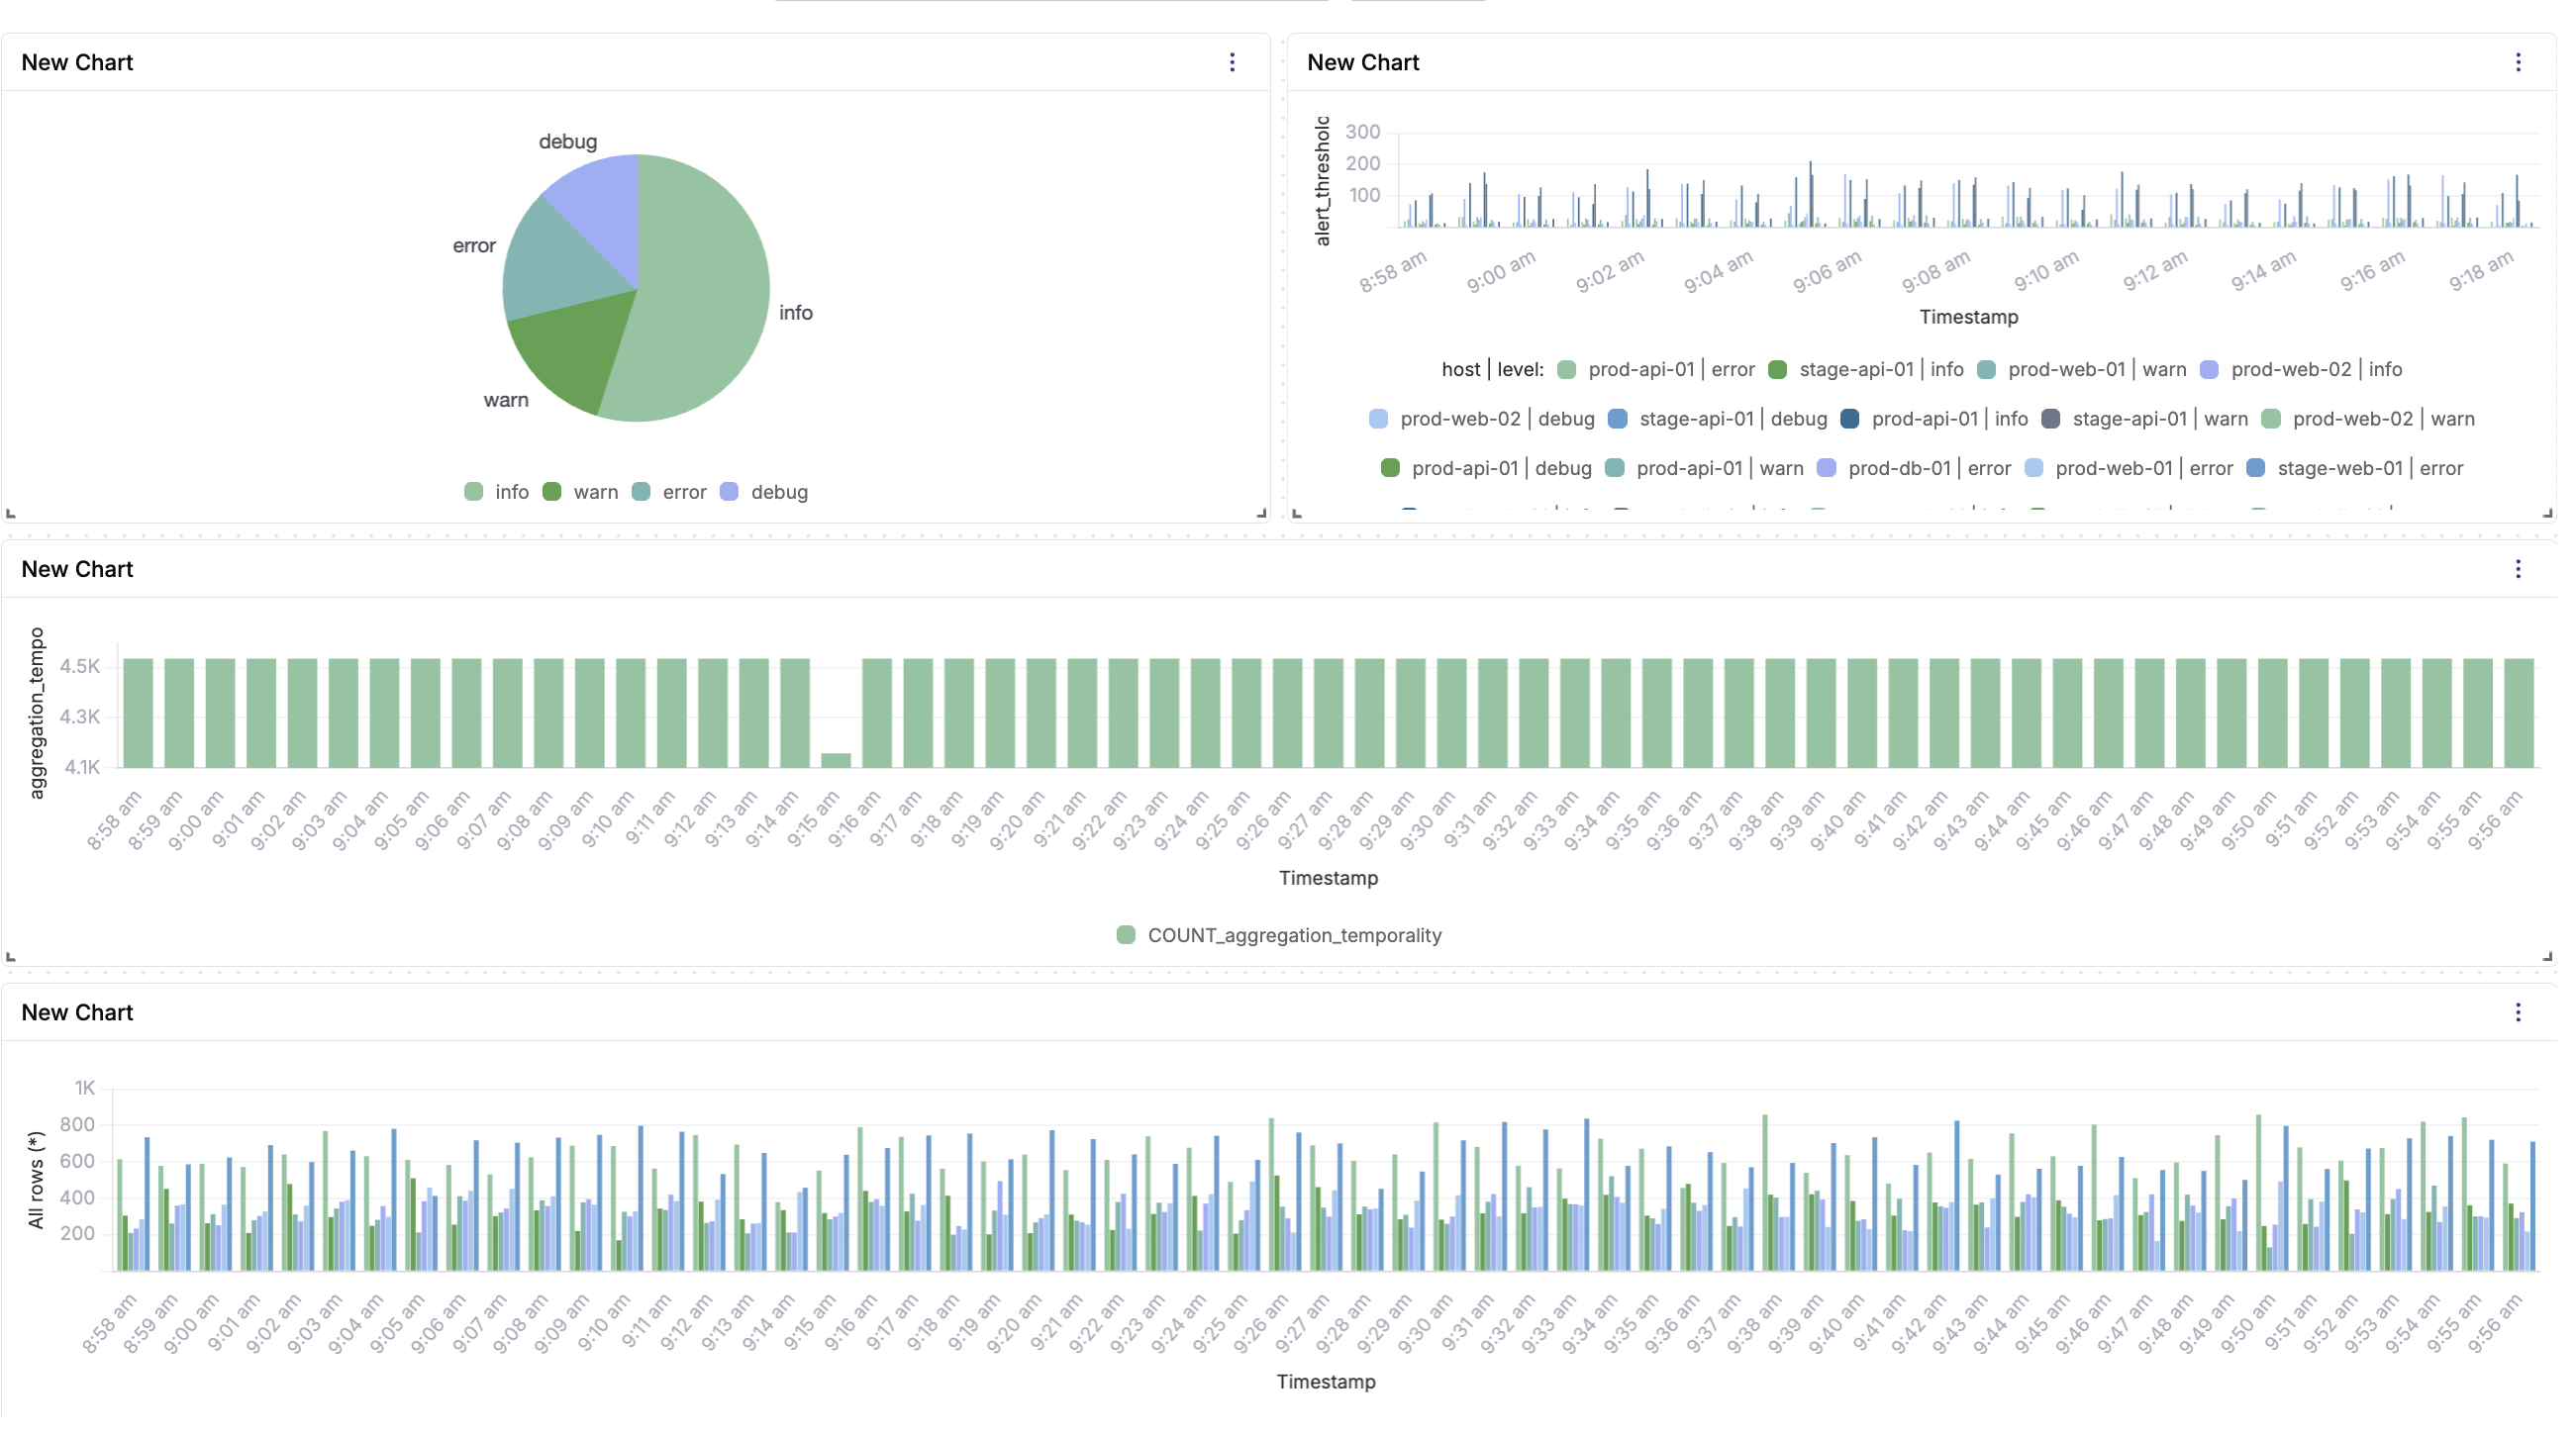
What good Ansible observability looks like in Parseable
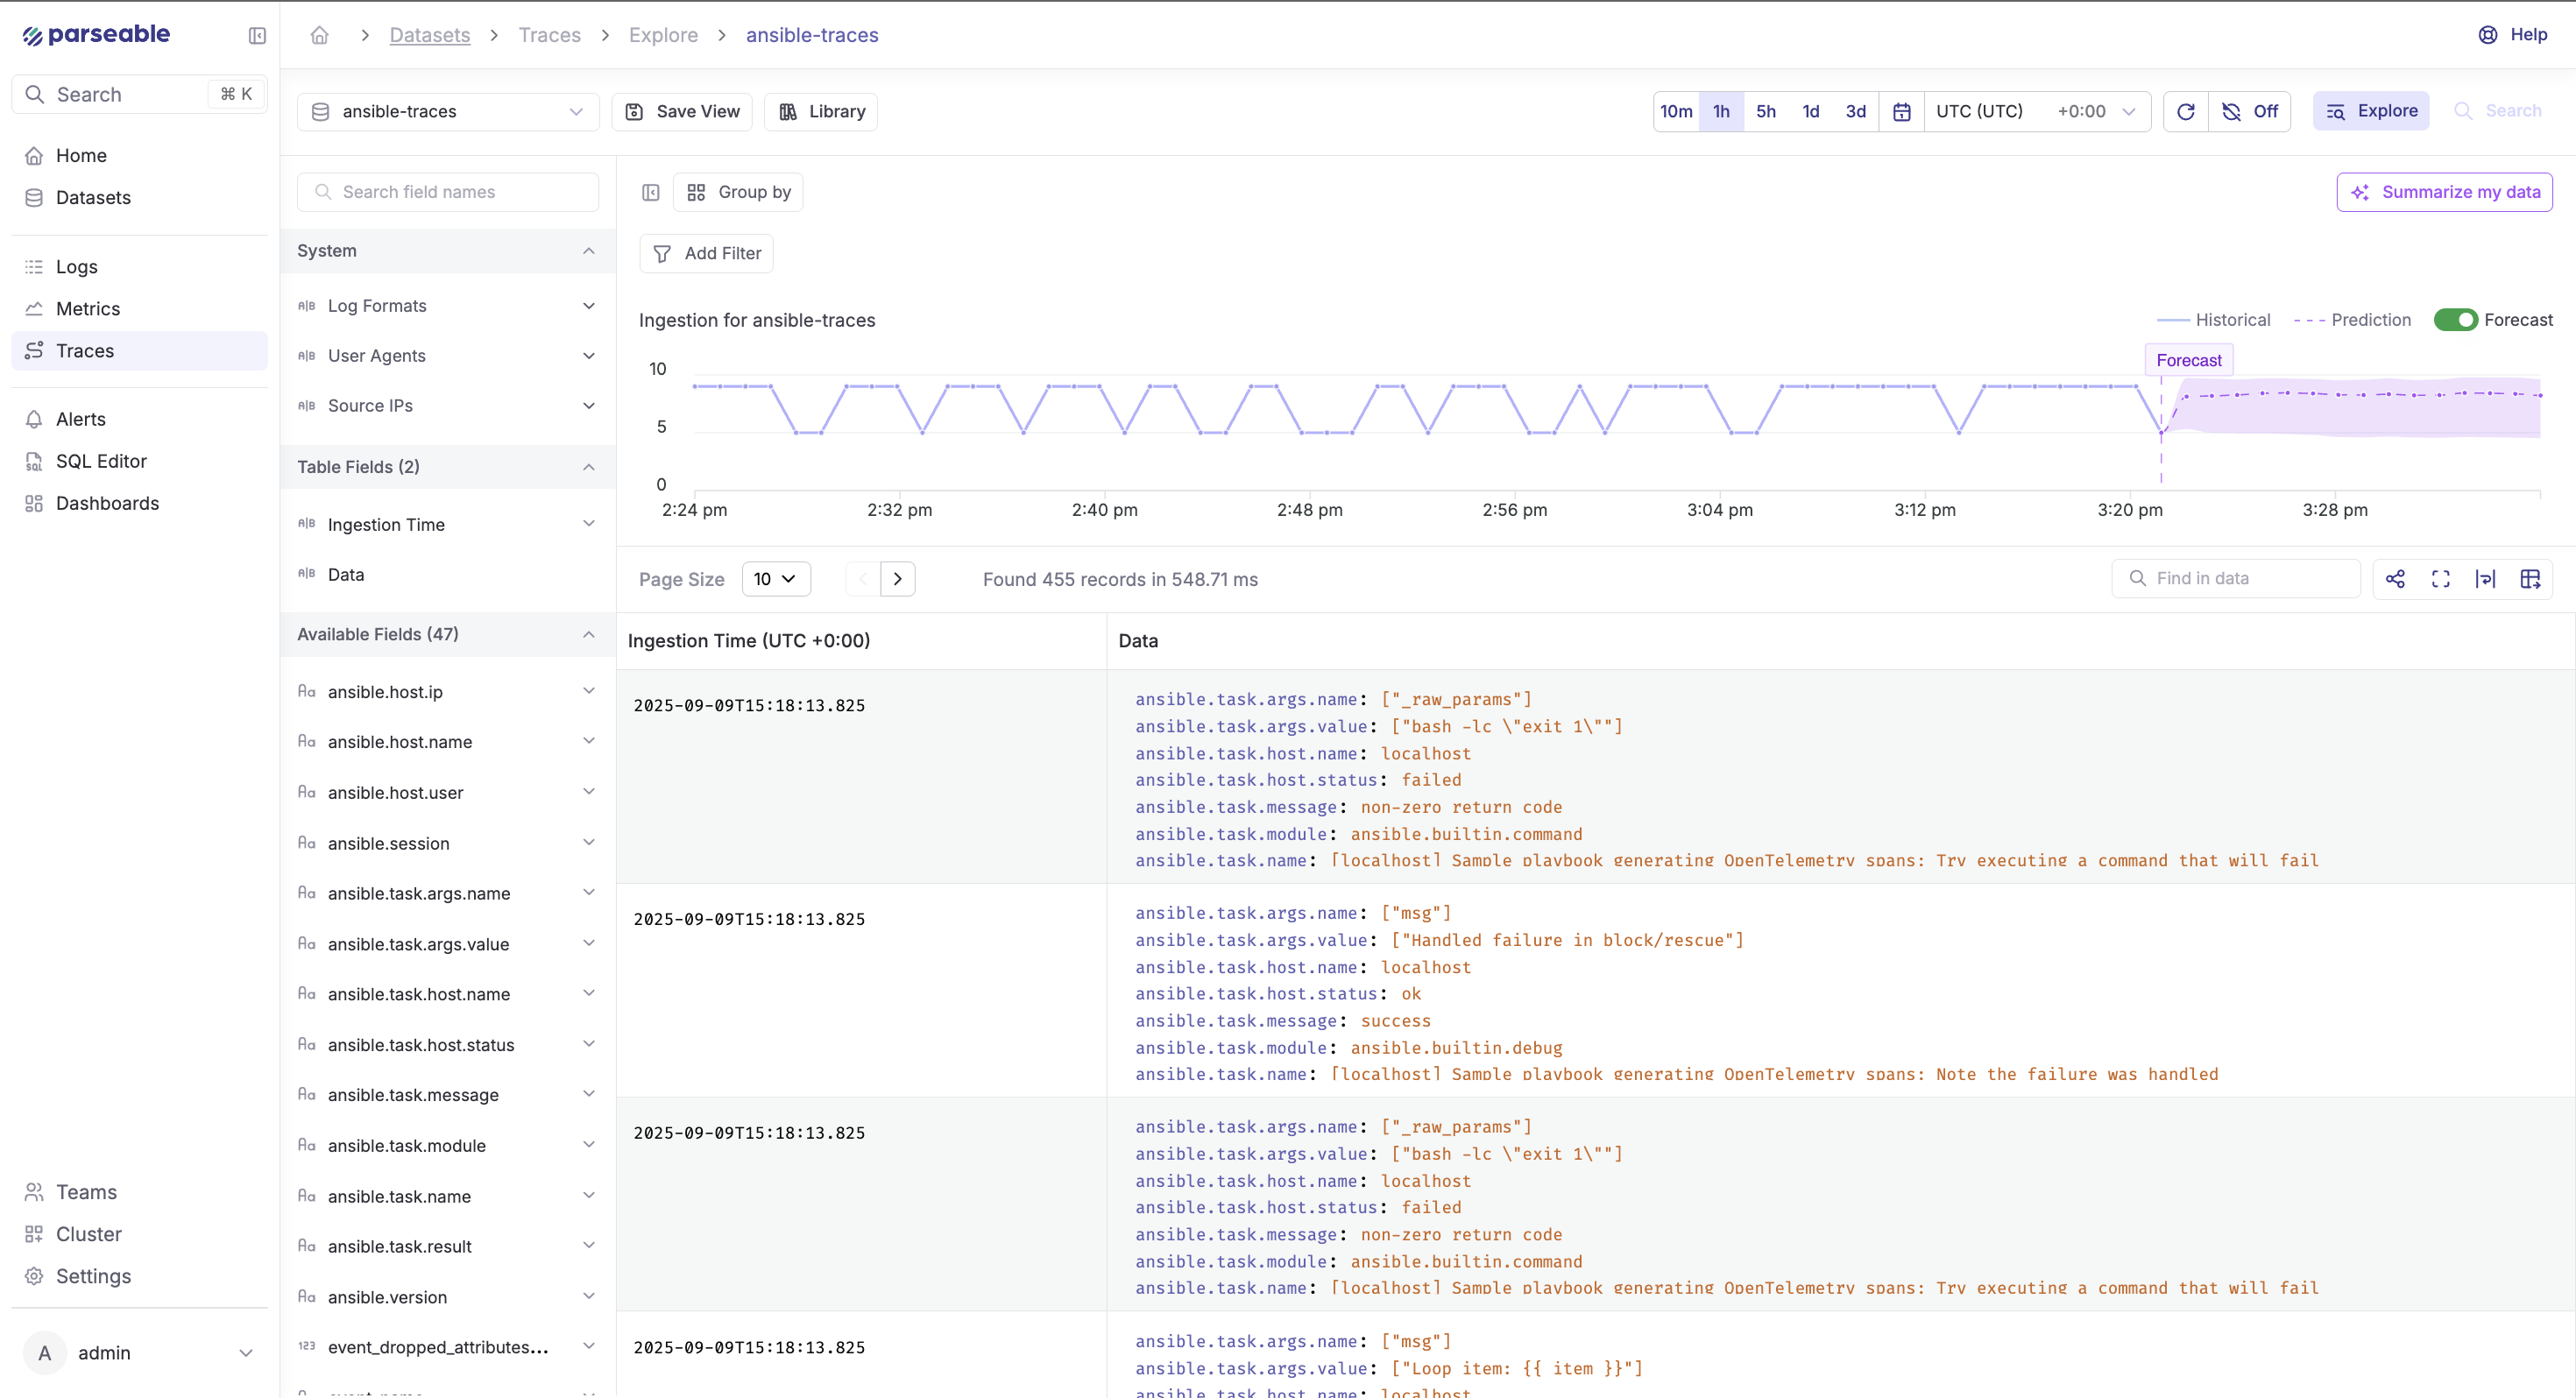
Logs in Parseable
Once telemetry starts flowing, the otel-logs stream in Parseable shows structured log records for every lifecycle event. Each record carries task.status, task.name, host.name, and a timestamp.
Useful filters to run immediately:
- Filter
task.status = "failed"to isolate all failed tasks across all recent runs - Group by
task.nameto see which tasks fail most frequently - Group by
host.nameto find hosts with higher failure rates - Compare two time windows side by side to identify regressions after a deployment
For log aggregation across multiple Ansible runners and hosts, the structured JSON format makes cross-host queries straightforward in SQL.
Traces in Parseable
The otel-traces stream shows one root span per playbook run, with child spans for each task. Each span carries start time, end time, duration, and the task attributes emitted by the callback.
What this makes practical:
- Sort tasks by duration to find the slowest step in a run
- Compare trace timelines across runs from the same day to find regressions
- Drill into a failed task's span to see which host it ran on and what attributes were set
- Attach enrichment attributes (
deployment.id,git.sha,team,env) at the Collector level so every trace carries CI/CD context without changing the playbook
Metrics in Parseable (optional)
Metrics are optional in this setup. The otel-metrics stream receives histograms, counters, and gauges if the callback plugin is extended to emit them. Out of the box, the demo plugin does not emit metrics — logs and traces cover most Ansible observability use cases.
If you add metrics, useful signals include:
- Histogram of task durations by module
- Counter of task failures per module type
- Gauge for concurrent playbook runs
- SLO tracking: percentage of playbook runs completing under a threshold
Keep metrics optional unless your team has a clear need for aggregate trend data beyond what logs and traces provide.
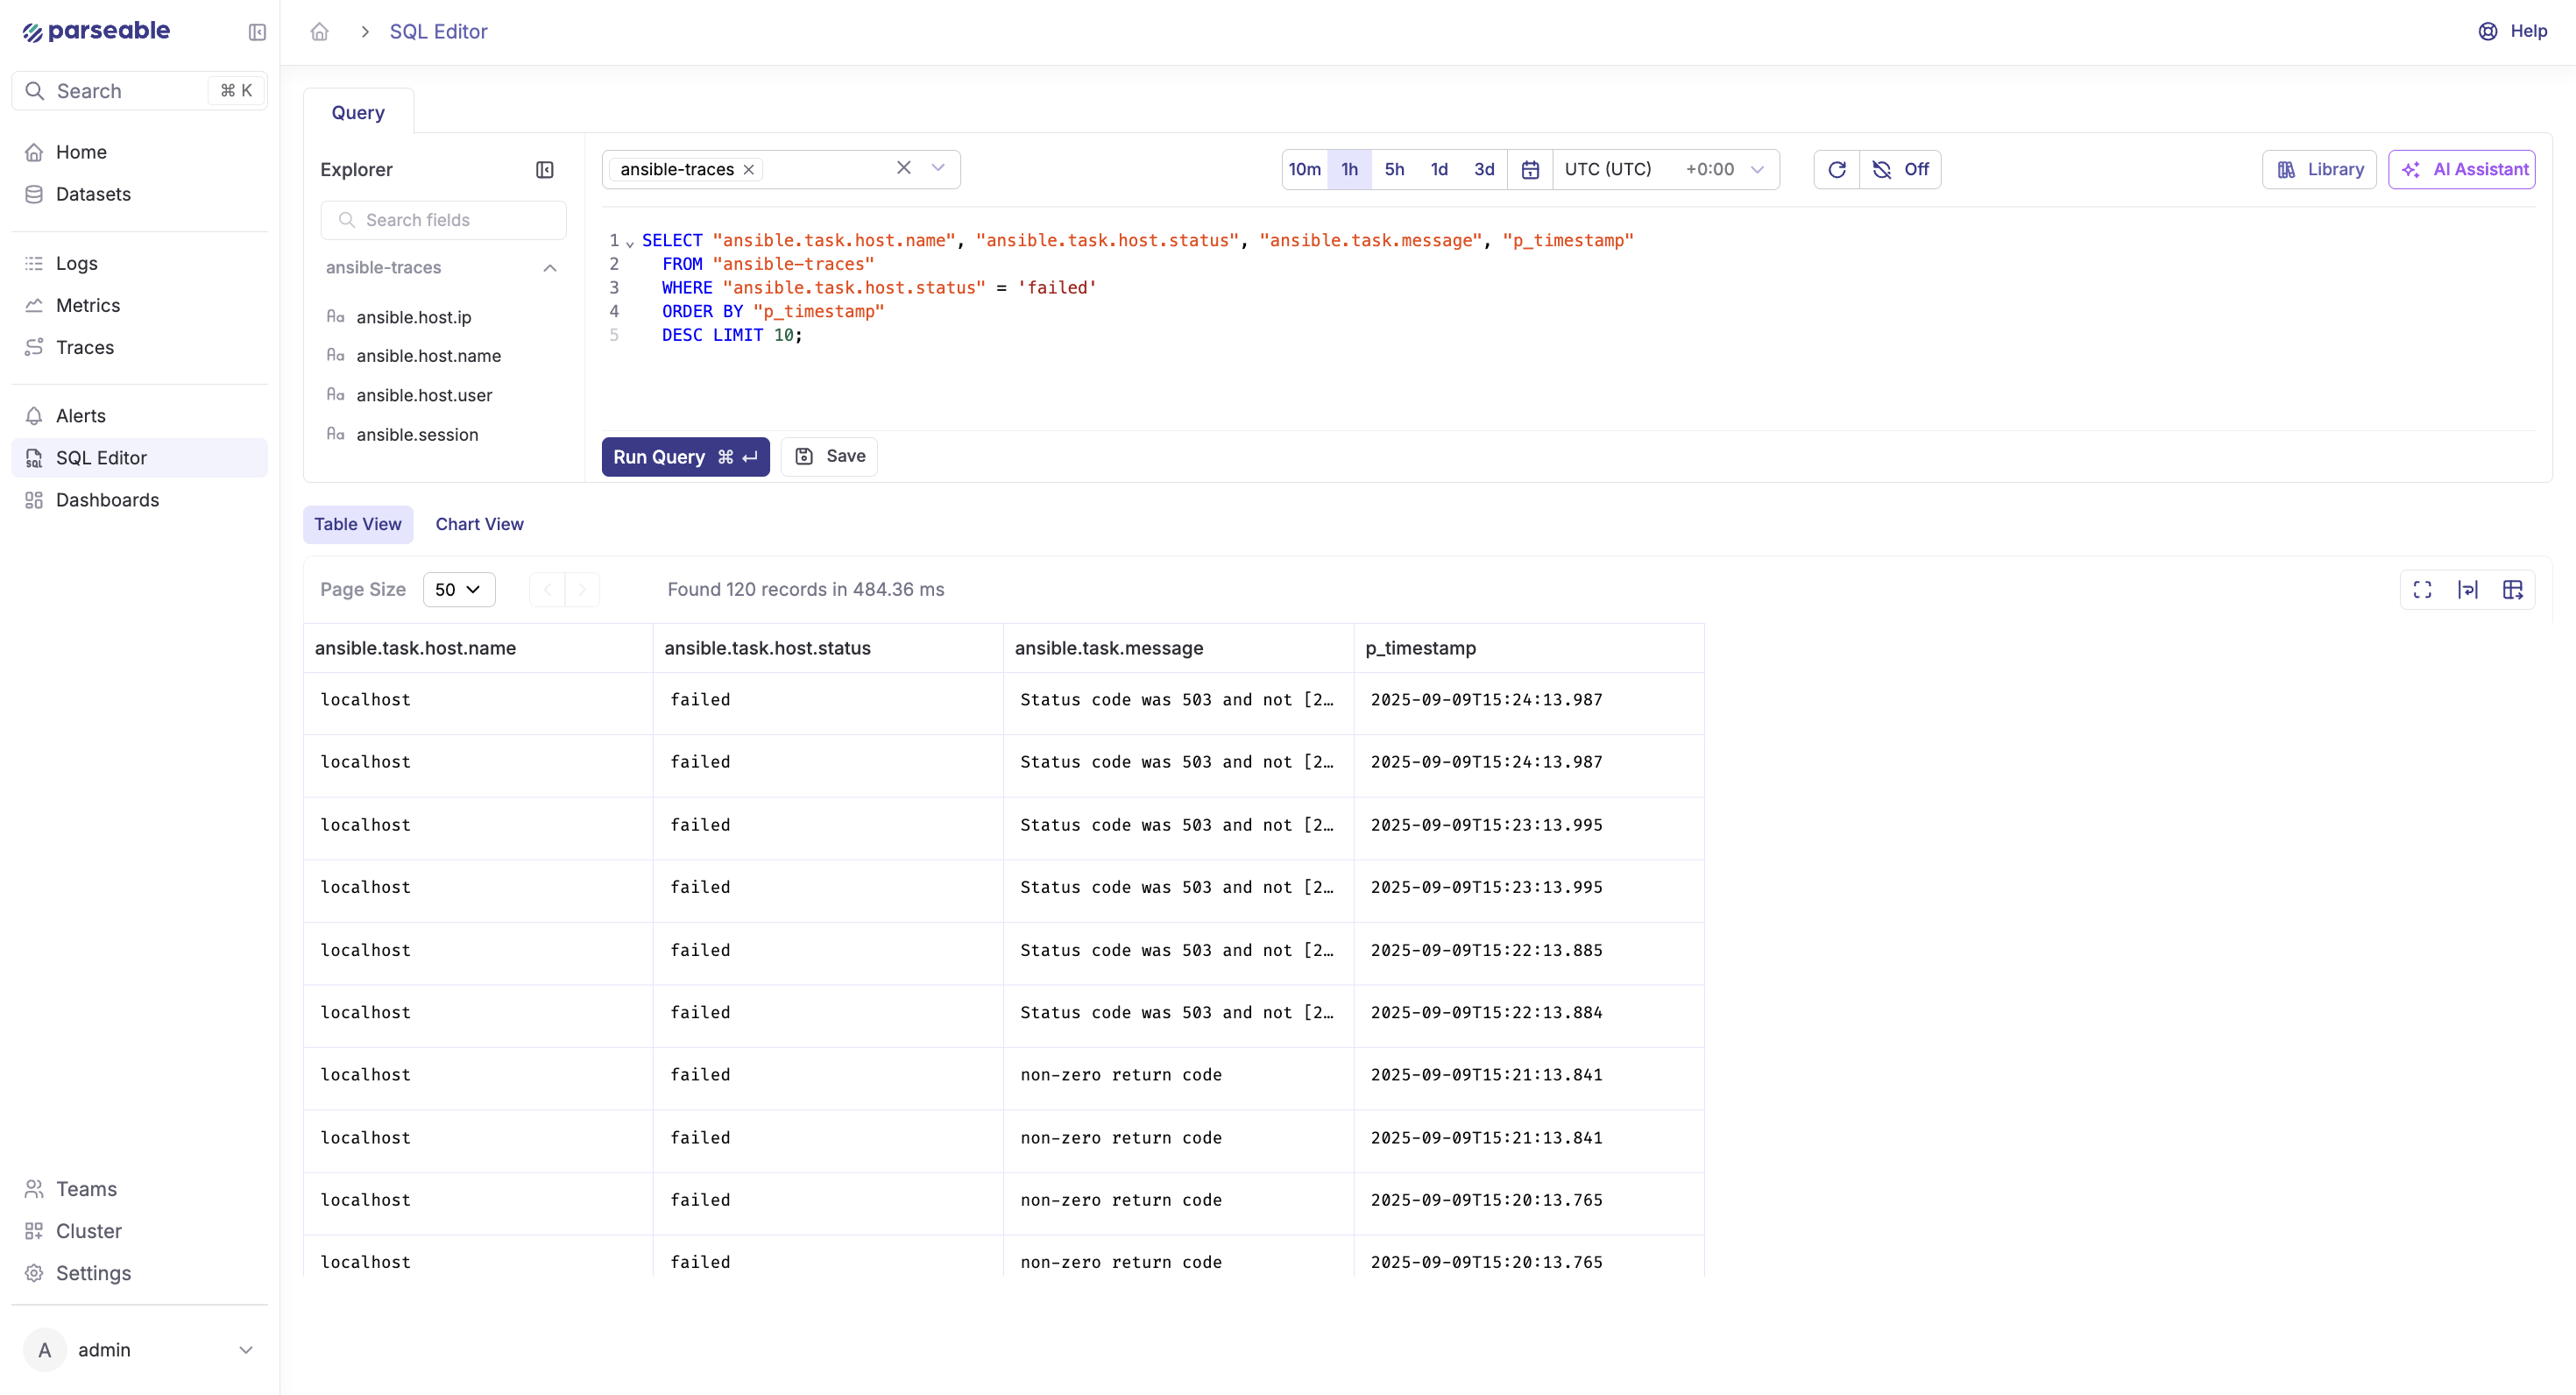
Query Ansible logs and traces with SQL
Parseable is SQL-first. Once telemetry lands in a stream, any standard SQL aggregate or filter works. Before running these queries, inspect your stream schema:
curl -X POST http://localhost:8000/api/v1/query \
  -H "Authorization: Basic YOUR_BASE64_AUTH" \
  -H "Content-Type: application/json" \
  -d '{"query": "SELECT * FROM \"otel-logs\" LIMIT 5", "startTime": "10m", "endTime": "now"}'
Use the actual field names from the response. The queries below use the attribute names emitted by the demo callback plugin.
Find failed Ansible tasks
SELECT
  p_timestamp,
  "task.name",
  "host.name",
  "task.action",
  "task.status"
FROM "otel-logs"
WHERE "task.status" = 'failed'
  AND p_timestamp >= now() - interval '24 hours'
ORDER BY p_timestamp DESC;
Find slowest tasks by host
SELECT
  "task.name",
  "host.name",
  avg(duration_ms) AS avg_duration_ms,
  max(duration_ms) AS max_duration_ms,
  count(*) AS run_count
FROM "otel-traces"
WHERE p_timestamp >= now() - interval '7 days'
GROUP BY "task.name", "host.name"
ORDER BY avg_duration_ms DESC
LIMIT 20;
Count failures by task name
SELECT
"task.name",
count(*) AS failure_count
FROM "otel-logs"
WHERE "task.status" = 'failed'
AND p_timestamp >= now() - interval '7 days'
GROUP BY "task.name"
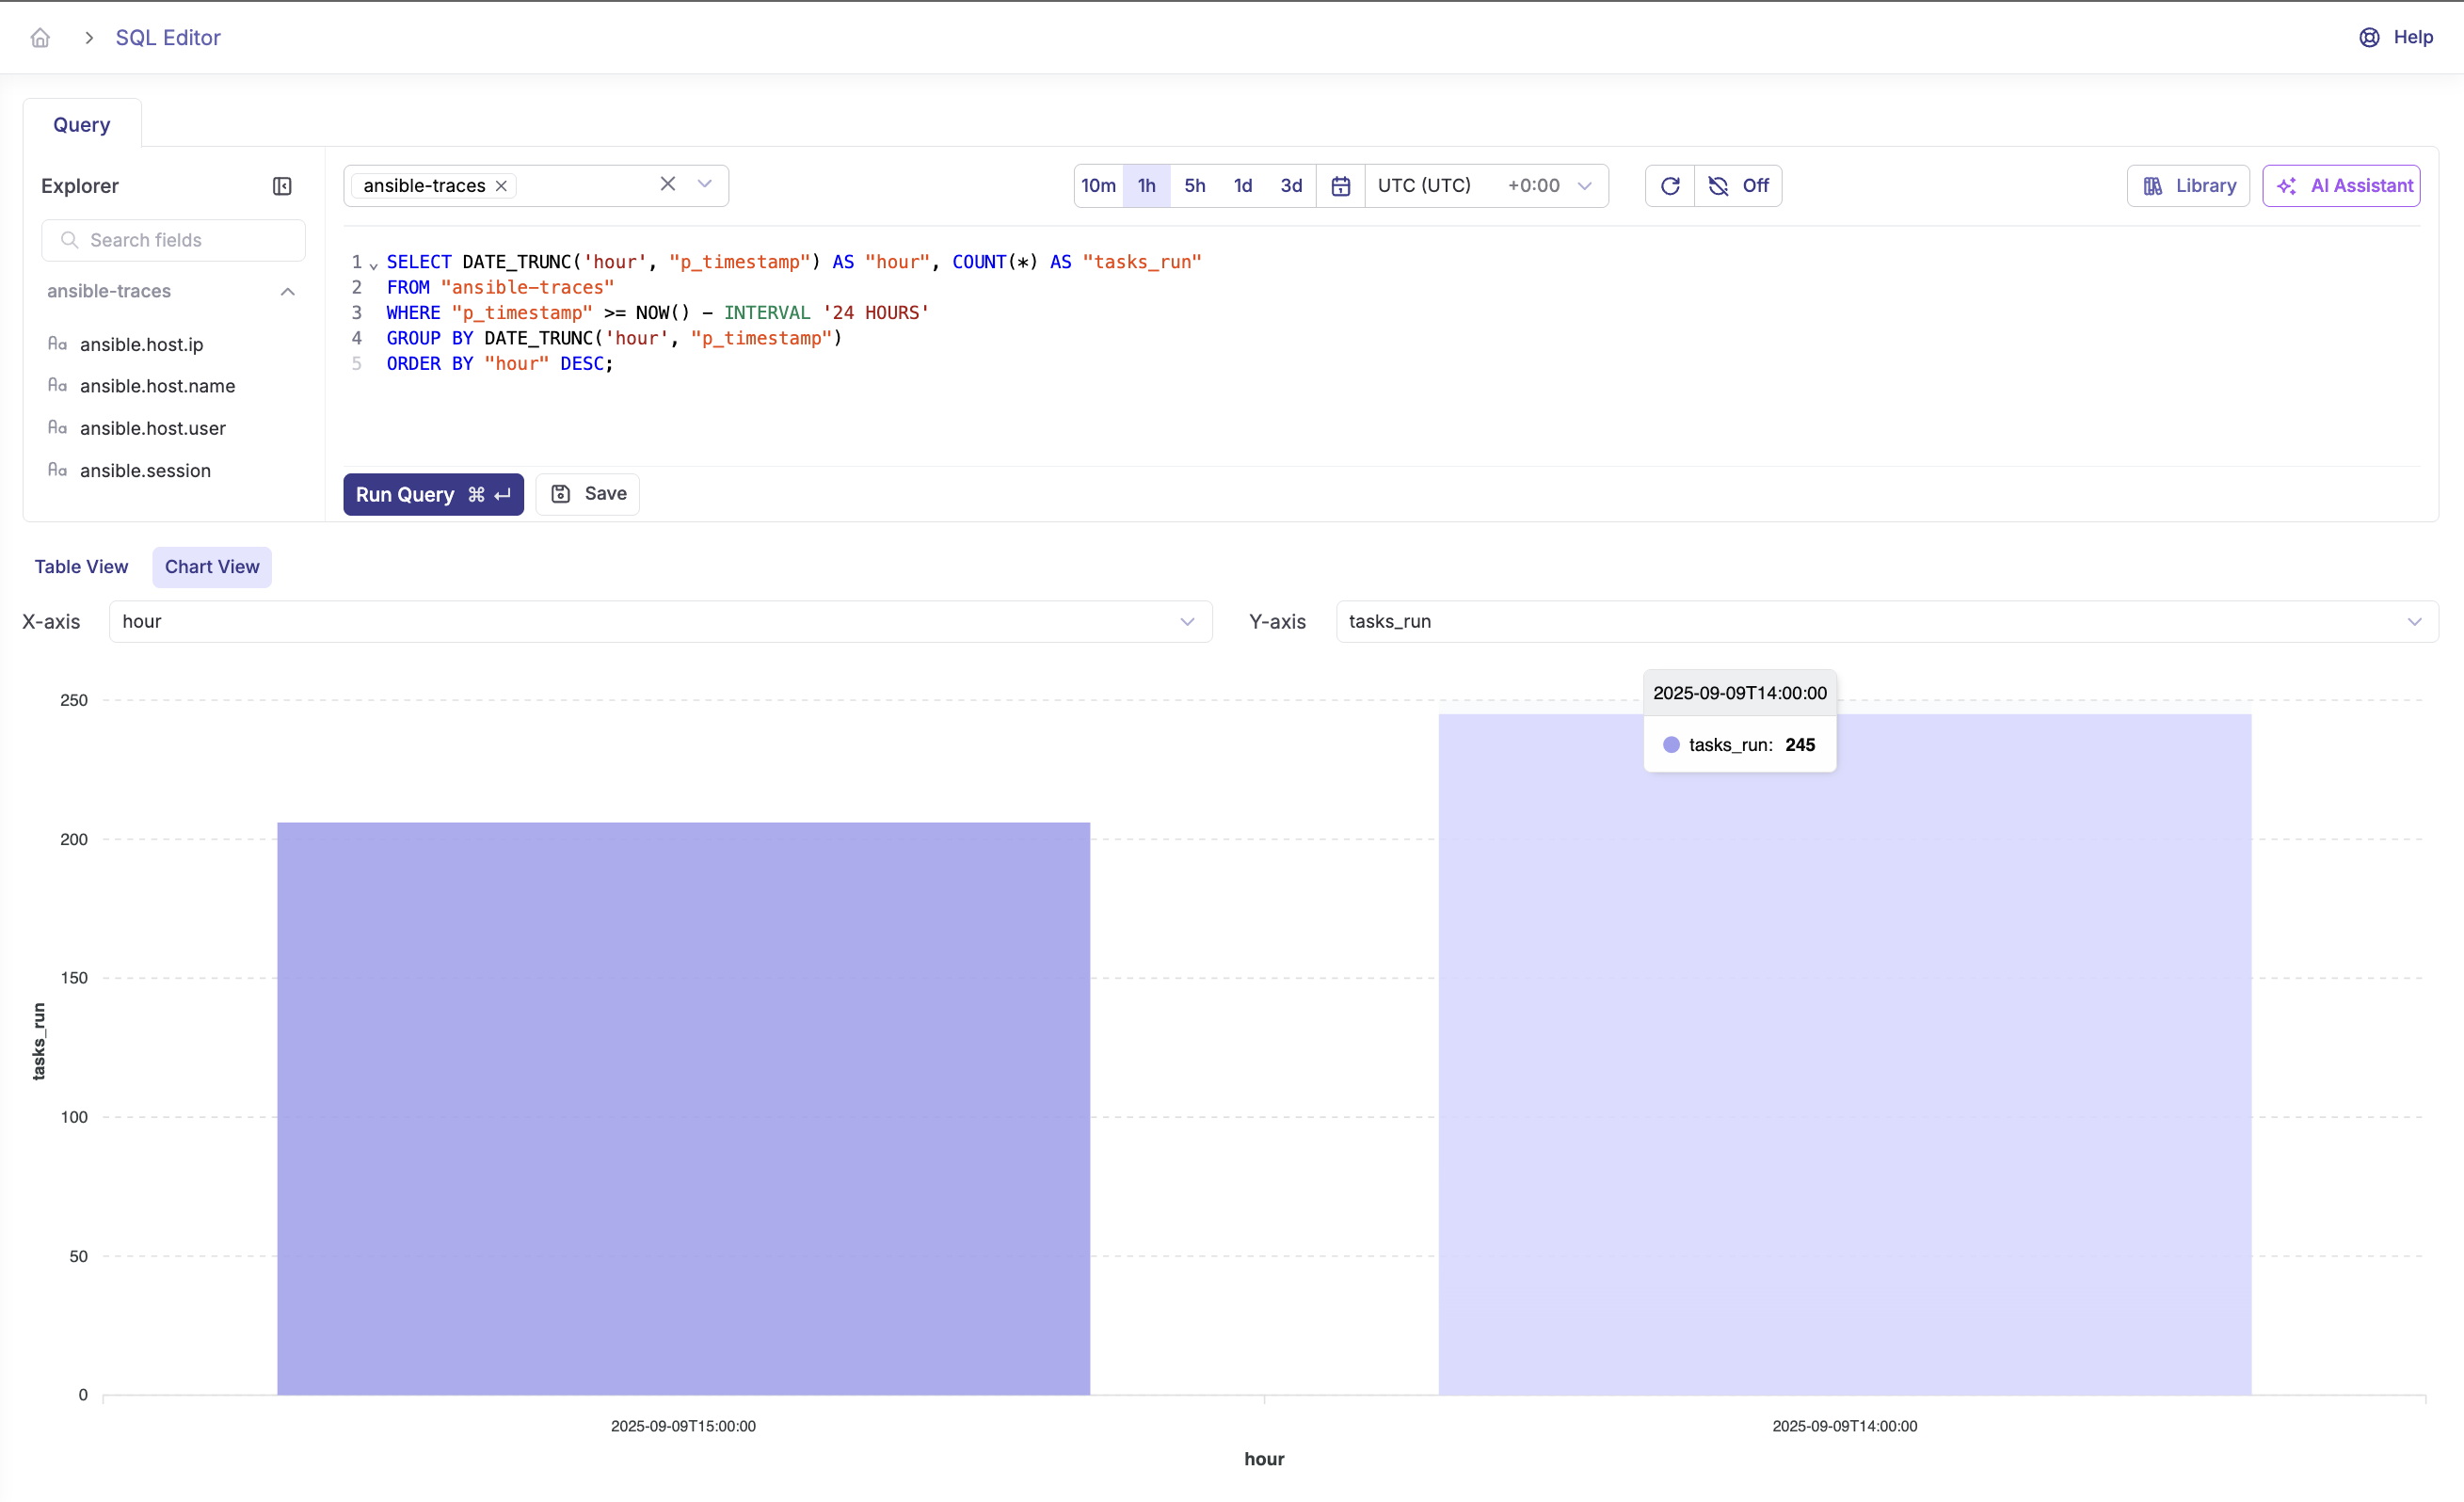
ORDER BY failure_count DESC;Compare playbook run duration over time
SELECT
  date_trunc('day', p_timestamp) AS run_day,
  "playbook.file",
  avg(duration_ms) AS avg_run_ms,
  max(duration_ms) AS max_run_ms,
  count(*) AS total_runs
FROM "otel-traces"
WHERE parent_span_id IS NULL
  AND p_timestamp >= now() - interval '14 days'
GROUP BY 1, 2
ORDER BY 1 DESC;
Find repeated failures after a deployment
SELECT
  "task.name",
  "host.name",
  count(*) AS failures,
  min(p_timestamp) AS first_failure,
  max(p_timestamp) AS last_failure
FROM "otel-logs"
WHERE "task.status" = 'failed'
  AND p_timestamp >= '2024-01-15T00:00:00Z'
GROUP BY "task.name", "host.name"
HAVING count(*) > 2
ORDER BY failures DESC;
Adapt field names to match your schema. The queries above use attribute names from the demo callback plugin. If you use a different plugin or a custom OTel exporter, inspect the stream schema first and update field names accordingly.
Summarize Ansible runs with Parseable AI
For longer playbook windows or noisy multi-host runs, Parseable's AI summarization converts a log or trace window into a structured summary without manual triage.
How to use it:
- Open the
otel-logsorotel-tracesstream in the Parseable UI - Set the time range for the window you want to summarize
- Click Summarize and select a model
- Review the generated summary
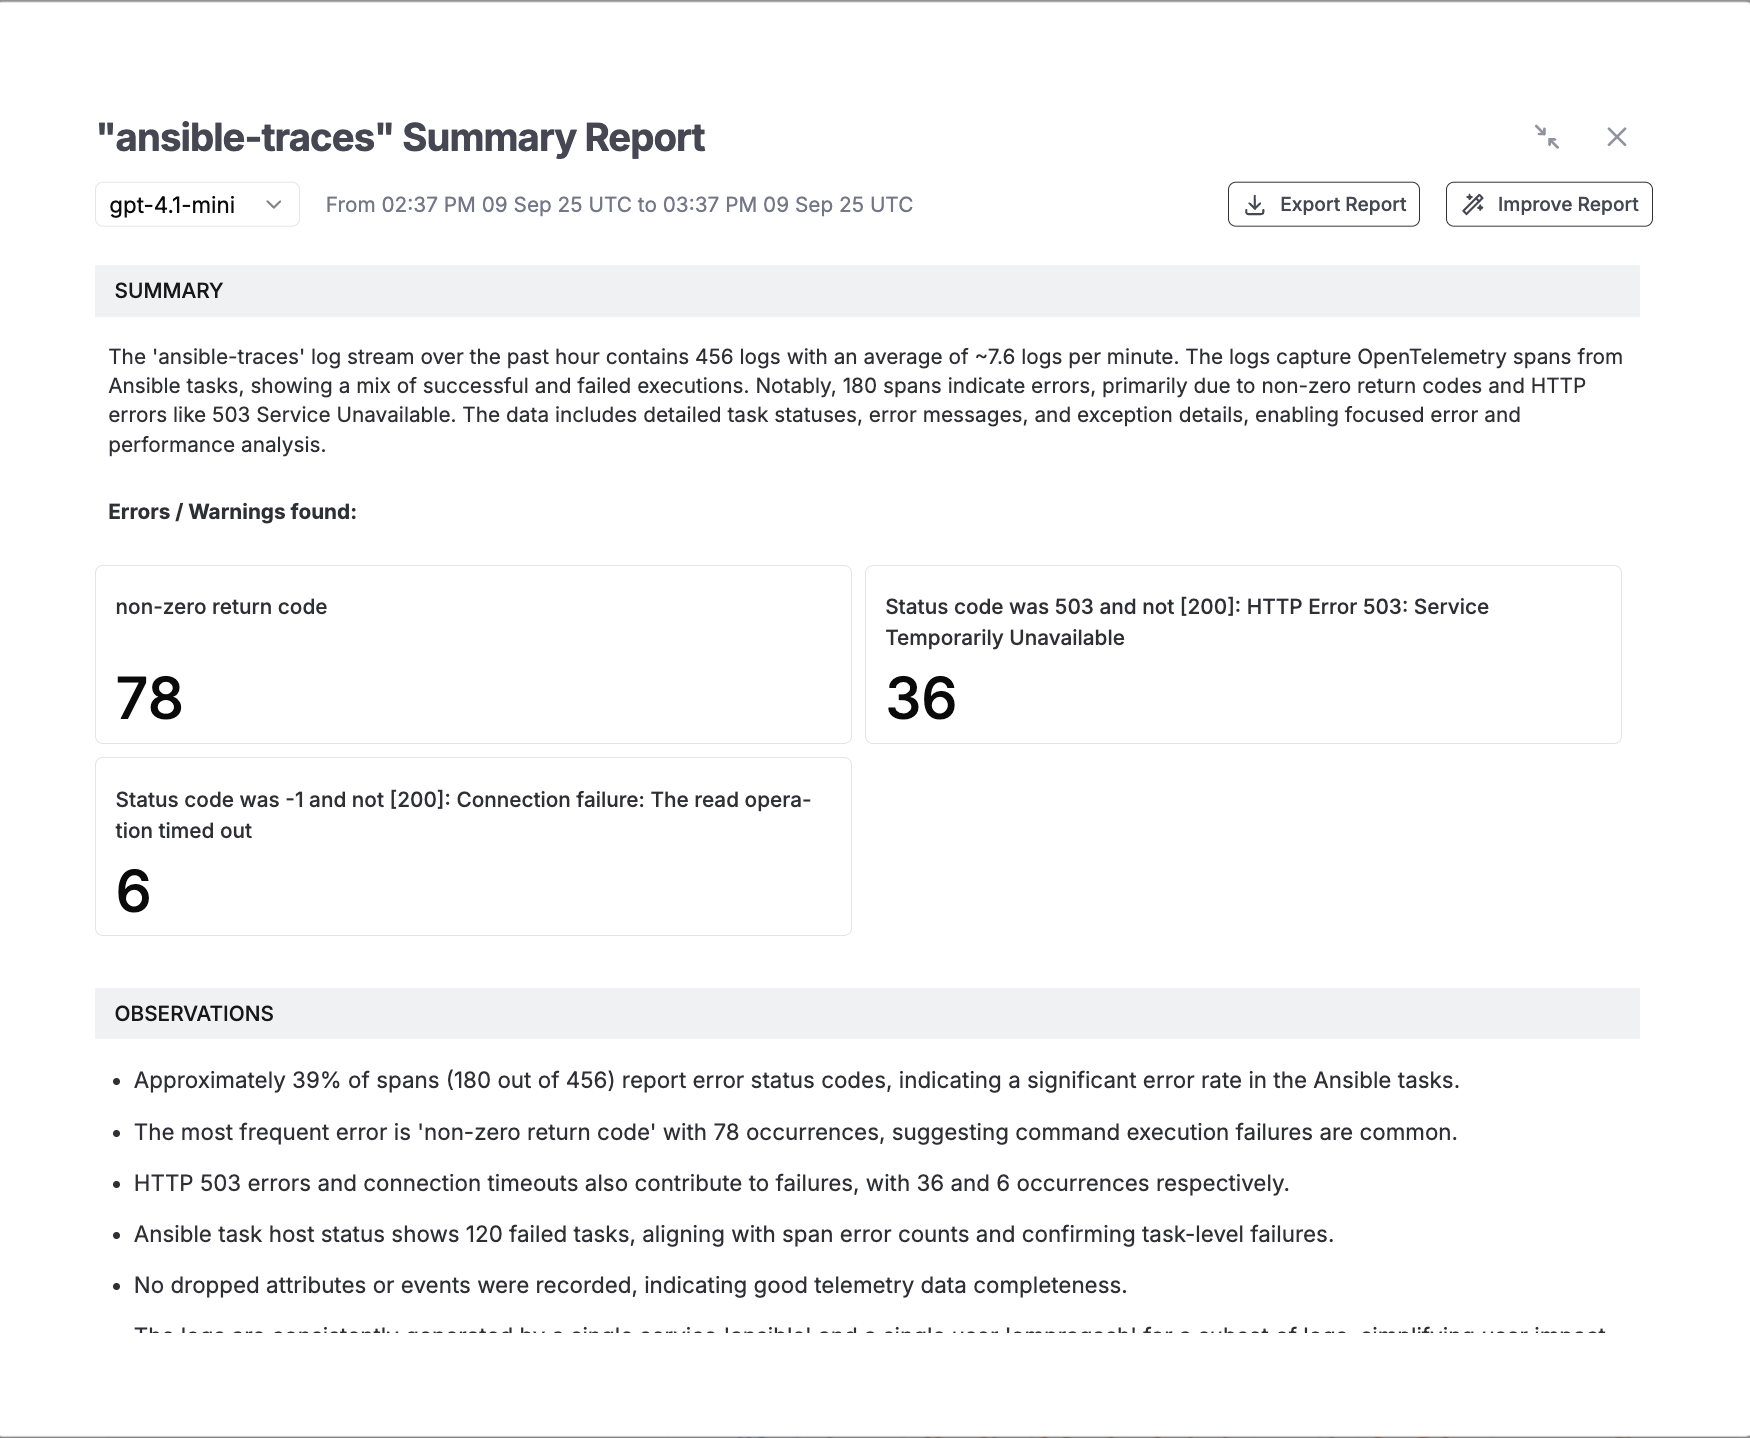
A typical summary covers:
- Total events processed with success and failure counts
- Aggregated error categories and affected tasks
- Duration trends and hotspot tasks
- Observations about patterns across hosts or runs
The summary can be exported or refined. This is useful for postmortem documentation, handoff notes after on-call incidents, or stakeholder reporting on automation reliability.
Advanced recipes
Richer resource context
Attach persistent attributes to all signals using the resource processor in the Collector config:
processors:
  resource:
    attributes:
      - key: service.name
        value: ansible-automation
        action: upsert
      - key: service.version
        value: "1.4.2"
        action: upsert
      - key: env
        value: production
        action: upsert
      - key: team
        value: platform
        action: upsert
These attributes appear on every span and log record, making cross-team or cross-environment filtering straightforward in Parseable.
Add CI/CD context
For playbooks triggered from CI/CD pipelines, pass pipeline metadata as environment variables and surface them as trace attributes:
OTEL_RESOURCE_ATTRIBUTES="git.sha=${GIT_SHA},pipeline.id=${CI_PIPELINE_ID},deployment.id=${DEPLOY_ID}" \
ansible-playbook -i inventory.ini site.yml
Useful CI/CD attributes to attach:
git.sha— commit that triggered the runpipeline.id— CI pipeline or job IDdeployment.id— deployment identifier for correlation with incident toolsenv— target environment (staging,production)team— team or squad that owns the playbookservice.version— version being deployed
With these attributes set, queries like "show all failed tasks in the deployment that went out at 14:32" become straightforward in Parseable.
Handle noisy runs
For playbooks with high task volume:
- Keep the
batchprocessor enabled — it reduces ingest pressure and smooths traffic spikes - Log at
INFOlevel for lifecycle events; only emitERRORlevel for task failures - If metrics volume is high, aggregate at the Collector using the
metricstransformprocessor before exporting
Troubleshooting Ansible observability setup
Port conflicts on 4318 or 4317
Check what is using the port:
lsof -i :4318Modify the port binding in compose.yaml if there is a conflict, and update the callback plugin's OTEL_EXPORTER_OTLP_TRACES_ENDPOINT environment variable to match.
No data in Parseable
- Confirm
.envvalues are correct — especiallyPARSEABLE_ENDPOINTandPARSEABLE_BASIC_AUTH_B64 - Verify the ingest path: the endpoint should end in
/api/v1/ingest - Re-generate the Base64 value with
echo -n 'user:pass' | base64and confirm there are no trailing newlines - Check Collector logs:
podman compose logs -f otel-collector
Collector health check
podman compose logs -f otel-collector
curl http://localhost:13133/healthz
Collector startup errors usually indicate a malformed config YAML or a missing environment variable.
Plugin not discovered
Confirm ansible.cfg has both lines:
callbacks_enabled = otel
callback_plugins = ./callback_plugins
Confirm callback_plugins/otel.py exists relative to where you run ansible-playbook. Run with -vvv to see which callbacks Ansible loads.
Callback runs but no traces appear
If the playbook runs without errors but nothing appears in Parseable:
- Confirm the callback plugin is loading:
ansible-playbook -vvvshould show callback initialization - Confirm the Collector is receiving:
podman compose logs -f otel-collectorshould show accepted spans - Check the
X-P-Streamheader in the exporter config — a wrong stream name will cause silent ingest failure in some configurations
Logs appear but trace context is missing
If otel-logs has records but otel-traces is empty:
- Confirm the traces pipeline is defined in
otel-config.yamlunderservice.pipelines - Confirm the callback plugin is sending to
/v1/traces, not only/v1/logs - Check
OTEL_EXPORTER_OTLP_TRACES_ENDPOINTis set and pointing to the Collector
Security hardening
For non-local deployments:
- Enable TLS on the Collector's OTLP HTTP endpoint
- Enable TLS for the Parseable connection in the exporter's
tlsblock (removeinsecure: true) - Rotate credentials and store them in a secret manager
- Do not embed credentials in playbooks,
ansible.cfg, or committed.envfiles
Why OpenTelemetry and Parseable work well for Ansible observability
Open standard, open pipeline
The Ansible callback plugin emits standard OTLP over HTTP. The Collector, Parseable, and the callback are independently replaceable. There is no proprietary agent, no custom SDK, and no vendor lock-in at the collection layer. If you need to add a second backend — a tracing UI, an alerting system — you add an exporter to the Collector config without touching Ansible.
One backend for all signals
Parseable stores logs, traces, and metrics in the same system. For Ansible playbook monitoring, this means a single SQL query can join log records with trace duration data — no context-switching between a log tool, a tracing UI, and a metrics dashboard. See OpenTelemetry Collector vs Fluent Bit for a comparison of collection approaches if you are evaluating the routing layer. For observability pricing and retention considerations, Parseable's model scales with actual ingest volume rather than host count.
Get started with Parseable for free and start observing your Ansible data.
SQL-first analysis
Parseable's query interface uses standard SQL. There is no query language to learn, no dashboard-specific expression format, and no limitation on what aggregations or joins are possible. For Ansible telemetry, this means any team member who knows SQL can write ad-hoc queries, build dashboards, or set up alert rules without platform-specific training.
Conclusion
Ansible does not have to feel like an opaque script runner. With the right Ansible observability setup — a callback plugin, an OpenTelemetry Collector, and Parseable as the backend — every playbook run becomes traceable, searchable, and auditable. Failures surface as structured records with task-level context. Slow tasks appear as outlier spans. Trends across runs become SQL queries. And when an incident requires a postmortem, the full event record is already there.
The setup in this guide is lightweight: a single callback plugin file, a Collector container, and Parseable. It does not require rewriting playbooks, deploying agents, or adopting a proprietary monitoring platform. The pipeline is vendor-neutral at the collection layer, and Parseable provides the SQL-first analysis and AI summarization layer on top.
For teams running Ansible at scale — multiple runners, multiple environments, CI/CD-triggered playbooks — this same pipeline extends naturally: add CI/CD context attributes at the Collector, route metrics separately, and use Parseable's alerting layer to catch failure rate spikes before they become incidents.

