

Most AWS teams start their observability journey with CloudWatch because it ships with the cloud. Eventually, as services grow, traffic increases, and the stack spreads beyond a single region or a single cloud, the conversation shifts. That is usually when datadog vs cloudwatch becomes a real evaluation rather than a hypothetical one.
The honest answer is that neither tool is universally better. Datadog is a broad SaaS observability platform built to cover everything from infrastructure to security. CloudWatch is AWS's native monitoring layer, tightly integrated with every AWS service you already pay for. The right pick depends on your infrastructure footprint, your budget tolerance, and how unified you need your observability to be.
This guide walks through how each tool actually behaves in production, where each one wins, where each one gets expensive or limiting, and which type of team should choose which. The next section starts with a side-by-side comparison.
Datadog vs CloudWatch at a glance
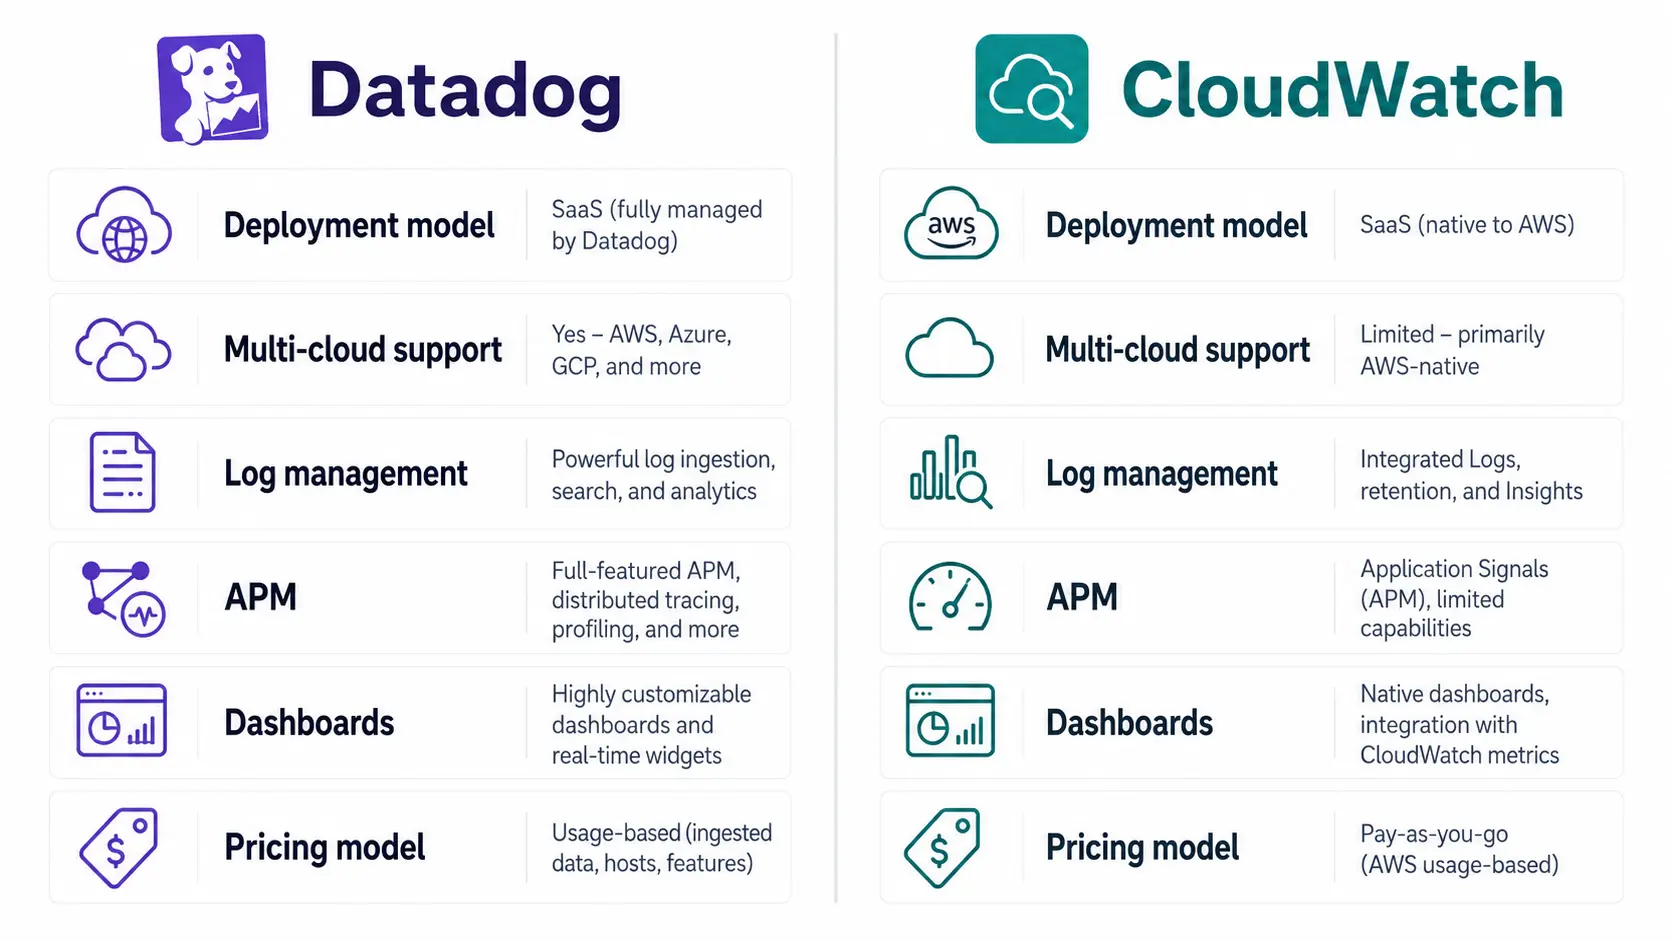
| Dimension | Datadog | CloudWatch |
|---|---|---|
| Best for | Multi-cloud and hybrid observability | AWS-native monitoring |
| Deployment model | SaaS | AWS-managed service |
| AWS-native monitoring | Strong via integrations | Native and deepest |
| Multi-cloud support | First-class for AWS, Azure, GCP, on-prem | AWS-only |
| Infrastructure monitoring | Broad, agent-based, 700+ integrations | AWS resources by default |
| Log management | Logs, Live Tail, Logging without Limits | CloudWatch Logs, Logs Insights |
| APM / tracing | Mature APM, distributed tracing, profiling | Limited, leans on X-Ray |
| Dashboards | Highly customizable, cross-signal | Functional, AWS-scoped |
| Alerting | Monitors, anomaly detection, composite alerts | Alarms, composite alarms, anomaly detection |
| Pricing model | Per-host, per-GB, per-product modules | Per metric, per log GB, per alarm, per API call |
| Ease of onboarding | Fast for multi-cloud, agent install required | Zero-touch for AWS resources |
| Best fit team | Mid-to-large teams across clouds | AWS-centric teams or AWS-first startups |
For teams comparing Datadog and CloudWatch, the biggest differences usually come down to cloud scope, pricing model, and how much unified observability they need beyond AWS-native monitoring.
What is Datadog?
Datadog is a SaaS observability platform that covers infrastructure monitoring, log management, APM and distributed tracing, real user monitoring, synthetic testing, security monitoring, and incident response in a single product family. It runs as a hosted service, with agents and integrations deployed across your environments.
The strength of Datadog is breadth. It treats AWS, Azure, GCP, Kubernetes, on-prem, and serverless as first-class environments. Teams running heterogeneous infrastructure tend to choose Datadog because one platform can correlate metrics, logs, and traces across every cloud they operate in.
Read Also: Top Datadog Alternatives
What is CloudWatch?
Amazon CloudWatch is AWS's native monitoring and observability service. It collects metrics from every AWS service automatically, stores logs through CloudWatch Logs, supports queries through Logs Insights, drives dashboards, and triggers alarms or anomaly detection on top of those signals.
CloudWatch is deeply integrated with the rest of AWS. EC2, Lambda, ECS, RDS, ALB, API Gateway, and most managed services emit metrics and logs into CloudWatch without configuration. That tight coupling is its biggest advantage and also its biggest constraint, since CloudWatch is built for AWS and stops short outside it.
The practical decision starts once teams move beyond the product definitions and compare how each tool handles real monitoring workflows.
Read Also: Top CloudWatch Alternatives
Looking for modern and radically cheaper logging than Datadog or CloudWatch? Try Parseable for free
Datadog vs CloudWatch: key differences
This is where the datadog vs cloudwatch decision gets concrete. The categories below are the ones that consistently shape buyer outcomes in real evaluations.
1. Infrastructure monitoring
CloudWatch wins on AWS-native simplicity. The moment you spin up an EC2 instance, an RDS cluster, or a Lambda function, baseline metrics show up in CloudWatch with no agent and no configuration. For pure AWS shops, this is hard to beat.
Datadog wins on breadth. Its agent and 700-plus integrations cover Kubernetes, containers, databases, message queues, third-party SaaS, and every major cloud. If your infrastructure spans more than AWS, or if you want deeper process-level visibility than CloudWatch exposes, Datadog gives you a single pane across all of it.
In practice, AWS-only teams rarely outgrow CloudWatch for infrastructure metrics. Teams that run anything outside AWS almost always supplement or replace it.
2. Log management
CloudWatch Logs handles ingestion and storage natively, and Logs Insights provides a purpose-built query language for searching them. It is reliable and integrates with every AWS service, but the developer experience around log analytics is functional rather than polished.
Datadog logs are built around the "Logging without Limits" model, which separates ingestion from indexing. You can stream large log volumes in, retain them inexpensively, and selectively index the slice you actually query against. The UI, faceted search, and pipelines are stronger than CloudWatch for day-to-day analysis.
The trade-off shows up at scale. Datadog log indexing can become a major line item, and CloudWatch Logs storage costs accumulate quietly across log groups. For high-volume log workloads, both tools start to feel expensive compared to modern log aggregation tools that decouple storage from compute.
When Datadog and CloudWatch both start to feel expensive for high-volume logs, teams often look for a more storage-efficient approach. Parseable is designed around that need, with SQL-based log analysis, built-in dashboards and alerts, and a unified observability model that keeps logs, metrics, and traces in one place.
3. Application performance monitoring
Datadog APM is the clear leader here. It offers distributed tracing, code-level profiling, service maps, deployment tracking, and tight correlation with logs and infrastructure metrics. For teams running microservices or polyglot stacks, this is a meaningful advantage.
CloudWatch does not ship a full APM product. AWS positions X-Ray, ADOT, and Application Signals to fill this gap, and they work well inside AWS, but the experience is more fragmented and less mature than Datadog's. For AWS-centric teams running a handful of services, this is usually good enough. For teams that live in their APM tool, it is not.
4. Dashboards and visualization
Datadog dashboards are flexible, fast, and designed to mix metrics, logs, traces, and events on the same panel. Template variables and cross-signal context make them well-suited to incident reviews and executive views alike.
CloudWatch dashboards are functional and have improved over the years, especially with cross-account and cross-region support. They are well-scoped for AWS resources but feel narrow when your data lives beyond AWS or when you want richer visual primitives.
5. Alerting and incident response
CloudWatch alarms are reliable, composable, and integrate natively with SNS, EventBridge, Auto Scaling, and Lambda. Anomaly detection is built in. For routine AWS infrastructure alerting, it is hard to fault.
Datadog goes further with monitor types, composite monitors, anomaly and forecast monitors, on-call routing through Datadog Incident Management, and tight integrations with PagerDuty, Slack, and Jira. For teams that want their alerting and incident workflow in one place, Datadog is the more complete option.
6. Onboarding and ease of use
CloudWatch has the shortest path to first signal: deploy something in AWS and metrics start flowing. There is no agent to install, no SaaS account to provision, and no separate billing relationship.
Datadog onboarding requires deploying an agent, connecting cloud integrations, and configuring log forwarding, but the payoff is faster time-to-value across non-AWS systems. For multi-cloud or Kubernetes-heavy environments, Datadog's onboarding is usually simpler than wiring CloudWatch alternatives together for each cloud.
7. Multi-cloud and hybrid support
This is the single category where the two tools are not in the same league.
CloudWatch is AWS-only. You can ship metrics from other sources via APIs and the embedded metric format, but it is not a multi-cloud platform and was never designed as one.
Datadog treats AWS, Azure, GCP, on-prem, and edge environments as first-class. For teams that operate across clouds, or for organizations that anticipate spanning more than one provider, Datadog is the structurally correct choice.
For teams that want broader visibility without the pricing structure of a full SaaS suite, this is also the point where platforms like Parseable enter the conversation, particularly when long retention and predictable cost matter as much as breadth.
Datadog vs CloudWatch pricing
Pricing is where the datadog vs cloudwatch decision often gets decided, and it deserves its own section because both tools price in ways that are easy to underestimate.
Datadog pricing model
Datadog uses a modular, usage-based pricing structure. Each product line bills separately: infrastructure per host, APM per host, log ingestion per GB, log indexing per million events, RUM per session, security monitoring per GB, and so on.
The model is transparent on paper but compounds quickly in practice. A team that starts with infrastructure monitoring at a moderate per-host rate often ends up paying for APM, logs, synthetics, and CSPM within twelve months. Custom metrics, containers above the included count, and high-cardinality tags all add billable surface area.
CloudWatch pricing model
CloudWatch pricing is granular: metrics per metric, log ingestion per GB, log storage per GB-month, Logs Insights queries per GB scanned, alarms per alarm, dashboards per dashboard above the free tier, API requests per request, and detailed monitoring as a paid upgrade.
The headline rates look modest, which is why CloudWatch is often dismissed as cheap. At scale, the bill is rarely small. High-cardinality custom metrics, large log groups with long retention, frequent Logs Insights queries, and cross-account observability all push costs higher than teams expect.
Which pricing model is easier to manage?
Neither model is genuinely predictable at scale.
CloudWatch is harder to forecast because the cost lives across many small SKUs that accumulate across accounts and services. Teams routinely discover surprise spend in custom metrics or large CloudWatch Logs groups that nobody pruned.
Datadog is easier to model per host but harder to control as product adoption grows. The marginal cost of adding a new Datadog product is small per host, but the total surface area of "everything turned on" gets large fast.
Teams that find Datadog expensive at scale and CloudWatch too fragmented across metrics, logs, alarms, retention, and querying often start looking for a more predictable architecture. That is where Parseable fits the conversation as a cost-efficient unified observability platform built on S3-native log analytics, which decouples storage from compute and changes the economics of long retention. Sign up for Parseable for free to try it with your own data.
When should you choose Datadog?
- Choose Datadog if you need broad multi-cloud or hybrid observability across AWS, Azure, GCP, and on-prem.
- Choose Datadog if you want strong APM, RUM, synthetics, and security monitoring inside one SaaS platform.
- Choose Datadog if your team values broad integrations and a polished UI more than strict cost control.
- Choose Datadog if you want consolidated alerting and incident response in the same tool as your telemetry.
- Choose Datadog if you have the budget headroom to let usage grow without re-architecting later.
When should you choose CloudWatch?
- Choose CloudWatch if your infrastructure is deeply AWS-centric and unlikely to leave AWS.
- Choose CloudWatch if you want native AWS monitoring with minimal added tooling and no third-party billing.
- Choose CloudWatch if your use case is mostly infrastructure metrics, logs, dashboards, and alarms inside AWS.
- Choose CloudWatch if staying in the AWS console and IAM model is a real operational advantage for your team.
- Choose CloudWatch if you want a baseline observability layer that does not require an agent rollout.
Where Datadog and CloudWatch both fall short
Once you push either tool hard, the same friction points show up regardless of which one you chose.
Storage and retention trade-offs
Datadog log retention is priced in tiers and gets expensive past 30 days. CloudWatch Logs retention is configurable, but storage at high volumes adds up across log groups, and you still pay to query that data through Logs Insights. Teams that need 90, 180, or 365 days of searchable logs for compliance or post-incident review run into real cost ceilings on both.
Log-heavy workloads and observability cost
For workloads that generate hundreds of gigabytes or terabytes of logs per day, the per-GB economics of both Datadog indexing and CloudWatch Logs become difficult to justify. Sampling helps but trades away exactly the data you usually need when you need it. This is the most common reason teams start evaluating modern logging tools.
Fragmentation across signals and workflows
CloudWatch fragments by service: Logs, Logs Insights, Metrics, Alarms, Synthetics, RUM, Application Signals, and X-Ray each have their own surface area inside the console. Datadog avoids that internally, but creates a different fragmentation: a separate SKU and pricing dimension per signal type. Either way, teams end up stitching workflows together.
Unified visibility without SaaS-heavy pricing
The hardest gap is structural. Datadog is unified but priced as a full SaaS suite. CloudWatch is reasonably priced per unit but is not a unified observability platform across all signals. Teams that want both, unified visibility and predictable cost, find themselves stuck between two trade-offs.
That gap is the reason platforms like Parseable exist. Parseable is built around an object-storage-first architecture, treats logs, metrics, and traces as queryable telemetry through SQL, and is designed for the high-volume, retention-heavy workloads where Datadog and CloudWatch both get expensive.
Sign up for Parseable for free and test it with your own data.
A modern alternative to Datadog and CloudWatch: Parseable
Parseable is not a like-for-like replacement for everything Datadog or CloudWatch do. It is a focused answer to the specific gaps the comparison above keeps surfacing: cost, retention, unified telemetry, and SQL-first querying.
Why Parseable fits this conversation
Parseable unifies logs, metrics, and traces into a single query surface. It is OpenTelemetry-native, which means you can ship telemetry through standard collectors like Grafana Alloy or the OpenTelemetry Collector without lock-in. Querying is SQL-based, which makes it familiar to anyone who has worked with a data warehouse or analytics tool.
The architectural choice that matters most is object storage. Parseable writes telemetry directly to S3 or compatible stores, separating storage from compute. That decision is what makes long retention economically reasonable, and it is what lets the platform scale linearly with data volume rather than per host.
When Parseable is the better fit
- Teams priced out of Datadog as log and APM usage scales.
- Teams outgrowing CloudWatch's AWS-only scope or fragmented per-service surface.
- Teams that need 90 to 365 days of searchable, queryable telemetry without painful storage bills.
- Teams running log-heavy or telemetry-heavy systems where ingest rates make per-GB SaaS pricing untenable.
- Teams that prefer SQL and open standards over proprietary query languages.
If any of those describe your situation, Signing up for Parseable's free trial is the right next step.
Final verdict: Datadog vs CloudWatch
If your infrastructure spans multiple clouds and you want polished, unified SaaS observability across infrastructure, APM, logs, RUM, and security, Datadog is the stronger choice. It is the most complete commercial platform on the market and its breadth pays off for mid-to-large teams.
If your infrastructure is AWS-centric and your monitoring needs map cleanly to metrics, logs, dashboards, and alarms inside AWS, CloudWatch is the stronger choice. It is native, well-integrated, and avoids adding a third-party billing relationship.
If your real requirement is cost-efficient unified observability with long-term telemetry scale, especially for log-heavy or retention-heavy workloads, Parseable is the stronger option. The datadog vs cloudwatch decision often ends in a third answer once teams look honestly at cost and retention at their actual volumes.

