

Observability starts at instrumentation. And the quality of instrumentation determines how fast your team can actually debug production issues. Poor instrumentation can look like either too much unusable information or too little information.
Thinking about how and what to instrument matters more now than it did two years ago. As vibe-coded applications ship faster with less human oversight, the gap between "code that runs" and "code you can understand in production" is widening. Instrumentation is the skill that closes that gap.
Before you instrument - you also need to decide what kind of telemetry to emit and how to store it. The industry has settled on three pillars of observability: logs, metrics, and traces. The premise is straightforward; if you have all three set up properly, you can debug and analyze issues across your application stack.
But this premise has a structural problem - the three pillar model scatters context across systems that you reassemble during incidents. Wide events assemble context once at write time.
What is a wide event?
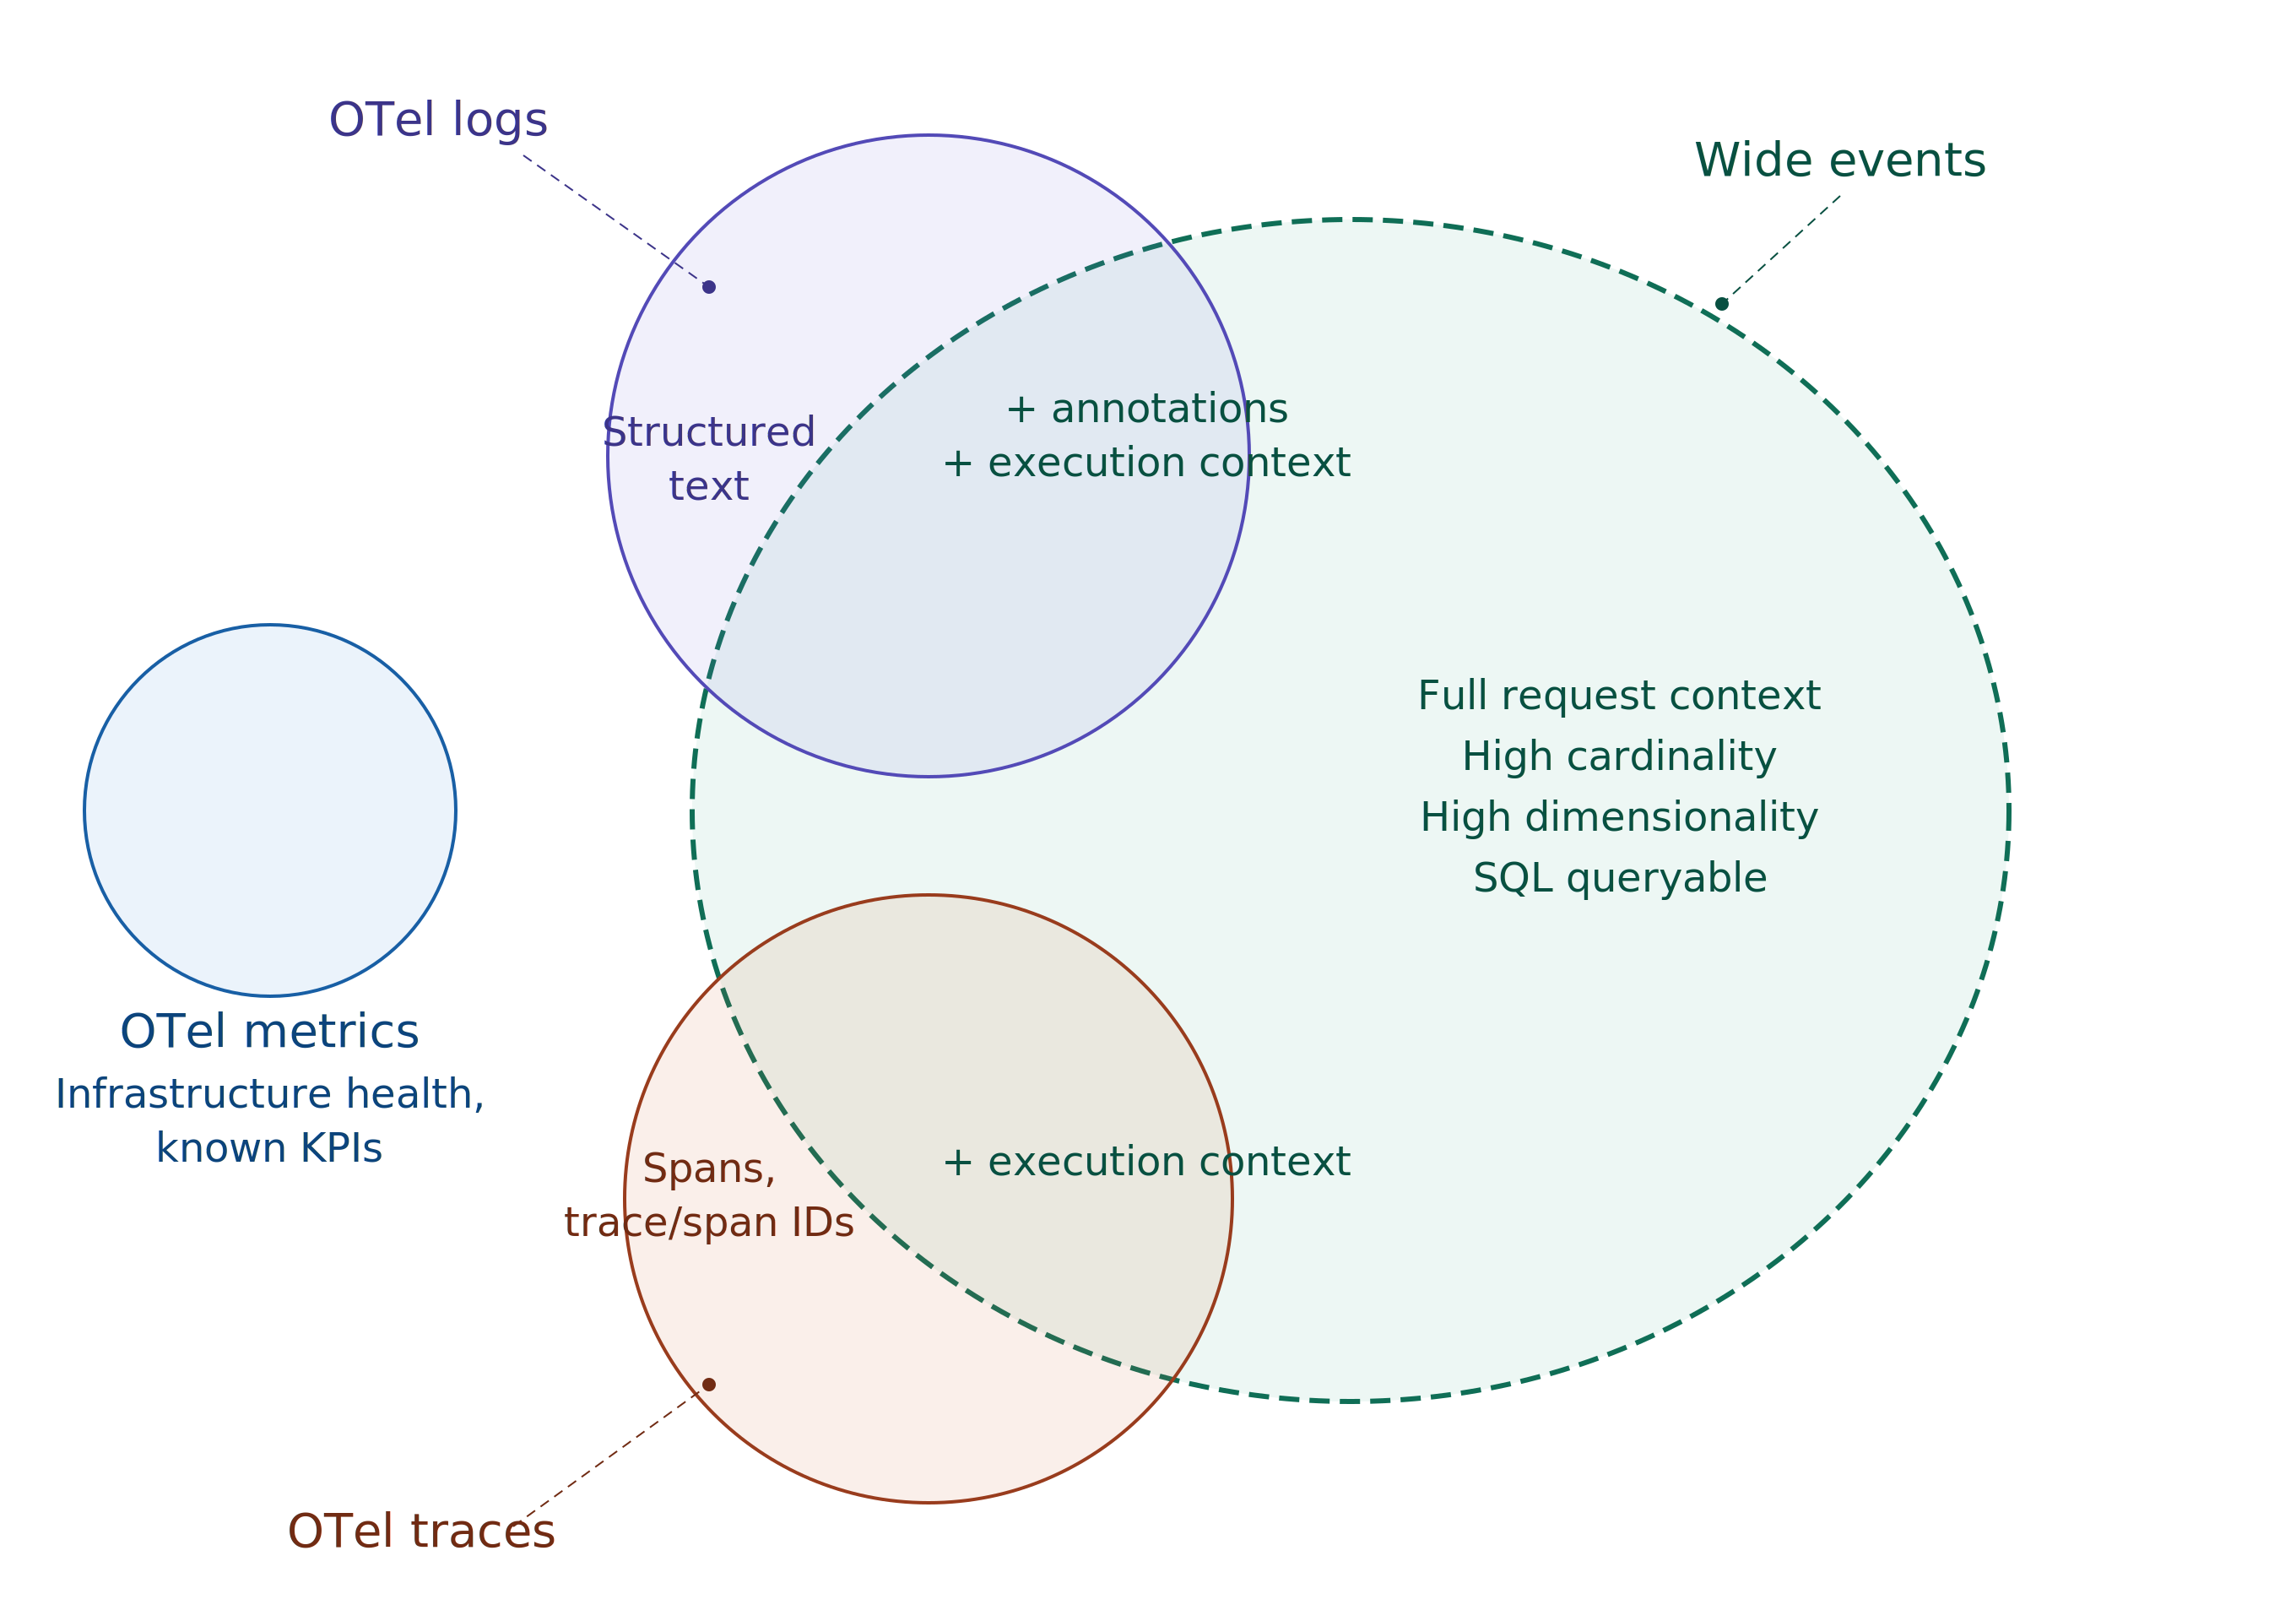
A wide event is a single structured event emitted once per request per service, packed with every dimension relevant to that execution — user context, infrastructure state, business logic, feature flags, cache behavior, database performance, all in one row.
Also worth noting here: Structured Logs ≠ Wide Events. All wide events are structured and they can be technically called structured logs, but the point of wide event is not just structure. There is much more to it.
Take for example, a SaaS application logging all the API calls it gets. Typical logs will look like this:
2026-05-08T14:32:10.656Z INFO  [checkout-service] Incoming request POST /api/v2/orders from 103.21.58.0
2026-05-08T14:32:10.657Z DEBUG [checkout-service] Authenticated user usr_8a7f2c via bearer token, org=org_4d91a
2026-05-08T14:32:10.968Z INFO  [checkout-service] Payment captured successfully via razorpay (289ms)
2026-05-08T14:32:10.969Z DEBUG [checkout-service] BEGIN transaction
2026-05-08T14:32:10.970Z DEBUG [checkout-service] INSERT INTO orders (user_id, org_id, total_cents, currency, coupon_code, payment_ref) VALUES (...) — 23ms, 1 row affected
2026-05-08T14:32:10.993Z DEBUG [checkout-service] INSERT INTO order_items (order_id, sku, qty, unit_price) VALUES (...) — 4ms, 3 rows affected
2026-05-08T14:32:10.997Z DEBUG [checkout-service] UPDATE inventory SET available_qty = available_qty - 1 WHERE sku IN ('sku_991a','sku_112b','sku_337c') — 6ms, 3 rows affected
2026-05-08T14:32:11.000Z DEBUG [checkout-service] COMMIT — 3ms
2026-05-08T14:32:11.001Z INFO  [checkout-service] Publishing event to order-events topic (840 bytes)
2026-05-08T14:32:11.002Z INFO  [checkout-service] Order ord_f8a21c created successfully for user usr_8a7f2c
2026-05-08T14:32:11.003Z INFO  [checkout-service] Response 201 POST /api/v2/orders — 347ms
Intersperse this with several other requests that the service would be going on in parallel on the server - and logs will look like this:
2026-05-08T14:32:10.651Z INFO  [api-gateway] Incoming request GET /api/v2/catalog?category=electronics from 72.14.201.12
2026-05-08T14:32:10.652Z INFO  [notification-service] Sending email to usr_3f1a9c — order confirmation ord_e7b19a
2026-05-08T14:32:10.654Z DEBUG [catalog-service] Cache HIT for catalog:electronics (redis, 1ms)
2026-05-08T14:32:10.656Z INFO  [checkout-service] Incoming request POST /api/v2/orders from 103.21.58.0
2026-05-08T14:32:10.656Z INFO  [api-gateway] Response 200 GET /api/v2/catalog?category=electronics — 5ms
2026-05-08T14:32:10.657Z DEBUG [checkout-service] Authenticated user usr_8a7f2c via bearer token, org=org_4d91a
2026-05-08T14:32:10.657Z WARN  [inventory-service] Low stock alert: sku_220d has 3 units remaining
2026-05-08T14:32:10.658Z INFO  [checkout-service] Processing order for user usr_8a7f2c, cart contains 3 items, total=14999 INR
2026-05-08T14:32:10.658Z INFO  [api-gateway] Incoming request GET /api/v2/orders/ord_e7b19a from 191.96.43.8
2026-05-08T14:32:10.659Z DEBUG [checkout-service] Applying coupon code LAUNCH20 — validating eligibility
2026-05-08T14:32:10.659Z DEBUG [order-service] Fetching order ord_e7b19a for user usr_3f1a9c
2026-05-08T14:32:10.660Z ERROR [notification-service] Failed to send email to usr_3f1a9c — SMTP timeout after 5000ms, retrying
Compare this with a highly dimensional wide event:
{
  "timestamp": "2026-05-08T14:32:11.003Z",
  "service": "checkout-service",
  "environment": "production",
  "region": "ap-south-1",
  "host": "checkout-7b4f9d-xk2m9",
  "build_hash": "a3f8c91",
  "deploy_id": "deploy-2026-05-08-1",

  "http.method": "POST",
  "http.route": "/api/v2/orders",
  "http.status_code": 201,
  "http.request_content_length": 1482,
  "http.response_content_length": 312,
  "http.user_agent": "Mozilla/5.0 (Linux; Android 15) AppleWebKit/537.36",
  "http.client_ip": "103.21.58.0",

  "duration_ms": 347,
  "time_to_first_byte_ms": 12,

  "user.id": "usr_8a7f2c",
  "user.plan": "pro",
  "user.org_id": "org_4d91a",
  "user.country": "IN",

  "feature_flags.new_checkout_flow": true,
  "feature_flags.stripe_v2": false,

  "cart.item_count": 3,
  "cart.total_cents": 14999,
  "cart.currency": "INR",
  "cart.coupon_applied": true,
  "cart.coupon_code": "LAUNCH20",

  "db.system": "postgresql",
  "db.operation": "INSERT",
  "db.statement": "INSERT INTO orders (...)",
  "db.duration_ms": 23,
  "db.rows_affected": 1,
  "db.pool.active_connections": 18,
  "db.pool.idle_connections": 7,

  "cache.hit": true,
  "cache.key": "inventory:sku_991a",
  "cache.backend": "redis",
  "cache.duration_ms": 2,

  "payment.provider": "razorpay",
  "payment.duration_ms": 289,
  "payment.status": "captured",
  "payment.retry_count": 0,

  "queue.published": true,
  "queue.topic": "order-events",
  "queue.message_size_bytes": 840,

  "error": false,
  "error.type": null,
  "error.message": null,

  "runtime.go.goroutines": 142,
  "runtime.go.heap_alloc_mb": 84,
  "runtime.go.gc_pause_ms": 1.2
}
Wide events bring structure to the otherwise chaotic telemetry data. The person (or agent) looking at this while debugging will have much better situational awareness, and they will know where to look next, sooner.
This is the promise of wide events. Situational awareness of what has happened is the most useful information you can give to someone debugging.
To summarize: in the traditional three pillar model, the user has to piece the context together from different signals at read time, while they are debugging. In the wide event model, context is injected at write time, saving effort during actual read / debugging time.
Clearly, wide events win here right? Well, it depends. Adding context at write time means additional development effort during instrumentation. So, there is a trade off to be made here.
Important to understand here is that pillars of observability and wide events are different paradigms. So concepts overlap and sometimes there is no clean 1:1 mapping. With this in mind, let's build a mental model around the trade offs and decision framework.
How do wide events compare to metrics?
Think of metrics like vitals in a human body. Metrics tell you whether the system is alive, healthy and responsive. Because of their deterministic nature, metrics work best as dashboards data points, alert triggers and the starting point of any debugging flow.
The limitation of metrics shows up when the question is unpredictable. Metrics can tell you that p99 latency spiked on the checkout endpoint. They can't tell you that the spike only affects pro-plan users in the US, on Android, with a coupon applied, when the new checkout flow feature flag is enabled.
This is where wide events take over. Wide events are the right answer when you need to group-by your way to a root cause that is otherwise hard to predict. They carry enough dimensionality to slice across user attributes, feature flags, infrastructure state and business logic in a single query.
The framework here is straightforward. Metrics and wide events serve complementary use cases. Choose metrics for infrastructure health and known application KPIs — the signals you can enumerate in advance. Wide events should cover application behavior, starting from the most obvious debugging bottlenecks — the critical paths where incidents cost the most time.
In terms of development and storage cost, wide events have the additional cost of more cardinality and dimensionality. Wide events also take longer to instrument in terms of pure effort spent. But they're more effective at investigative debugging.
How do wide events compare to traces?
Traces give you the waterfall; a visual map of how a request moved across services, which service was slow, and where errors occurred. That's useful, but a standard OTel trace span carries limited context. For the same checkout request, a typical span captures around 13 fields: HTTP method, route, status code, duration, service name. It tells you a POST to /api/v2/orders returned 201 in 347ms.
Wide events are technically a superset of standard OTel trace. Add trace_id, span_id and parent_span_id to your wide events, and you can reconstruct the waterfall view with a simple query: filter by trace_id, sort by timestamp, follow the parent-child relationships.
Because the data is in a single queryable store, you can ask questions that no tracing UI supports natively — "across all traces in the last hour, which payment provider had the highest p99 for pro-plan users in India?" No span-hopping across a tracing UI to manually reconstruct context that should have been there from the start.
The cost consideration
Cost is the most common objection to wide events, and it's valid. High cardinality fields like user IDs, session tokens and request paths combined with high dimensionality means significantly more data per request than any of the three pillars individually.
But the cost problem is often mis-attributed to the telemetry type. Wide events aren't inherently expensive, it's the storage architecture underneath that makes it expensive.
Most observability vendors price on ingestion volume. Per GB pricing models punish high dimensionality data by design and cardinality limits exist because the vendor's storage engine can't handle it efficiently.
The economics change when the storage layer is built for this data shape. Columnar formats like Apache Parquet exploit the structure of wide events — fields that repeat across events (service name, environment, region, build hash) compress via dictionary encoding to near-zero cost. Even high-cardinality fields compress well because per-column strategies adapt to each field's actual distribution.
To put this in perspective, a real Parseable deployment handling metrics ingestion at scale — ~700 TiB ingested, stored in 6.8 TiB. That's 99.11% compression, achieved through columnar storage on object storage (S3 compatible backends). Columnar approach with modern cloud native architecture makes wide events economically viable. With SQL as the query interface, teams can run the investigations that wide events are built for.
The industry doesn't need to choose between the debugging power of wide events and reasonable infrastructure costs. It needs storage engines that are purpose built for high cardinality & dimensionality data — and the compression model matches the data model.
The decision matrix
The choice between metrics, traditional logs, traces and wide events comes down to what you're monitoring, what questions you need to answer, how much debugging context you need at query time and how much effort you're willing to put in instrumentation.
Pull it all together into a clean framework:
| Metrics | Logs | Traces | Wide Events | |
|---|---|---|---|---|
| Best for | Infrastructure health, known KPIs | Application output, audit trails | Request flow across services | Investigative debugging, unknown unknowns |
| Question type | Predictable, enumerable in advance | Freeform, but low dimensionality | "Show me the lifetime flow of this request" | Unpredictable, high dimensionality |
| Context per signal | 1-5 labels | Whatever the developer printed | 10-15 span attributes | 40-100 dimensions |
| Cardinality | Medium to high | Medium | Medium | High |
| Instrumentation effort | Low | Low | Medium (SDK + propagation) | High (deliberate enrichment) |
| Storage cost | Very low (sub-byte per sample) | Medium to high | Medium | High on SaaS, low on columnar/object storage |
| Query pattern | PromQL, time-series | Grep, full-text search | Trace ID lookup, waterfall | SQL — GROUP BY, filter, aggregate across any dimension |
| Debugging power | Points you in a direction | Shows what happened in one place | Shows how a request moved | Tells you exactly what went wrong and why |
None of these signals are a complete replacement for the others. Metrics remain the right starting point for infrastructure monitoring and alerting. Logs still have a role for audit trails and application output where high dimensionality isn't needed. Traces give you the service to service request flow.
Wide events cover quite a bit of what logs and traces cover, and for the hard problems where investigative debugging is the only way — wide events are your best bet. However, they come at a cost of additional instrumentation effort.
Start with your most critical service, instrument it with wide events, store them in a columnar engine with SQL support, and expand from there.

