

Modern systems emit far more telemetry than they did five years ago. A single Kubernetes cluster can generate millions of unique label combinations in a day. A payments API serving thousands of merchants pushes a steady stream of user IDs, request IDs, route templates, and tenant identifiers into logs, metrics, and traces. This is what makes debugging tractable. It is also what makes High Cardinality the most expensive and most misunderstood property in observability.
When engineers talk about cardinality problems, they are usually describing a symptom: a dashboard that takes 40 seconds to load, a Prometheus instance that runs out of memory after a deploy, a billing surprise from a vendor priced on active series. The underlying cause is almost always the same. Detailed telemetry is being stored in systems that were not designed to handle high-cardinality data at scale.
This guide is a practical, developer-focused walkthrough of what High Cardinality is, where it shows up across metrics, logs, and traces, why it explodes, when it is useful, and how to design or choose a platform that can keep up. It is meant for engineers who have already hit the wall and want a clearer mental model and a sharper set of trade-offs.
What is high cardinality?
Cardinality is the number of unique values a field can take. If a field has 5 possible values, its cardinality is 5. If it has 50 million possible values, its cardinality is 50 million.
High cardinality means a field, label, dimension, or attribute can take a very large number of distinct values, often thousands or millions. The exact threshold is fuzzy, but the practical definition is simpler: a field is high cardinality when its uniqueness starts to stress the storage, indexing, or query layer of the system that holds it.
A few concrete examples:
status_codehas roughly 60 valid HTTP values. Low cardinality.regionin a typical deployment is a small enumeration. Low cardinality.user_idfor a SaaS product can easily be in the millions. High cardinality.trace_idis unique per request by definition. Extreme cardinality.pod_namein a churning Kubernetes cluster grows continuously over time. High cardinality with churn, which is worse.
A simple example of high cardinality
| Field | Sample values | Approx. unique values | Cardinality |
|---|---|---|---|
http_method | GET, POST, PUT, DELETE | 7 | Low |
status_code | 200, 404, 500 | ~60 | Low |
region | us-east-1, eu-west-2 | ~30 | Low |
service | checkout, billing, auth | ~100 | Low to medium |
customer_tier | free, pro, enterprise | 3 | Low |
user_id | u_8e91, u_2a44 | 1M+ | High |
trace_id | 4bf92f3577b34da6a3ce929d... | per request | Extreme |
pod_name | api-7d9bc6-zk8wl | thousands per day | High with churn |
Useful intuition: if you can list every possible value of a field on a whiteboard, it is low cardinality. If listing them would take a database query, it is high cardinality.
Cardinality vs dimensionality
These terms get used interchangeably, and that is where most confusion starts.
- Cardinality is the number of unique values inside a single field.
- Dimensionality is the number of fields attached to an event, log line, metric series, or span.
A log line with service, status_code, user_id, region, pod, and route has six dimensions. Each of those dimensions has its own cardinality. service might have 50 unique values. user_id might have 5 million. The two ideas compose: a system can be high in dimensionality, high in cardinality, or both.
This distinction matters because the failure modes are different. High dimensionality stresses schema flexibility and storage layout. High cardinality stresses indexing, time series management, and query planners. A platform can handle one and fail at the other. Most legacy metrics systems, including Prometheus and many TSDBs, are built around the assumption that label cardinality stays bounded. Their pain shows up as time series cardinality grows. A modern columnar store handles thousands of dimensions cleanly because it does not try to maintain a per-label-combination index.
When people say "cardinality explosion," they usually mean a multiplicative interaction between high dimensionality and high cardinality on at least one of the dimensions.
High cardinality vs low cardinality
It helps to think of cardinality not as a number, but as a behavior in your observability stack.
| Aspect | Low cardinality | High cardinality |
|---|---|---|
| Typical fields | env, region, status_code, http_method | user_id, trace_id, request_id, pod_name |
| Storage cost | Small, predictable | Large, often unpredictable |
| Index pressure | Minimal | Significant, especially in label-indexed systems |
| Query patterns | Aggregations, group-by on small sets | Filtering, search, joins on unique values |
| Debugging value | Useful for trends and SLOs | Critical for root-cause analysis |
| Risk profile | Safe to keep as labels everywhere | Risky as metric labels, valuable in logs and traces |
The mistake is treating these as opposites. A healthy observability stack uses both. SLOs and dashboards live on low-cardinality dimensions. Incident investigation, fraud analysis, and customer-specific debugging live on high-cardinality dimensions. The art is matching the right cardinality to the right signal type and storage system.
Why high cardinality matters in observability
Observability is the ability to ask new questions of your system without shipping new code. That definition only holds when the underlying telemetry is rich enough to support unanticipated queries. High Cardinality is what makes that possible.
Consider an incident. Your error rate spikes by 0.4 percent for an hour. Aggregated metrics tell you something is wrong. They will not tell you whether the issue affects one tenant, one region, one specific build of the mobile client, or one shard of a database. Answering "why" rather than "what" requires drilling into dimensions whose cardinality is, by definition, high. Tenant ID. Build version. Database shard ID. Customer plan. Feature flag variant.
A few practical reasons high cardinality matters:
- Multi-tenant systems live or die by tenant-level visibility. You cannot run a SaaS platform without being able to answer "is this customer impacted" in seconds.
- Cloud-native systems generate identifiers continuously. Containers, pods, nodes, and ephemeral workloads create new unique values on every deploy or autoscale event.
- Microservices fragment context. A single user request can touch 30 services. Without trace IDs and user IDs preserved across signals, you cannot reconstruct the request.
- Modern debugging is hypothesis-driven. Engineers form a hypothesis, filter telemetry on a high-cardinality field, and either confirm or reject the theory. Without those fields, debugging falls back to guessing.
If you take away nothing else from this section: the question is not whether to capture high-cardinality data. The question is how to store it so it stays fast and affordable.
Keep the labels that help you debug. Parseable keeps high-cardinality data fast and cost-efficient with columnar storage. Sign up for Parseable.
Where high cardinality shows up
High Cardinality is not a single problem. It surfaces differently across each signal type, and the same attribute can be cheap in one and ruinous in another.
High-cardinality metrics
This is where cardinality hurts most. Most metrics systems organize storage around the unique combinations of label values, often called active series or time series. Each unique combination of labels creates a separate series in storage. Adding a high-cardinality label to a metric multiplies the number of series.
A counter http_requests_total with labels {method, status, route} might produce 600 series. Add user_id and you can produce millions overnight. The metric did not get richer in any useful aggregate sense. The ability to compute rate(http_requests_total[5m]) did not improve. The system just got more expensive.
This is why label cardinality control is the single most important practice in metrics-system operations.
High-cardinality logs
Logs handle high cardinality much more gracefully. A log line is a self-contained event with arbitrary fields. Storing user_id, trace_id, and request_id in logs is normal and expected. The cost model is per-event, not per-unique-combination.
The catch is that some log systems were built like metrics systems. Loki, for example, treats labels as an index and explicitly recommends keeping label cardinality low, then putting high-cardinality data in the log line body.
High-cardinality traces
Tracing was designed for high cardinality. Every span has a unique trace ID and span ID. Spans carry attributes like user ID, tenant ID, request ID, route template, downstream service, and more. The trade-off in tracing is sampling rather than cardinality, because storing every span is too expensive at scale, but the model itself accepts unbounded uniqueness.
This is why traces are often the right home for the most granular per-request context, especially when sampled intelligently.
Cloud-native and Kubernetes metadata
Kubernetes is a high-cardinality factory. Pod names contain a hash suffix that changes on every restart. Node names rotate as the cluster scales. Deployment versions update continuously. Job IDs are unique per run. CronJob executions create new identities every time they fire. Add multi-cluster, multi-region, and multi-tenant setups, and you get explosive label growth that has nothing to do with traffic patterns.
How high cardinality explodes
Cardinality growth is not a slow drift. It is a multiplication. Most teams underestimate it because it does not look bad on a single dimension. It only becomes a problem when dimensions combine.
The combination problem
Imagine a metric with these labels:
region: 5 valuesservice: 20 valuesenvironment: 4 valuesstatus_code: 10 commonly seen valuesroute: 200 normalized routestenant_id: 10,000 values
The active series count is, in the worst case, the product of these:
5 × 20 × 4 × 10 × 200 × 10,000 = 800,000,000
Eight hundred million series. In practice not every combination appears, but production systems frequently hit 5 to 30 percent of theoretical maximum. That is still tens of millions of series. Many TSDBs start to choke at one to ten million.
Why growth is multiplicative, not additive
Engineers tend to add labels one at a time, reasoning about each addition in isolation. Adding tenant_id "doubles" the data, intuitively. Adding route "adds a few hundred more values." Each step looks defensible.
The reality is that each new label multiplies against every existing label combination. Adding tenant_id to a metric with 1,000 existing series turns it into 10 million series, not 11,000. Adding pod_name after that, with 5,000 unique pods over the retention window, turns it into 50 billion series, not 10,005,000.
This is the math behind every postmortem that begins with "we added one label and Prometheus crashed two days later."
The defense is not to ban high-cardinality fields. It is to:
- Keep metric labels strictly bounded.
- Move per-request, per-user, and per-tenant detail into logs and traces.
- Use a system whose cost model is not multiplicative on the count of unique label combinations.
We unpacked this trade-off architecturally in our guide on High cardinality meets columnar time series.
If high-cardinality telemetry is slowing queries or increasing cost, try Parseable. It is built to keep rich context without the usual trade-offs. Sign up for Parseable for free
Why high cardinality becomes a problem
Once cardinality runs ahead of your platform's design, the symptoms cascade. Here are some of the reasons why high cardinality becomes a problem:
-
Storage overhead: Every unique series in a TSDB carries metadata: label names, label values, an inverted index entry, and chunk pointers. At ten million series, that overhead alone can exceed the storage of the actual samples.
-
Slower queries: Query planners scan the index to find matching series before they touch sample data. As index size grows, every query gets slower, even queries that ultimately return one or two series.
-
Index bloat: Inverted indexes track which series contain which label values. A high-cardinality label like
user_idadds millions of postings lists. Memory and disk usage scale with that. -
Memory pressure: Most TSDBs keep the active index and recent samples in memory. As active series grows, RAM usage grows linearly. OOM kills follow, often after a deploy that introduces new label values.
-
Shorter retention: When storage and memory budgets are fixed, the only knob left is retention. Teams cut from 30 days to 14 days, then to 7. Investigations that need historical context get harder.
-
Alert performance issues: Alerting rules evaluate continuously. As series count grows, evaluation slows, alert latency grows, and missed pages start showing up.
-
Higher observability bills: Vendor pricing in the metrics space is almost universally tied to active series, ingest volume, or both. High cardinality makes spend grow non-linearly.
The point is not that high cardinality causes performance problems abstractly. The point is that traditional metrics architectures were optimized for the opposite of what modern systems produce.
When high cardinality is useful and when it is harmful
There is no rule that says "avoid high cardinality." That advice is wrong and outdated. The right rule is: high cardinality is good when it improves debugging or business visibility, and bad when it only inflates storage without adding insight.
Good high cardinality
- Tenant ID. Essential for any multi-tenant system.
- User ID. Critical for support, fraud investigation, and customer-impact analysis.
- Trace ID. The backbone of distributed debugging.
- Build version or release ID. Lets you correlate incidents to specific deploys.
- Feature flag variant. Tells you which experimental path a request took.
- Normalized route template. Provides per-endpoint visibility without raw URL explosion.
- Database shard ID. Lets you identify which shard is misbehaving.
These signals carry real diagnostic value. Losing them means losing the ability to answer real incident questions.
Bad high cardinality
- Raw URLs with query strings.
/api/users/3829/orders?page=12&token=abcshould be normalized to/api/users/:id/orders. - Request IDs as metric labels. They are unique per request. They have no aggregate meaning.
- Timestamps as labels. This is a category error. Time is already an axis.
- Email addresses or full names where IDs would suffice. PII concerns aside, they do not aggregate well.
- Random session tokens or nonces. Pure noise as labels.
- Container hashes without TTL. They grow forever and are never queried.
The litmus test: would you ever group by this label, or filter on a known small set of its values? If yes, keep it. If you would only ever filter on a single specific value while debugging, it does not belong on a metric. It belongs on a log or a span.
High cardinality over time
Most cardinality discussions focus on a snapshot. They ask: how many unique values does this label have right now? That is the wrong question for cloud-native systems.
Point-in-time cardinality vs cardinality over time
Point-in-time cardinality is the number of unique values present at a given moment. Cardinality over time is the number of unique values that have appeared across a window. The second is almost always larger, sometimes orders of magnitude larger.
Example: a Kubernetes deployment has 50 pods at any given moment. Point-in-time pod cardinality is 50. But over a 30-day window, with daily deploys and autoscaling churn, the same deployment can produce 50,000 unique pod names. That is the number that matters for storage, retention queries, and long-window dashboards.
What churn means
Churn is the rate at which unique values are created and retired. A high-churn label has a small live set but a huge cumulative set. Pod names, container IDs, ephemeral job IDs, and short-lived feature flag variants are all classic high-churn fields.
Churn is poisonous to label-indexed metrics systems. Each new value adds a new postings list and a new series. Old values do not disappear from the index until retention expires. Storage and memory grow even when the live workload is stable.
Why cloud-native systems make churn worse
The Kubernetes scheduler, Horizontal Pod Autoscaler, and rolling deployments all generate identifier churn as a normal part of operation. CI/CD pipelines that ship multiple times per day create new build identifiers continuously. Spot instances and preemptible nodes rotate even faster. None of this is a misconfiguration. It is the design of cloud-native infrastructure.
The implication is that any platform that meters or indexes cardinality must be designed to absorb churn, not just point-in-time uniqueness.
Why long query windows become more expensive
A query like "show me error rate for the last hour, grouped by pod" hits the live set. A query like "show me error rate for the last 30 days, grouped by pod" hits the cumulative set, which can be 1,000 times larger. Long-window queries on high-churn dimensions are where dashboards quietly start timing out, and where vendor bills get spiky.
This is one of the strongest arguments for S3-native log analytics and columnar storage: object storage scales horizontally without index pressure, and columnar formats let queries skip over data they do not need, even on long windows.
Parseable helps teams query high-cardinality data faster without dropping the fields that matter. Sign up for Parseable
Common high-cardinality anti-patterns
A short list of patterns that seem reasonable in isolation and consistently cause production pain.
- Adding request IDs to metrics: A request ID is unique per request. Putting it on a metric label produces one series per request, which is not what metrics are for. If you need per-request visibility, use logs or traces.
Using user IDs as labels everywhere
Per-user metrics are tempting and almost always wrong. The right pattern is per-tenant or per-cohort metrics, with per-user detail in logs and traces. Filtering logs by user ID is fast in modern columnar log stores. Aggregating per-user metrics rarely answers a real question.
Capturing raw URLs instead of normalized routes
/api/orders/3829 and /api/orders/3830 are the same endpoint from a service-health perspective. Normalize both to /api/orders/:id at the instrumentation layer. Otherwise every order ID becomes a label value.
Tagging ephemeral infrastructure identifiers without controls
Pod names, container IDs, and job IDs are useful in logs and traces but dangerous as metric labels without an explicit retention or aggregation policy. Either drop them at the metrics layer or aggregate them into a stable identifier like deployment name.
Treating metrics like logs
This is the meta anti-pattern. Metrics are for trends and aggregates. Logs are for events. Traces are for request flows. When teams use metric labels to capture per-event detail, they are reinventing logs in a system that cannot store them efficiently. The fix is to stop, and to push event-level detail into a log or trace store designed for it.
Metrics vs logs vs traces for high-cardinality data
The single most useful framing in observability is that not every signal type should carry the same cardinality. Choosing the right home for each attribute is what makes a stack scalable.
| Signal | Cost model | Tolerates high cardinality? | Best for high-cardinality |
|---|---|---|---|
| Metrics | Per active series, per sample | Poorly, in label-indexed systems | Bounded enums, SLO dimensions |
| Logs | Per event, per byte | Yes, in modern columnar stores | Per-event context, user IDs, trace IDs |
| Traces | Per span, often sampled | Yes, by design | Per-request flow, span attributes |
When high-cardinality data belongs in metrics
Almost never. Keep metrics labels low and bounded. The exceptions are dimensions you genuinely group or filter by in dashboards: service, route template, region, environment, status class, tenant tier (not tenant ID).
When it should move to logs
Whenever a field is high cardinality and you need to filter or search on specific values, but rarely aggregate across all values. User ID, tenant ID, request ID, full URL path, error message body, customer email. Logs are also the right place to record state transitions and discrete events that need a wide attribute footprint.
When traces are the better fit
When the question is "what happened during this specific request and which downstream services were involved." Traces preserve causal structure. Logs do not. If your debugging session involves walking through service-to-service hops, traces are the right primary signal.
How to preserve context across signals
The trick that ties this together is shared identifiers. Every log line, span, and metric exemplar should carry the same trace_id and tenant_id where available. That gives you the ability to start in metrics ("error rate is up"), pivot to logs ("show me errors for the affected tenant"), and pivot to traces ("show me the slowest request matching this filter") without losing context. OpenTelemetry's exemplars feature is a deliberate solution to exactly this problem.
How to detect if high cardinality is already hurting you
The signs are usually in the operational behavior of your stack, not in your data quality reports.
Warning signs
- Dashboards take 10 to 60 seconds to load, especially on long time ranges.
- Queries time out on
group byoperations. - Storage costs growing faster than traffic.
- Active series count climbing even when traffic is flat.
- Memory pressure or OOMs on Prometheus, Mimir, or similar after every deploy.
- Retention shrinking under cost pressure.
- Alert evaluation lag growing.
- Stability incidents that follow autoscaling events.
What to check in Prometheus-style systems
A few practical checks in any Prometheus-compatible system:
prometheus_tsdb_head_seriesshows your active series count. Track its growth rate.topk(20, count by (__name__)({__name__=~".+"}))finds the metrics with the most series.count by (label_name) ({metric_name})for a specific metric breaks down which labels are driving cardinality.- Look at scrape duration trends. Long scrape times often indicate exporter-side cardinality issues.
- Check for label values that look like UUIDs, hashes, or unbounded strings.
How to reduce or control high cardinality
There are two strategies. One is to suppress high-cardinality data, which loses information. The other is to redirect it to a system that can handle it. The right answer is usually some of both.
Normalize labels and routes
Convert raw URLs to route templates at instrumentation time. Drop query string parameters from labels. Replace IDs in paths with :id placeholders. Most HTTP middleware can do this automatically with a small config change.
Remove low-value, unbounded dimensions
Audit every metric label. If it is high cardinality and never used in a dashboard or alert, drop it. Move it to logs or traces. The instinct to "keep it just in case" is what creates most cardinality problems.
Use aggregation or rollups where appropriate
Recording rules and rollup pipelines can pre-aggregate high-cardinality metrics into lower-cardinality versions. Keep the raw form for short-term debugging, the aggregated form for long-term trends.
Move some dimensions from metrics to logs or traces
The simplest fix is often the right one: stop labeling metrics with user_id and start logging it. The user-level visibility you wanted is still there, in a system designed for it.
Set telemetry governance rules
Document which label categories are allowed on which metric families. Treat new high-cardinality labels as a code review concern, not a runtime concern. Catch them before they ship.
Track cardinality over time, not just point-in-time
Build dashboards that show active series growth, churn rate per label, and top-N labels by cardinality. Make these dashboards visible to every engineer adding instrumentation.
Use storage and query systems built for high-cardinality workloads
If your team is repeatedly fighting cardinality, the architecture is the problem, not the engineers. The right move is a platform whose storage layer does not punish high cardinality the way label-indexed TSDBs do. Columnar formats, object storage, and query engines that read only the columns they need scale where label-indexed systems cannot.
How Parseable handles high-cardinality data
Most observability platforms inherit assumptions from the metrics systems they were built around: a label-indexed model where adding a high-cardinality field multiplies cost. Parseable was designed differently because high-cardinality data was the original use case, not an afterthought.
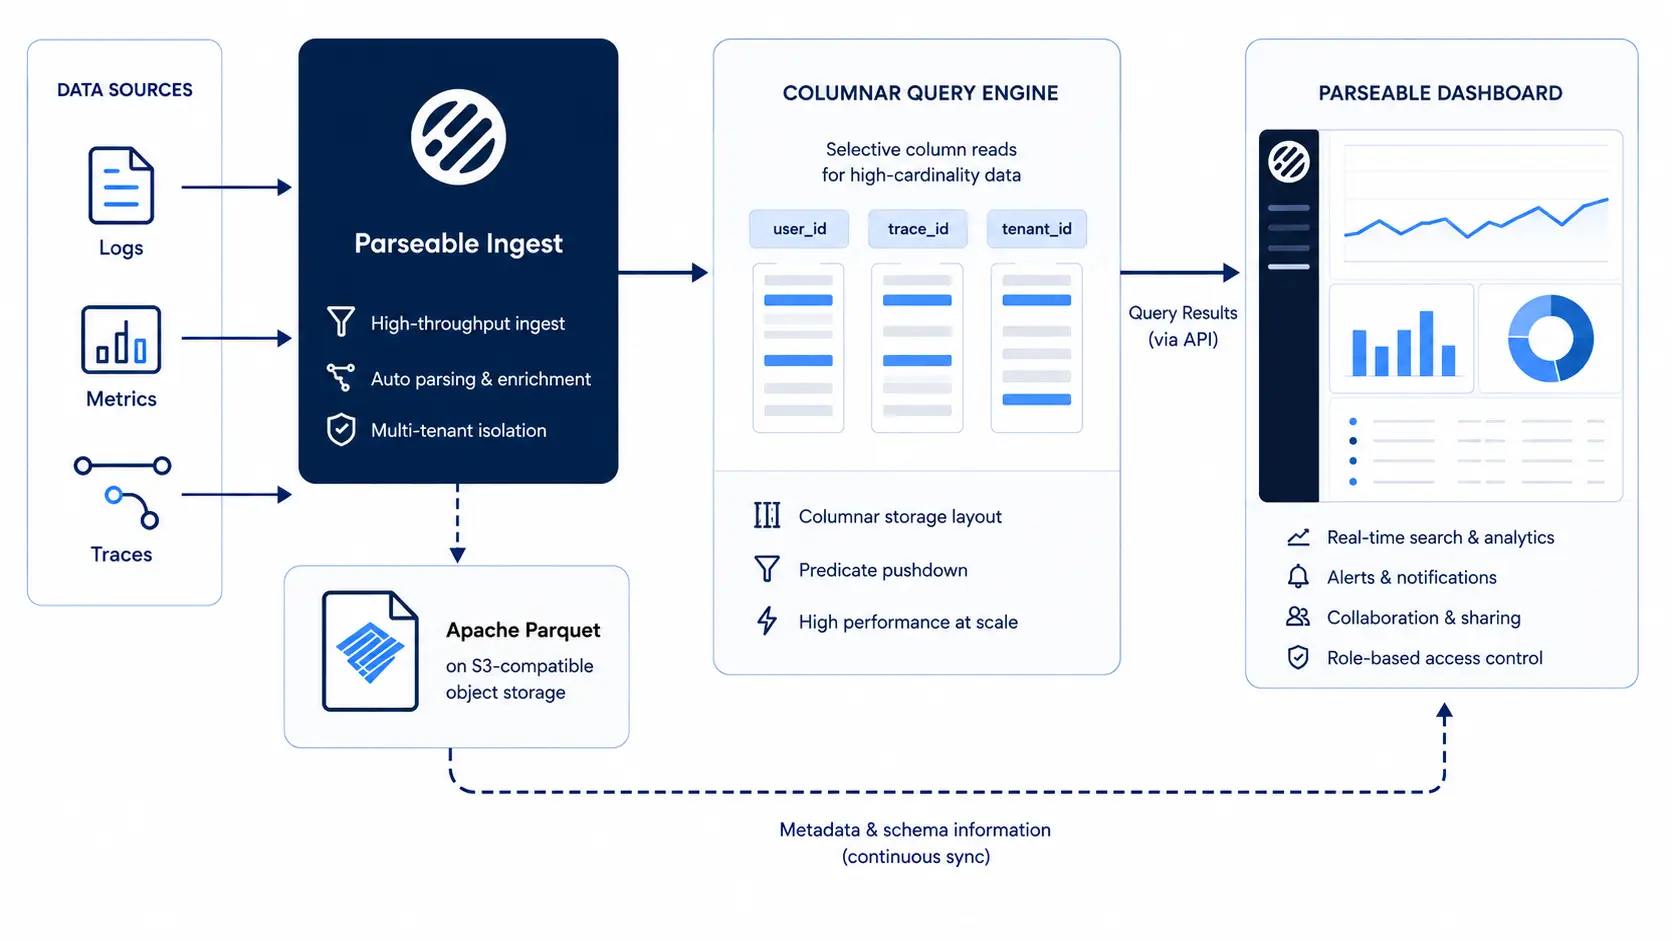
Columnar storage isolates high-cardinality fields
Parseable stores telemetry in Apache Parquet, a columnar format. A high-cardinality field like user_id lives in its own column. Queries that do not touch that column do not pay any cost for its cardinality. Queries that filter on it read only the relevant column, with column statistics, dictionary encoding, and row-group skipping pruning most of the data before it is ever scanned. This is the opposite of label-indexed systems, where every label combination expands the storage and memory footprint of every query.
Open Parquet storage and better compression
Columnar formats compress aggressively because data within a column is homogeneous in type. High-cardinality fields with repeating substrings compress with dictionary encoding. Numeric fields use bit-packing and run-length encoding. Compression ratios of 10x to 30x are typical, which directly reduces storage cost and read I/O. Because the format is open, the data is portable and queryable by any engine that speaks Parquet, not just Parseable.
Avoiding the label-index trap
In label-indexed systems, every unique combination of labels creates a new time series with metadata overhead. The system must maintain an inverted index across all labels to support filtering. As cardinality grows, the index grows, memory usage grows, and query time grows. Parseable does not maintain a per-label-combination index. It uses column statistics and partition pruning, which scale with the data being read, not with the cardinality of fields that are not in the query.
Keeping useful context without dropping everything
The result is that teams running on Parseable do not have to choose between dropping high-cardinality fields and paying for an index that cannot keep up. User IDs, trace IDs, request IDs, tenant IDs, and route templates can all stay in the data. The platform handles them at object-storage economics, with query performance that comes from columnar pruning rather than upfront indexing of every value.
If you want to see how this works on your own data, sign up for Parseable and ingest a sample of your high-cardinality logs to compare.
What to look for in a platform for high-cardinality observability
If you are evaluating platforms with high cardinality in mind, the questions worth asking are usually not the ones in the vendor RFP template.
- Query performance on long windows. Ask how a
group by user_idover 30 days behaves on real volumes, not on the demo dataset. - Compression efficiency. What is the on-disk size per ingested GB after compression. Columnar systems should be 10x or better.
- Cost predictability. Is pricing tied to active series, ingest, storage, or query. Active-series pricing punishes high cardinality structurally.
- Support for logs, metrics, and traces. A unified store for all three avoids the silo problem and preserves cross-signal context.
- OpenTelemetry and open standards. Lock-in is the second most expensive mistake in observability after under-instrumentation.
- Visibility into cardinality growth and churn. Does the platform show you which fields are growing, with alerting on churn.
- Storage architecture. Object storage with open formats has fundamentally different economics from proprietary stores. We compared the trade-offs in our Elasticsearch vs Parseable post.
- Retention flexibility. Can you keep 90 days of high-cardinality data without restructuring your bill.
Conclusion
High Cardinality is not something teams should eliminate. It is what makes modern observability useful. Fields like tenant_id, user_id, trace_id, and route templates are often the difference between spotting a broad symptom and actually isolating the request, user segment, or service path behind it.
The real issue is not rich telemetry itself. It is trying to push that telemetry through systems that were designed around low-cardinality assumptions and then paying for the mismatch in slower queries, tighter retention, and rising cost.
Parseable’s current high-cardinality positioning leans into exactly this problem: columnar storage, Parquet, and field-level isolation so teams can keep detailed context without letting it multiply cost across the whole system.
The practical path is still the same. Keep metric labels disciplined, normalize routes, and move per-request detail into the signals and storage layers that can actually support it. But just as important, choose an architecture built for the shape of modern telemetry.
Parseable is built for this shift, with a columnar architecture that keeps high-cardinality fields queryable, costs under control, and useful context intact instead of forcing teams to drop it early.
If your team is already feeling the pressure of high-cardinality data, this is the point where architecture starts to matter more than workarounds. Instead of stripping away the fields engineers rely on during incidents, it is worth trying a platform built to keep that detail queryable and cost-efficient.
Sign up for Parseable and test it with a representative slice of your own high-cardinality telemetry. Parseable’s current product messaging specifically frames this around faster queries, lower cost, and a “start for free” motion for hands-on evaluation.

