
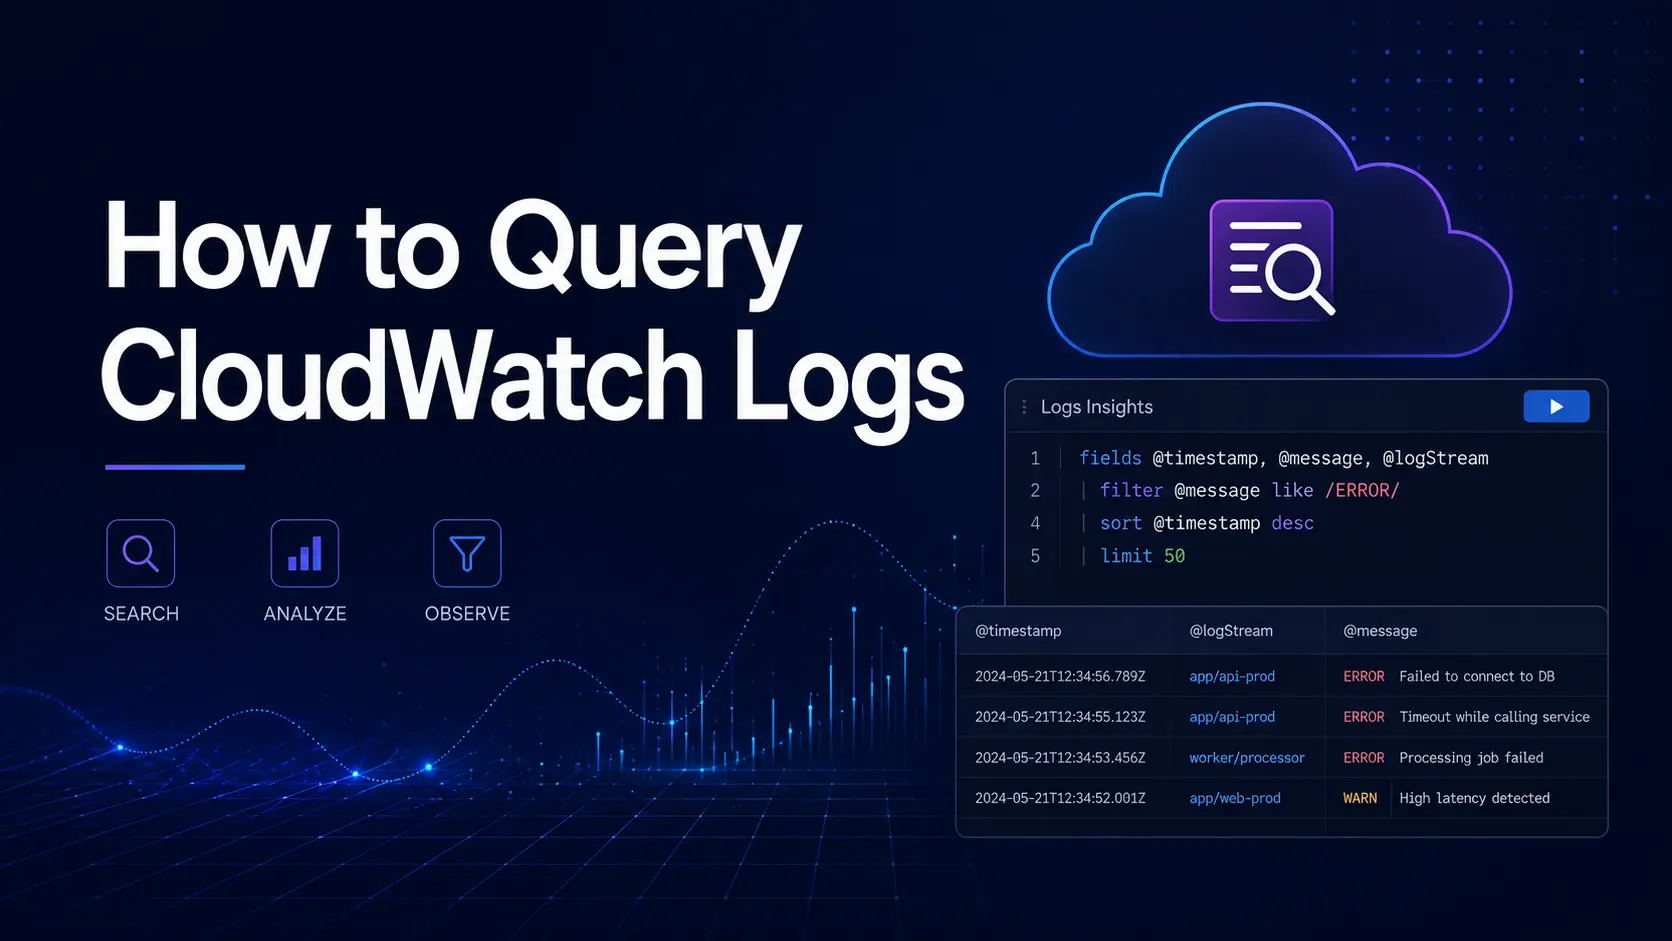
CloudWatch Logs are usually the first place AWS teams go when something breaks. A Lambda function starts throwing errors, an API returns 500s, a container restarts, or a deployment changes behavior, the fastest next step is often the same: open CloudWatch, find the right log group, and start querying.
The problem is that CloudWatch log querying can feel simple at first and messy very quickly. You need to know where the logs are stored, how Logs Insights works, which fields are available, and how to write queries that return useful answers instead of thousands of raw log lines.
A basic keyword search may help during small incidents, but production debugging usually needs more specific queries around errors, request IDs, latency, Lambda invocations, API Gateway responses, and grouped patterns.
This guide walks through how to query CloudWatch Logs using the native AWS workflow. It also explains where that workflow becomes harder to scale, and how teams can use Parseable to query CloudWatch logs with SQL, plain English, dashboards, and alerts.
What is CloudWatch Logs Insights?
CloudWatch Logs Insights is AWS’s built-in query engine for searching and analyzing log data stored in CloudWatch Logs. Instead of manually scrolling through raw log events, teams can write queries to filter errors, sort events by time, extract fields, count patterns, and group results across one or more log groups.
It is mainly used during debugging and incident investigation. For example, you can use it to find recent application errors, trace a request ID, check Lambda timeout patterns, or measure how often a specific status code appears over time.
CloudWatch Logs Insights supports its own query language, Logs Insights QL, along with OpenSearch PPL and OpenSearch SQL. AWS also supports natural-language query generation for Logs Insights, where users can describe what they want to find and generate a query from that prompt.
How to query CloudWatch Logs in AWS
The easiest way to query CloudWatch Logs is through CloudWatch Logs Insights in the AWS console. Logs Insights lets teams select one or more log groups, define a time range, write a query, and inspect matching log events without opening each log stream manually.
Here’s a step-by-step guide on how to do it:
Step 1: Open CloudWatch Logs
Go to the AWS Console and open CloudWatch. From the left-side menu, go to Logs and then open Log groups.
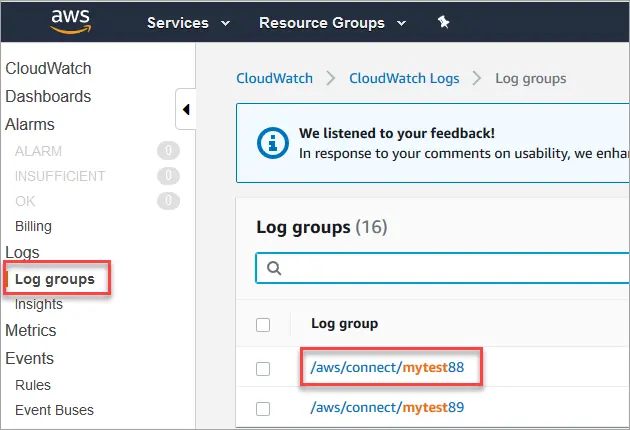
This is where AWS stores logs from services like Lambda, API Gateway, ECS, EKS, EC2, and other applications sending logs into CloudWatch.
Step 2: Select the right log group
Choose the log group you want to query. For example, Lambda logs usually use a format like:
/aws/lambda/bash-runtimeFor applications running on ECS, EKS, or EC2, the log group name depends on how logging was configured. The important part is to pick the log group that contains the service, function, or workload you want to investigate.
Step 3: Open Logs Insights
After selecting the log group, open it in Logs Insights. You can also go directly to CloudWatch → Logs Insights, then select the log group from the query interface.
CloudWatch Logs Insights can query multiple log groups, and AWS also supports querying log groups across linked source accounts when cross-account observability is configured.
Step 4: Set the time range
Before writing the query, select the time range you want to inspect.
This matters because CloudWatch Logs Insights scans log data inside the selected time window. A smaller time range usually makes the query faster and helps reduce the amount of data scanned.
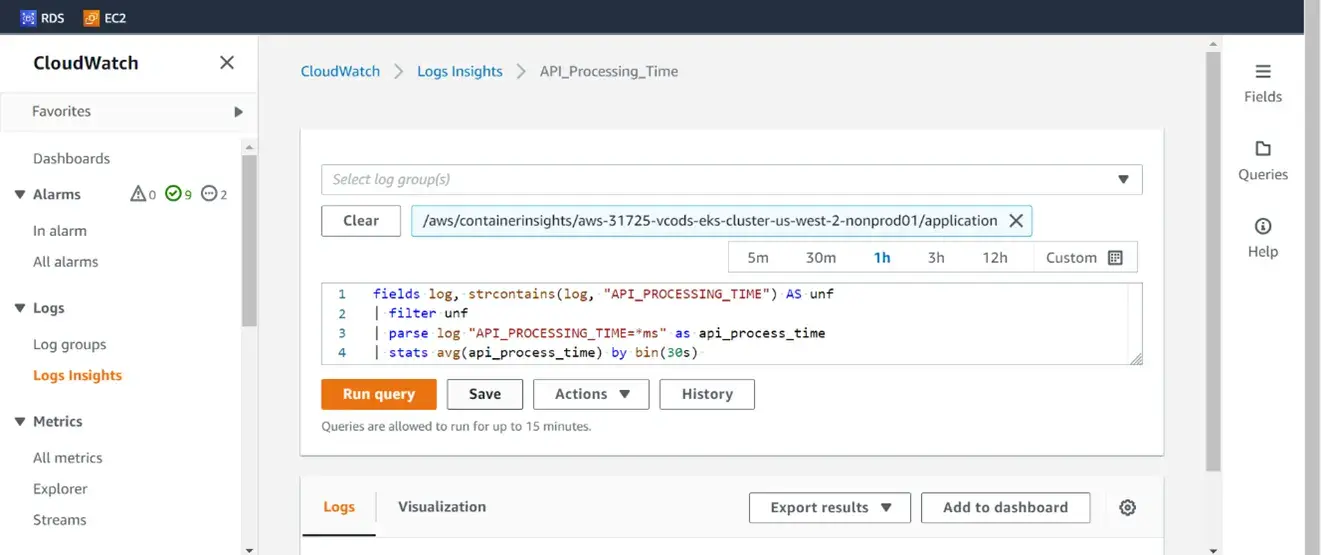
Step 5: Run your first query
Start with a simple query that shows the latest log events:
fields @timestamp, @message, @logStream
| sort @timestamp desc
| limit 20
This query does three things:
fieldsselects the columns you want to see.sort @timestamp descshows the newest logs first.limit 20returns only the latest 20 matching events.
AWS documents fields, filter, sort, stats, parse, and limit as common Logs Insights QL commands used to display, filter, aggregate, extract, and control query results.
Step 6: Filter for the logs you need
Once the basic query works, add a filter. For example, to find recent errors:
fields @timestamp, @message, @logStream
| filter @message like /ERROR|Exception|Failed/
| sort @timestamp desc
| limit 100
This is usually the first practical query to run when debugging failed deployments, Lambda errors, API failures, or application exceptions.
Step 7: Open and inspect the result
After running the query, review the matching log events in the results table. From there, you can expand individual events, copy values like request IDs or error messages, and refine the query further.
Need a broader log workflow than one-off CloudWatch searches? Read our guide to log management tools to understand how teams collect, store, query, and analyze logs across production systems.
Why querying logs only in CloudWatch becomes hard to sustain
CloudWatch Logs Insights is useful for quick AWS-native debugging. It gives teams a built-in way to query logs from services like Lambda, API Gateway, ECS, EKS, and EC2 without setting up a separate logging system.
But once teams start using CloudWatch as their main layer for production log analysis, the model becomes harder to sustain. The issue is not that CloudWatch Logs Insights is ineffective. The issue is that log volume, retention needs, query frequency, and cross-service debugging requirements grow faster than the basic workflow.
Query cost grows with the amount of data scanned
CloudWatch Logs Insights queries are charged based on the amount of data queried. AWS also recommends selecting only the necessary log groups and using the narrowest possible time range to avoid scanning unnecessary data. You can verify the underlying model in the official AWS CloudWatch pricing page.
That works well when an engineer is checking a 15-minute incident window. It becomes harder when teams need to query multiple services, longer time ranges, or high-volume production logs. Every broader search increases the amount of data scanned, which makes CloudWatch log analysis less predictable at scale.
For teams learning how to query CloudWatch Logs, this is an important habit: start with a narrow time range, filter early, and expand only when needed.
Retention and storage add another layer of cost
CloudWatch costs are not limited to queries. Teams also need to account for log ingestion, storage, and analysis. AWS CloudWatch pricing separates these usage areas, which means log cost can grow across multiple dimensions as more services send data into CloudWatch.
This creates a common tradeoff. Teams can keep logs for longer and preserve more historical context, but that increases the amount of data they manage. Or they can shorten retention to control cost, but that can make root-cause analysis harder after an incident.
For small workloads, this may be acceptable. For production environments with logs from Lambda, ECS, EKS, API Gateway, EC2, and custom applications, retention becomes a cost and investigation decision.
Keep the logs you need, not just the logs you can afford to retain. If CloudWatch retention is becoming a cost tradeoff, move long-term log analysis to Parseable while keeping AWS as part of the pipeline. See Parseable pricing or start free.
Logs Insights adds another query language to maintain
CloudWatch Logs Insights uses its own query syntax with commands like fields, filter, parse, stats, sort, and limit. These commands are useful for filtering, extracting, aggregating, and ordering log data.
The syntax is simple enough for basic troubleshooting. For example:
fields @timestamp, @message, @logStream
| filter @message like /ERROR|Exception|Failed/
| sort @timestamp desc
| limit 100
The challenge appears when teams want a more standard analysis workflow. If engineers, platform teams, or data teams already use SQL for operational analysis, Logs Insights becomes another query model to learn, save, document, and maintain.
During incidents, that context switching matters. The faster teams can query logs in a familiar format, the faster they can move from raw events to actual diagnosis.
Broad investigations can run into practical limits
CloudWatch Logs Insights is designed for operational querying, but it is not unlimited. AWS notes that Logs Insights queries time out after 60 minutes, and query results are available for seven days. AWS has also documented quota increases around queried log groups, query timeout, and query concurrency, which shows that these limits are important in real-world usage.
These limits are reasonable for many AWS debugging workflows. But they become more visible when teams investigate issues across many services, accounts, log groups, or time windows.
A single production issue may involve API Gateway logs, Lambda logs, ECS logs, application logs, metrics, traces, and deployment context. If those signals are spread across different workflows, engineers spend more time stitching evidence together than investigating the actual issue.
When one incident spans many services, your query layer should keep up. Parseable gives engineering teams one place to analyze logs, metrics, and traces with SQL-first querying, AI-assisted investigation, dashboards, alerts, and anomaly detection. Get started for free.
CloudWatch works for debugging, but not always as the long-term query layer
CloudWatch Logs Insights is a strong starting point for querying AWS logs. It works well for recent incidents, service-specific debugging, and quick checks inside the AWS console.
The sustainability problem starts when teams use it as their primary long-term observability query layer. At that point, they usually need more predictable log economics, longer retention, SQL-based querying, and a cleaner way to correlate logs with metrics and traces.
That is where many teams keep CloudWatch in the pipeline, but move deeper log analysis into a purpose-built observability layer like Parseable. If you are already comparing options, this CloudWatch alternatives guide can help frame the tradeoffs.
A better way to query CloudWatch Logs: With Parseable
CloudWatch Logs Insights is useful when the investigation starts and ends inside AWS. But once teams need SQL-based analysis, longer retention, AI-assisted querying, or better correlation across logs, metrics, and traces, CloudWatch becomes less ideal as the main query layer.
A better model is to keep CloudWatch as the source for AWS logs and route those logs into Parseable for deeper analysis. That gives teams a cleaner workflow for querying CloudWatch Logs without replacing the entire logging pipeline at once.
Send CloudWatch Logs to Parseable using OpenTelemetry Collector
Parseable supports a documented AWS CloudWatch ingestion path using the OpenTelemetry Collector. In this setup, the OpenTelemetry awscloudwatch receiver reads logs from CloudWatch Log Groups and forwards them to Parseable through the otlphttp exporter. The flow is simple:
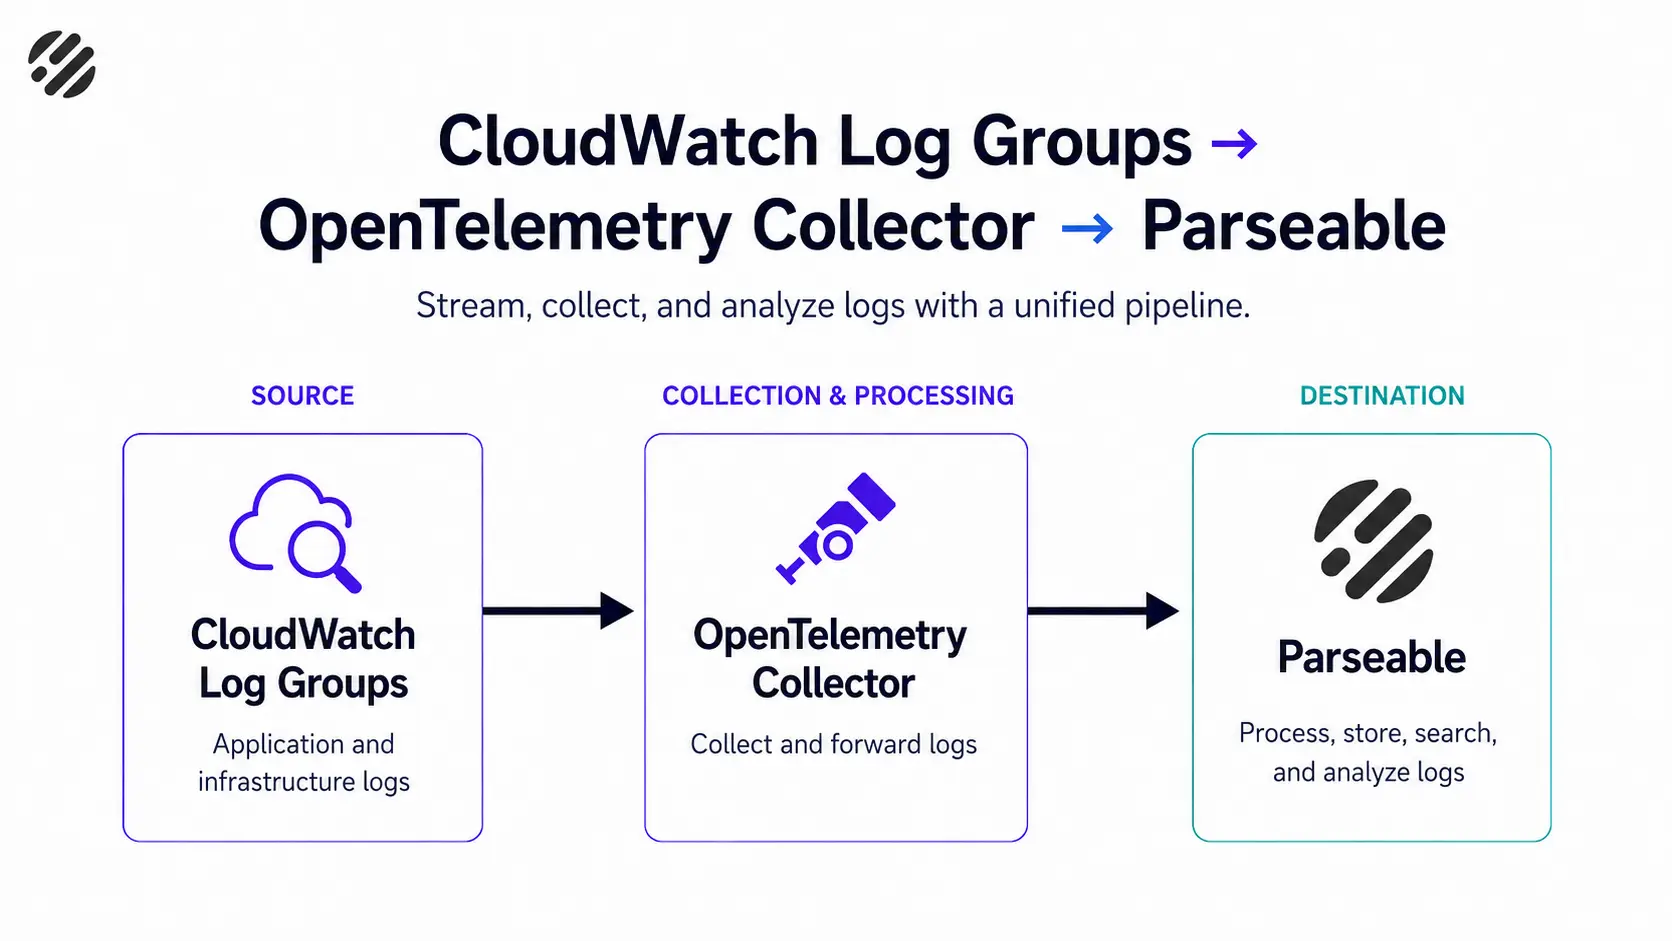
This is useful because teams do not need to rebuild their logging pipeline from scratch. CloudWatch can remain the AWS-native source for logs, while Parseable becomes the observability layer where teams query, analyze, and investigate those logs more flexibly.
For a detailed and step-by-step tutorial, read this CloudWatch migration guide.
Query CloudWatch Logs with SQL
Once CloudWatch logs are in Parseable, teams can query them with SQL instead of writing only Logs Insights queries. This is the core value for teams that want a more standard query workflow.
SQL is familiar, composable, and easier to standardize across engineering, platform, SRE, and data teams. Instead of maintaining a separate query pattern for CloudWatch, teams can use SQL to search logs, filter errors, group events, and build reusable analysis workflows.
For example, to find recent CloudWatch log events that contain errors:
SELECT p_timestamp, log_group, log_stream, message
FROM cloudwatch_logs
WHERE message ILIKE '%error%'
ORDER BY p_timestamp DESC
LIMIT 50;
To count exception patterns by log group:
SELECT log_group, COUNT(*) AS error_count
FROM cloudwatch_logs
WHERE message ILIKE '%exception%'
GROUP BY log_group
ORDER BY error_count DESC;
This makes CloudWatch log analysis easier to reuse across incident response, dashboards, post-incident reviews, and reporting. Parseable’s homepage highlights SQL as a core workflow for slicing and analyzing telemetry data.
Want to test SQL on real CloudWatch logs? Start with one high-volume CloudWatch Log Group, route it into Parseable, and compare how quickly your team can find errors, group patterns, and build reusable queries. Start a free Parseable trial.
Use AI to generate queries faster
Not every engineer wants to write a query from scratch during an incident. In many cases, the team already knows the question but does not want to spend time translating it into the right query syntax.
Parseable’s AI-assisted workflow helps teams generate SQL queries and dashboards faster using natural language. Instead of starting with a blank query editor, an engineer can describe what they want to find and use the generated query as the starting point.
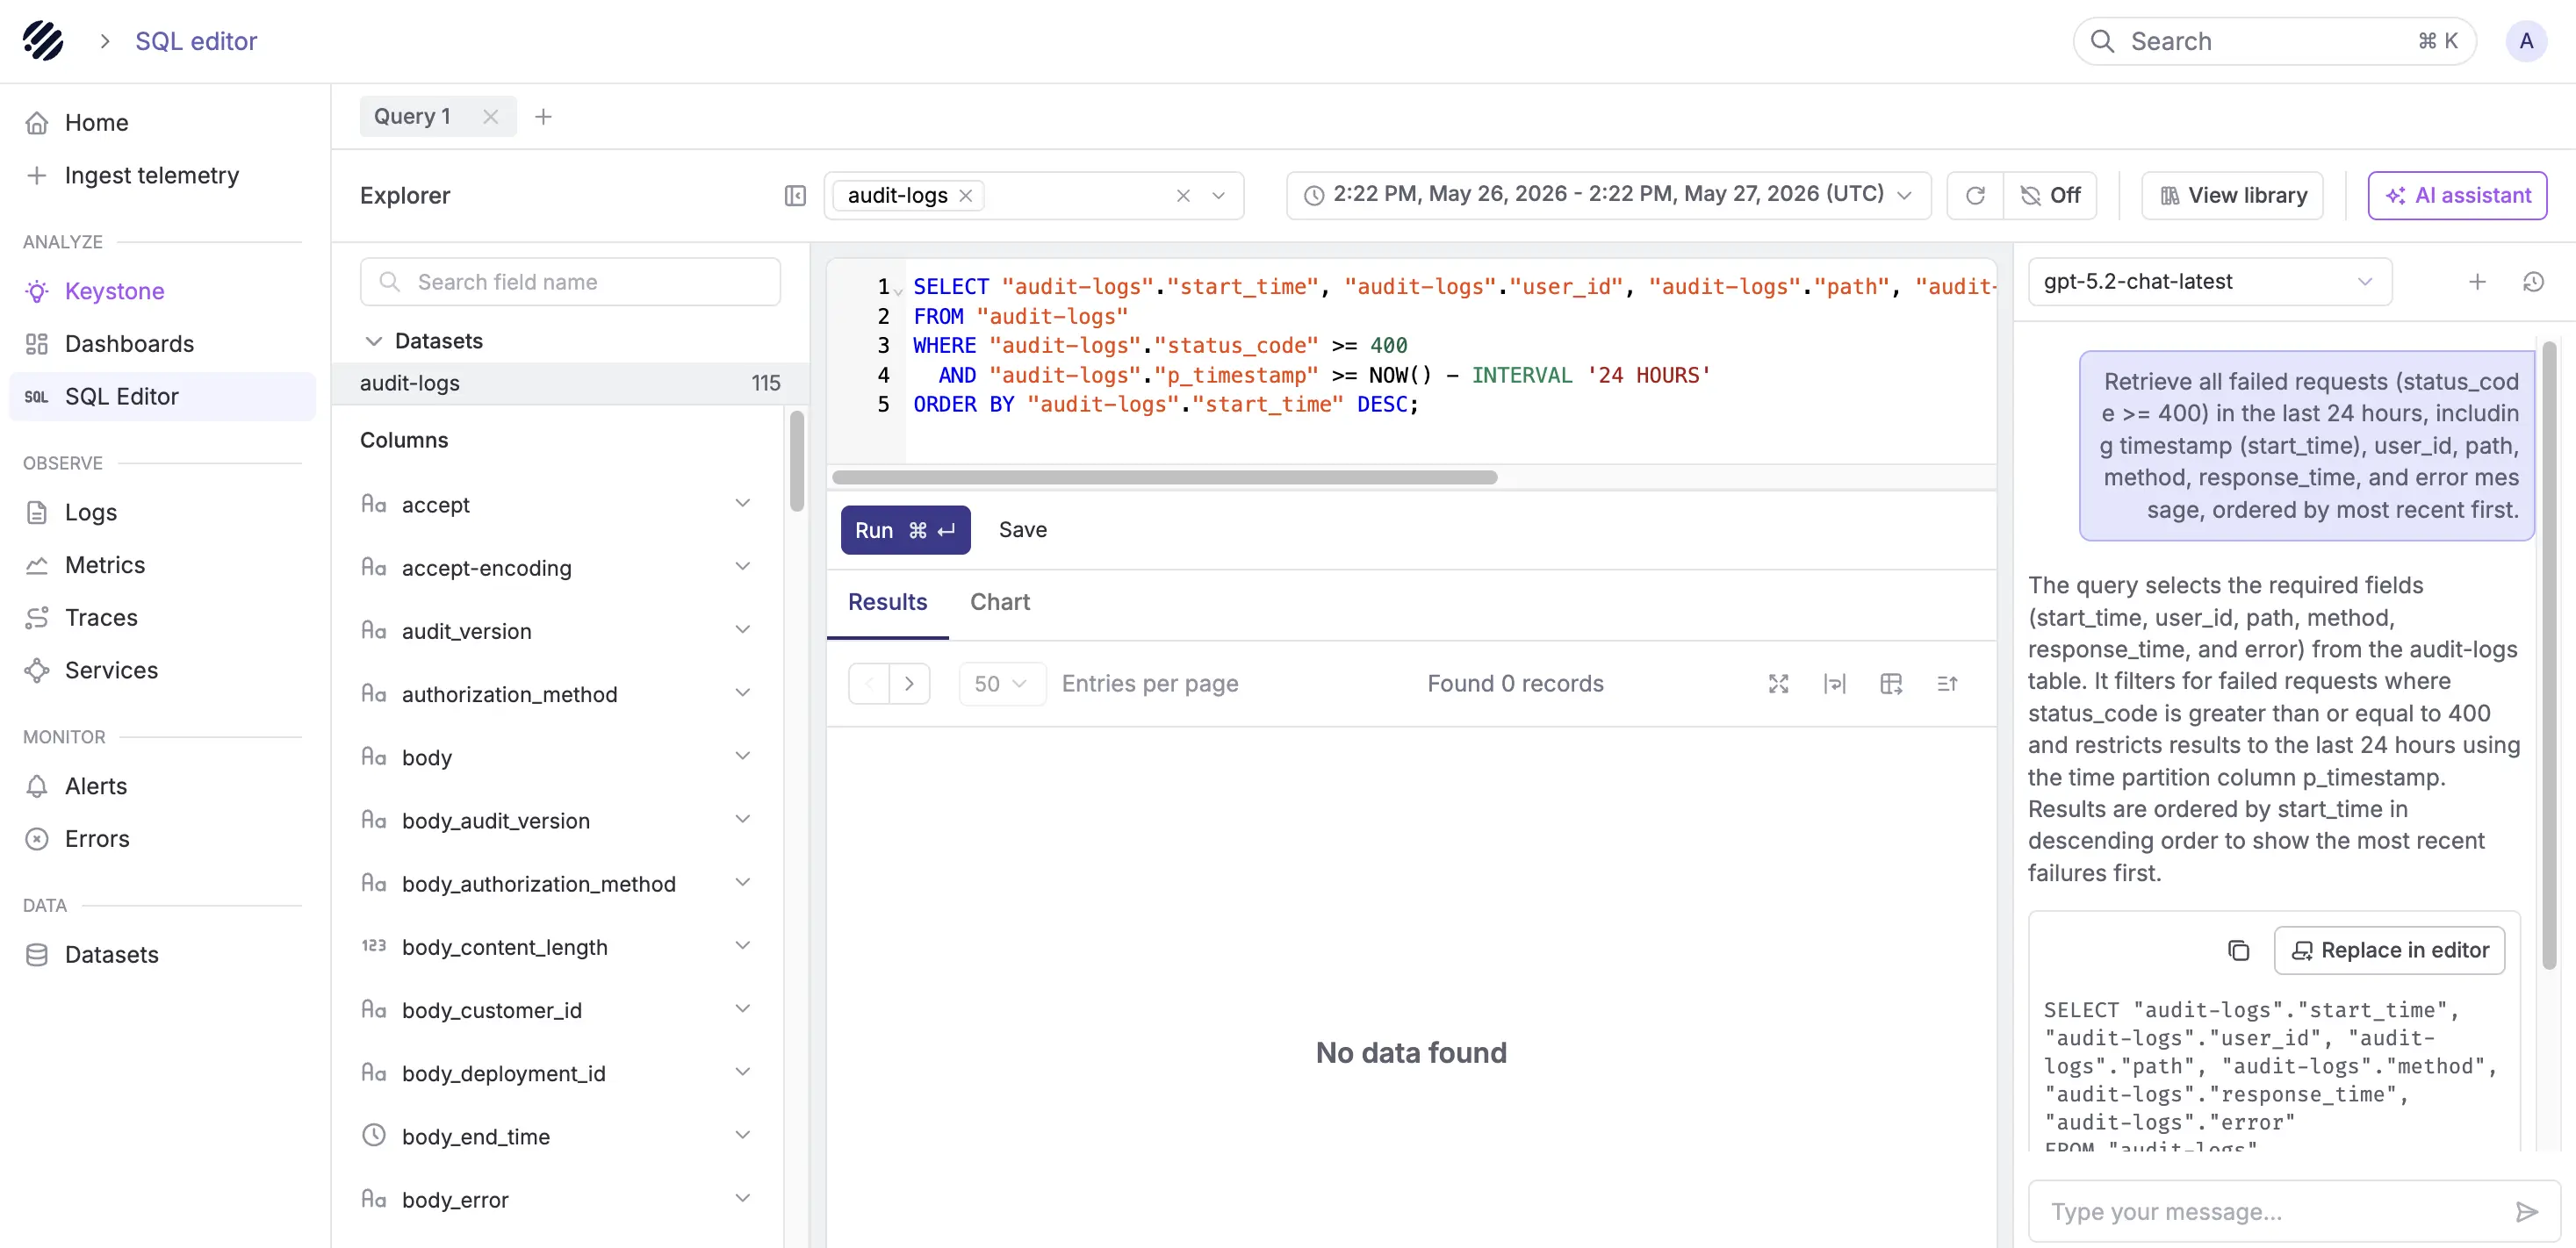
This is especially useful during incidents, where speed matters and the first query does not need to be perfect. Parseable’s homepage states that users can use the assistant to generate SQL queries and dashboards in seconds.
Keep logs connected to metrics and traces
The advantage of Parseable is not only SQL. The larger value is that CloudWatch logs can become part of a unified observability workflow instead of staying isolated in a log-only query tool.
Parseable is built around Metrics, Events, Logs, and Traces. Its ingestion docs define ingestion as the process of sending telemetry signals into Parseable, including metrics, events, logs, and traces.
That matters during production debugging. A CloudWatch log line may show an error, but the root cause could involve a latency spike, a failed deployment, a trace across services, or a metric that changed before the error appeared.
CloudWatch Logs Insights helps query logs. Parseable helps operationalize those logs alongside metrics, traces, dashboards, alerts, and AI-assisted analysis. This makes it a stronger long-term query layer when CloudWatch Logs become part of everyday incident response, not just occasional AWS debugging.
CloudWatch Logs Insights vs Parseable: which method should you use?
CloudWatch Logs Insights and Parseable solve different parts of the log analysis workflow. CloudWatch Logs Insights is the better fit when logs are already in AWS and the team needs a quick, narrow investigation. Parseable is the better fit when CloudWatch logs need to become part of a longer-term, SQL-first observability workflow.
| Use case | CloudWatch Logs Insights | Parseable |
|---|---|---|
| Quick AWS-native log search | Strong fit | Good fit after ingestion |
| SQL-first log analysis | Available through OpenSearch SQL, but not always the default workflow | Strong fit |
| AI-assisted querying | Available in specific Logs Insights workflows | Strong fit for SQL and dashboard generation |
| Unified logs, metrics, and traces | Split across AWS services and surfaces | Built for unified telemetry |
| Long-term log analysis | Can become costly or fragmented at scale | Better fit for retained telemetry |
| Existing AWS-only workflow | Strong fit | Useful when the workflow expands |
AWS supports Logs Insights QL, OpenSearch PPL, and OpenSearch SQL for querying CloudWatch Logs, so teams do have multiple query options inside CloudWatch.
But for many teams, the native workflow still starts with CloudWatch’s operational query model, while Parseable is a better choice when you need SQL-based telemetry analysis, plain-English querying, and unified observability across logs, metrics, and traces.
Already comparing CloudWatch with other observability options? Use this CloudWatch alternatives guide to compare retention, pricing, query workflows, and operational tradeoffs.
Use CloudWatch Logs Insights when
Use CloudWatch Logs Insights when the logs are already in CloudWatch and the investigation is narrow. It is a strong fit for quick AWS-native debugging, especially when an engineer needs to check one service, one log group, or one short incident window.
It also makes sense when the team is fully AWS-native and does not need broader telemetry context. If the query is simple, the time range is small, and the retention or query cost model is acceptable, CloudWatch Logs Insights is usually the fastest place to start.
Use Parseable when
Use Parseable when querying CloudWatch Logs becomes part of daily incident response, not just occasional troubleshooting. This is especially relevant when teams want to query logs with SQL, generate queries faster with AI, or keep logs connected to metrics, traces, dashboards, alerts, and anomaly detection.
Parseable is also a stronger fit when the organization wants a more open observability architecture. Teams can route CloudWatch logs into Parseable through the OpenTelemetry Collector, then query and analyze them from a dedicated observability layer instead of keeping every workflow tied to CloudWatch Logs Insights.
Turn CloudWatch logs into a full observability workflow. Sign up for Parseable to query logs with SQL, AI assistance, dashboards, alerts, and long-term retention built in.
Conclusion
CloudWatch Logs Insights is the right place to start when teams need to query CloudWatch Logs quickly. It is AWS-native, convenient, and useful for short debugging workflows where the logs are already in CloudWatch.
Teams can select log groups, choose a time range, write a query, and inspect matching events without setting up another system. AWS also supports Logs Insights QL, OpenSearch PPL, and OpenSearch SQL for querying log data in supported workflows.
But CloudWatch Logs Insights should not always be the final query layer for production logs. Once log analysis becomes part of daily incident response, teams usually need more than quick searches. They need SQL-first querying, AI-assisted workflows, longer retention, and a cleaner way to connect logs with metrics, traces, dashboards, and alerts.
Parseable gives teams that path. CloudWatch logs can still originate in AWS, but teams can send them into Parseable through the OpenTelemetry Collector, query them with SQL and AI, and keep them connected with the rest of their telemetry.
That makes Parseable a better long-term layer when teams want to turn CloudWatch logs into a full observability workflow instead of a one-off debugging surface. Sign Up for free to see it in action.