

Kibana and Grafana are often compared because both help teams visualize and investigate operational data. But they are not built around the same idea.
Kibana is strongest when your data lives in Elasticsearch. It gives teams a native way to search logs, explore events, build dashboards, and analyze Elastic data. Grafana is stronger when your data is spread across different systems. It connects to sources like Prometheus, Loki, Tempo, CloudWatch, Elasticsearch, and SQL databases, then turns that data into dashboards and alerts.
So the Kibana vs Grafana decision is less about which tool has better charts and more about how your observability stack is built. If your workflow is Elasticsearch-first, Kibana usually makes more sense. If your team needs dashboards across multiple telemetry sources, Grafana is usually the better fit.
This guide compares Kibana and Grafana across logs, metrics, dashboards, alerting, query workflows, and architecture. It also covers where Parseable fits when teams want logs, metrics, and traces in one place instead of managing a fragmented observability backend.
Kibana vs Grafana: quick comparison
The simplest way to compare Kibana vs Grafana is to look at where each tool fits in the observability stack.
Kibana is best when the data already lives in Elasticsearch and the team needs search, filtering, dashboards, and Elastic-native analysis. Grafana is best when the team needs dashboards and alerts across multiple data sources, including Prometheus, Loki, Tempo, CloudWatch, Elasticsearch, and SQL databases.
| Category | Kibana | Grafana |
|---|---|---|
| Primary role | Search, exploration, dashboards, and analytics for Elasticsearch data | Dashboards, visualization, alerting, and exploration across many data sources |
| Native ecosystem | Elastic Stack | Grafana ecosystem and plugin-based data source model |
| Best-known use case | Log search, log analytics, Elasticsearch dashboards | Metrics dashboards, infrastructure monitoring, and multi-source observability |
| Main data source model | Primarily Elasticsearch | Prometheus, Loki, Tempo, Elasticsearch, CloudWatch, SQL databases, and other connected sources |
| Query language | KQL, Lucene, and ES|QL depending on the workflow | Depends on the connected data source, such as PromQL, LogQL, SQL, or Elasticsearch query syntax |
| Dashboards | Strong for Elasticsearch-based dashboards | Strong for flexible dashboards across multiple sources |
| Alerting | Strong inside Elastic workflows | Strong across connected data sources |
| Best fit | Teams already using Elasticsearch heavily | Teams that need one dashboard layer across several telemetry backends |
Kibana and Grafana are not exact replacements for each other. Kibana is the better fit when Elasticsearch is the main backend and teams need a native way to search, explore, and visualize that data. Grafana is the better fit when teams need a flexible dashboarding layer across different monitoring and observability tools.
Dashboards help teams see what is happening, but they do not always simplify the telemetry backend underneath. Parseable brings logs, metrics, and traces into one platform with SQL, PromQL, dashboards, alerts, and AI-assisted investigation. Sign up for Parseable.
What is Kibana?
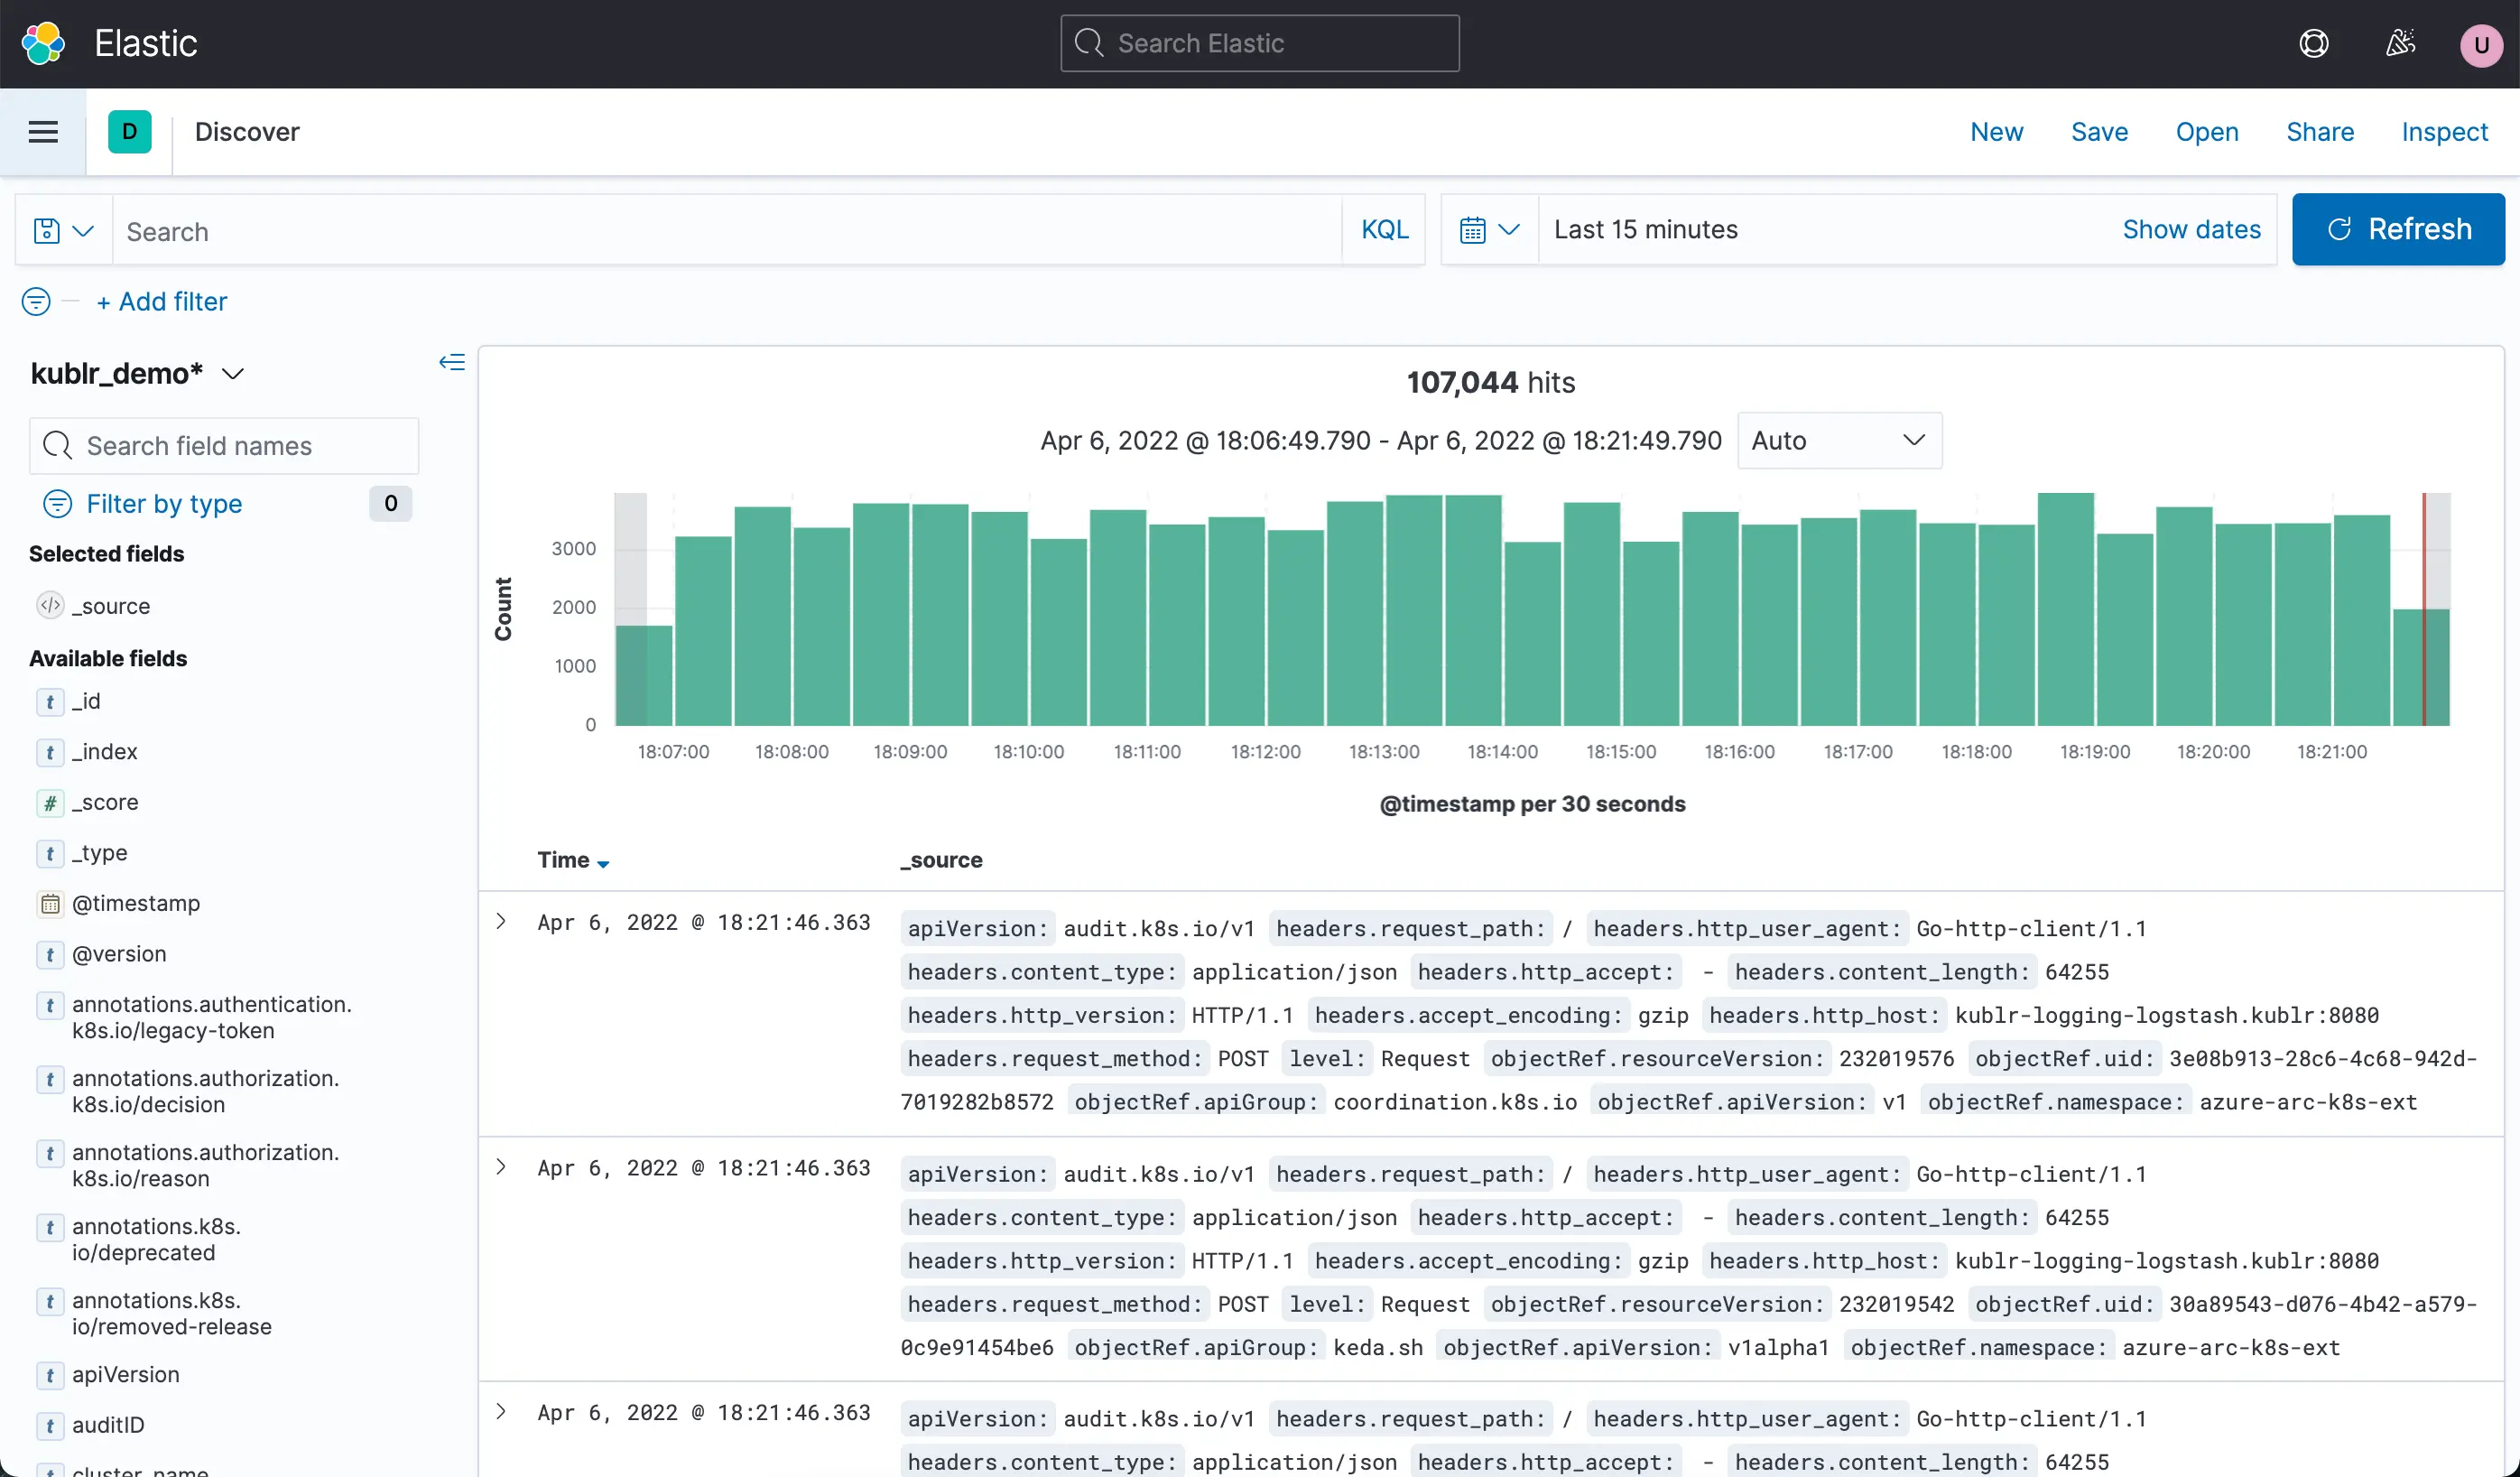
Kibana is the visualization and exploration interface for data stored in Elasticsearch. Teams use it to search logs, inspect events, build dashboards, create visualizations, and analyze operational data inside the Elastic Stack.
In a Kibana vs Grafana comparison, Kibana is best understood as the Elastic-native workspace. It works especially well when Elasticsearch is already the main backend for logs, security events, application data, or observability workflows.
Where Kibana works best
Kibana works best when the team is already using Elasticsearch as the core data store. If logs, events, and operational data are indexed in Elasticsearch, Kibana gives teams a natural way to search, filter, visualize, and investigate that data.
This is why Kibana vs Grafana for logs is not always a simple dashboarding decision. Kibana is often stronger for search-heavy log exploration, especially when teams need to inspect raw events, filter fields, and move through Elasticsearch data quickly.
Grafana can also visualize Elasticsearch data, but Kibana usually gives a more native experience when the workflow is built around Elasticsearch itself.
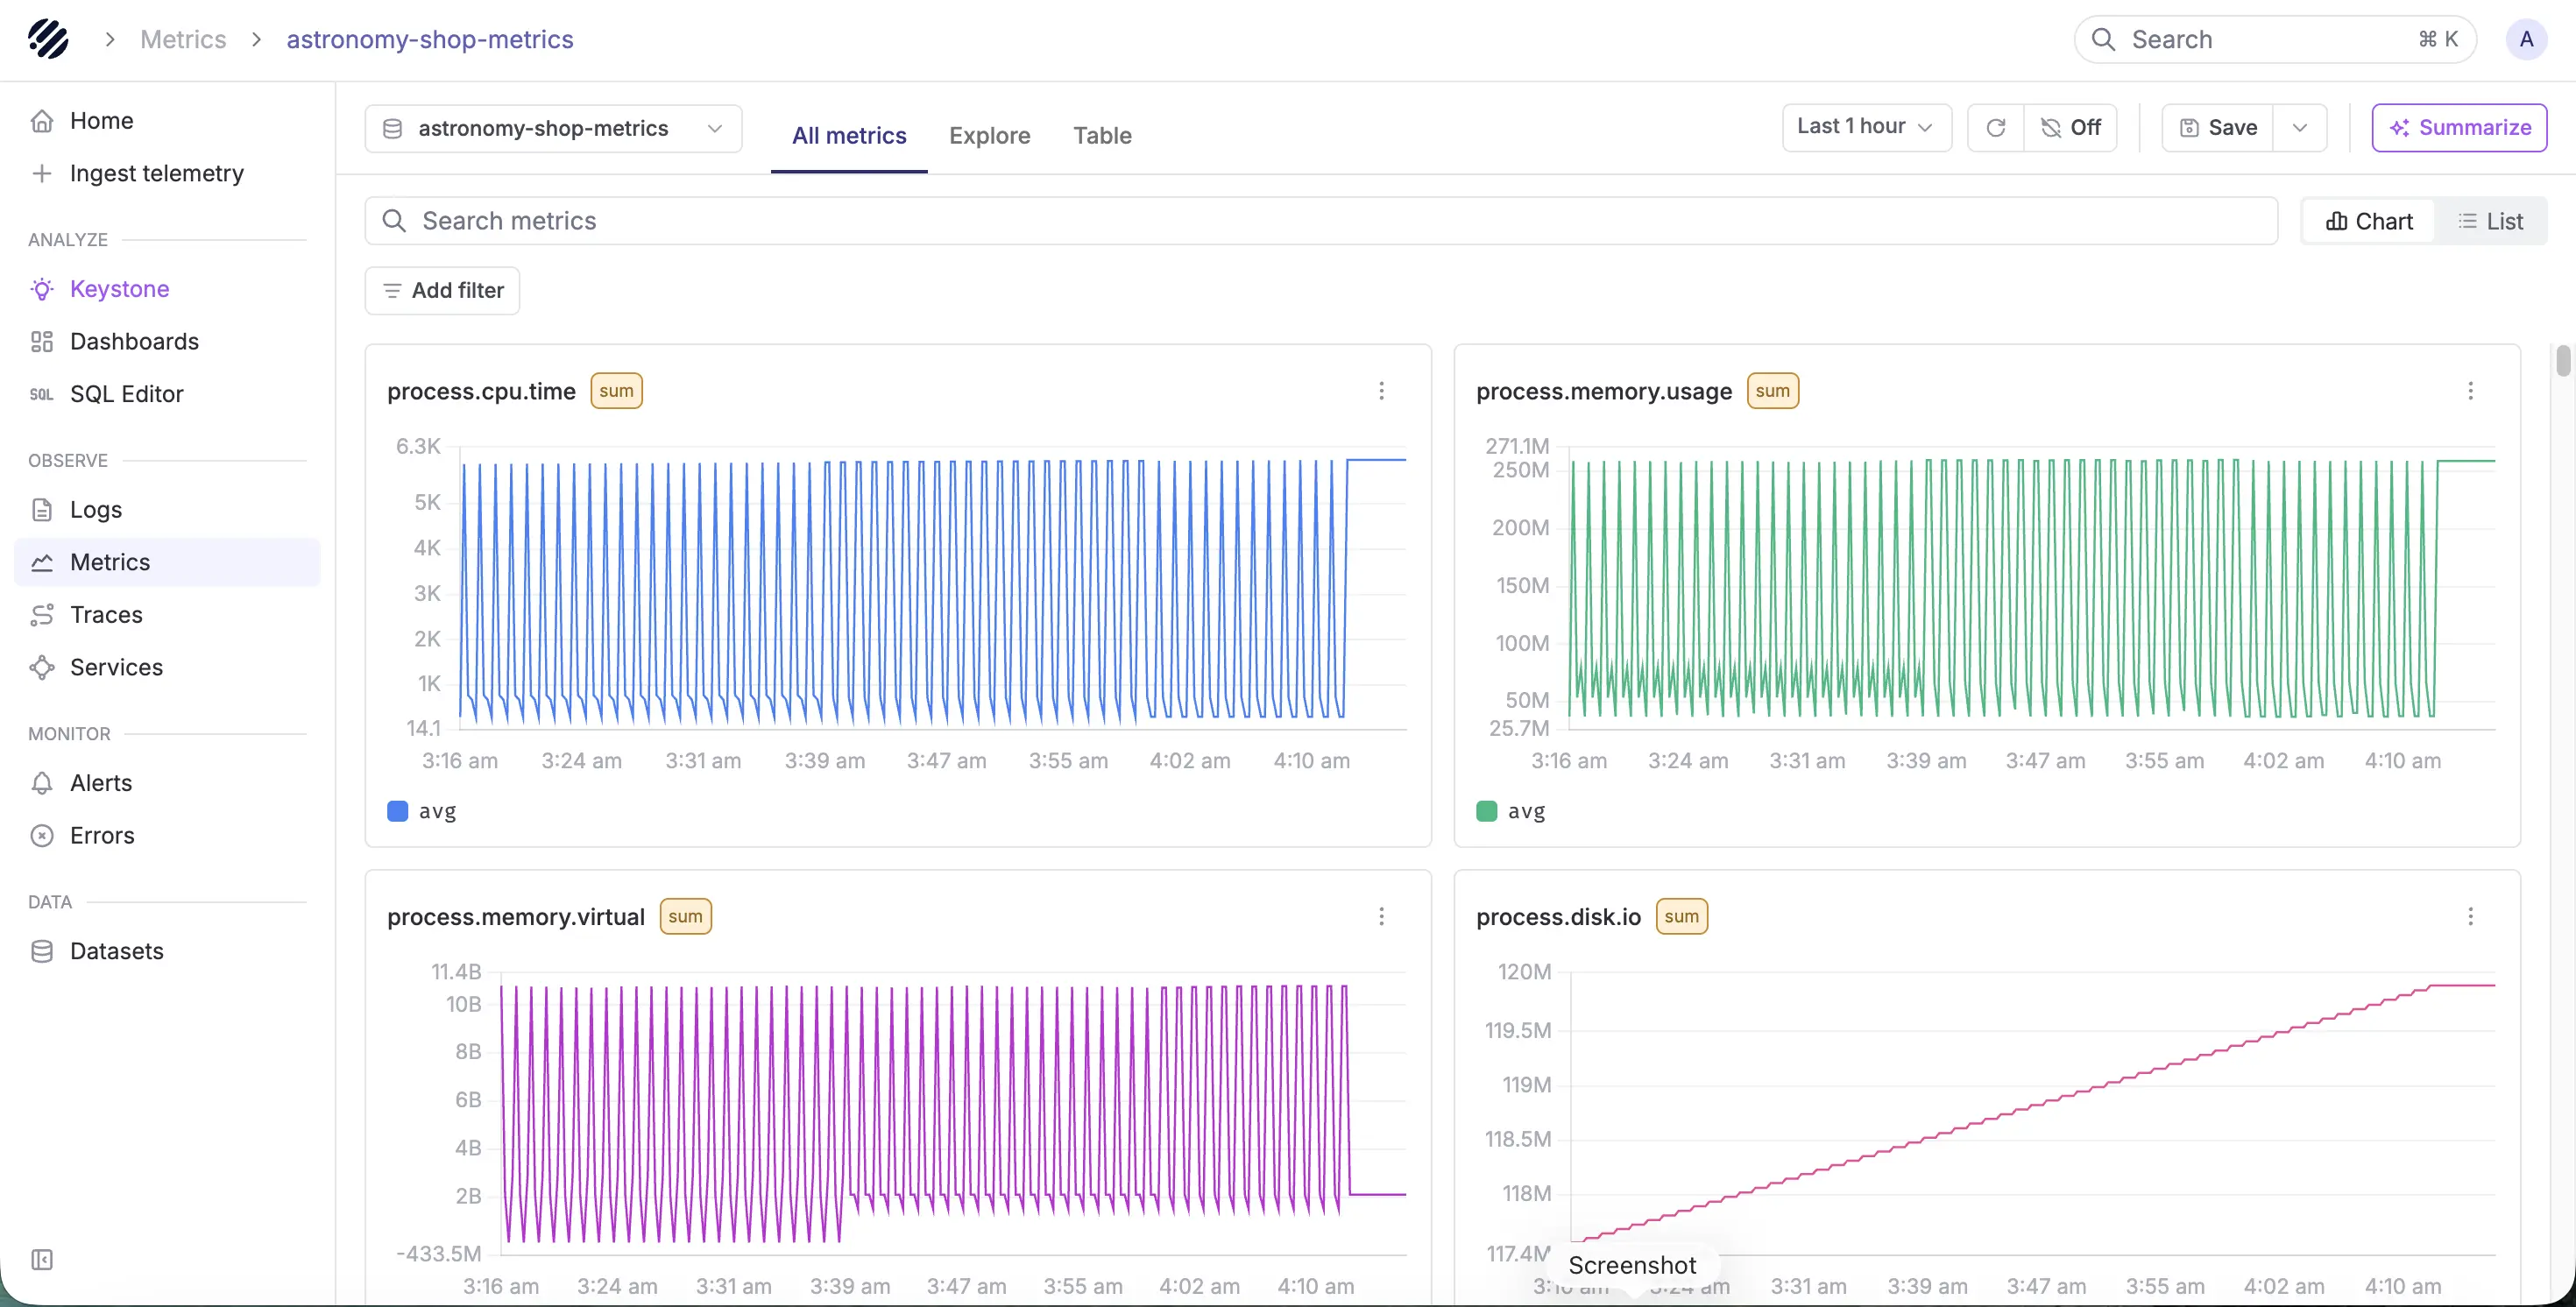
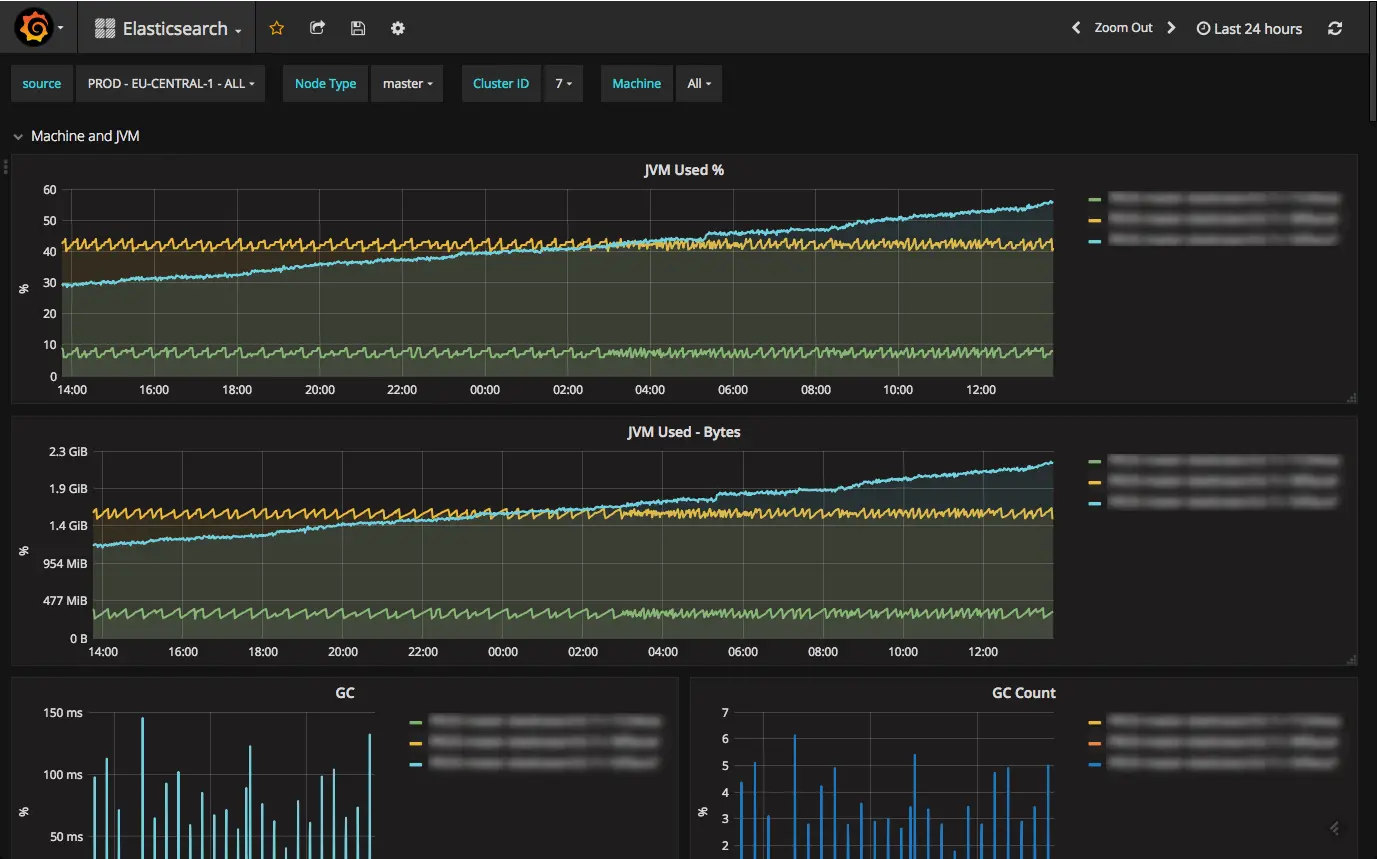
What is Grafana?
Grafana is an open-source visualization, dashboarding, alerting, and data exploration platform. In a Kibana vs Grafana comparison, Grafana is best understood as the flexible visual layer that can connect to many different data sources, not just one backend.
Teams use Grafana to build dashboards, create alerts, monitor infrastructure, explore incidents, and bring data from different systems into one operational view. It is commonly used with Prometheus for metrics, Loki for logs, Tempo for traces, CloudWatch for cloud monitoring, Elasticsearch for search data, and SQL databases for operational data.
Where Grafana works best
Grafana works best when teams need dashboards across multiple data sources. If the observability stack includes Prometheus for metrics, Loki for logs, Tempo for traces, CloudWatch for cloud data, and Elasticsearch for search data, Grafana gives teams one flexible interface to visualize and explore those systems.
This is where Grafana vs Kibana becomes clearer. Kibana is stronger when the workflow is centered on Elasticsearch. Grafana is stronger when the team needs one dashboard layer across several telemetry backends.
For teams comparing Kibana and Grafana for monitoring, Grafana is usually the better fit when metrics dashboards, infrastructure views, and cross-source alerting are the main requirements.
Kibana vs Grafana: key differences
The biggest difference between Kibana and Grafana is the backend model behind each tool. Here’s a feature-by-feature comparison between the two:
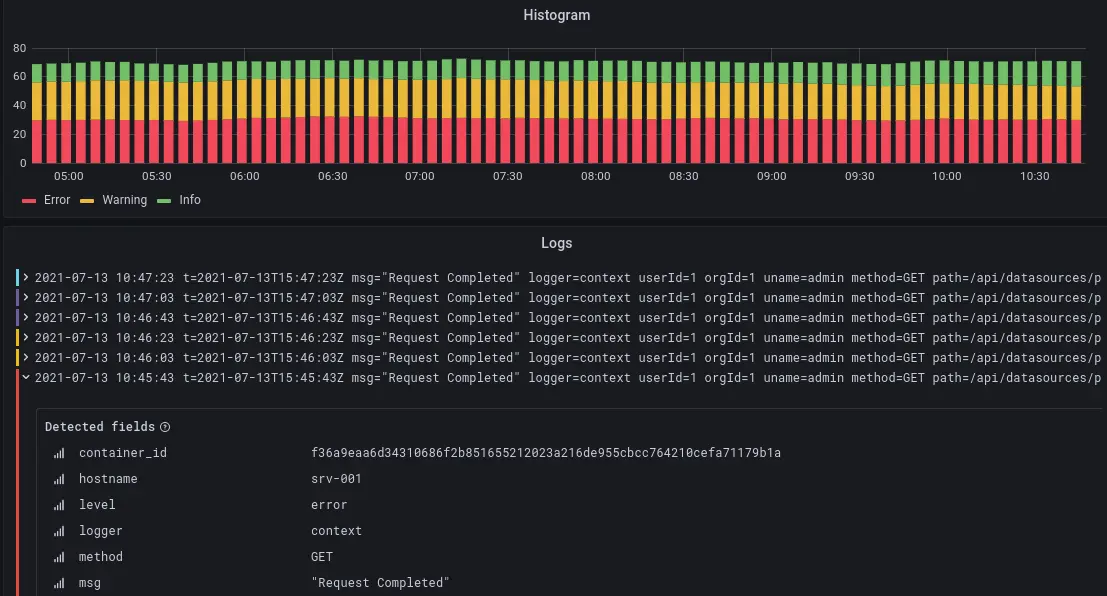
Kibana vs Grafana for logs
Log analysis is where Kibana and Grafana feel very different.
Kibana is usually the better fit when logs are already stored in Elasticsearch. Grafana is better when logs need to be viewed beside metrics, traces, and other telemetry sources.
So, the Kibana vs Grafana for logs decision depends less on the UI and more on the backend behind it.
Use Kibana when logs are already in Elasticsearch
Kibana gives teams a native way to search, filter, and inspect logs stored in Elasticsearch. This makes it useful for search-heavy log analysis, especially when engineers need to move through raw events, inspect fields, apply filters, and look for patterns across indexed log data.
This works well for teams that already use the Elastic Stack for application logs, infrastructure logs, security events, or operational data. Instead of connecting another tool, they can use Kibana Discover and dashboards to investigate logs directly from Elasticsearch.
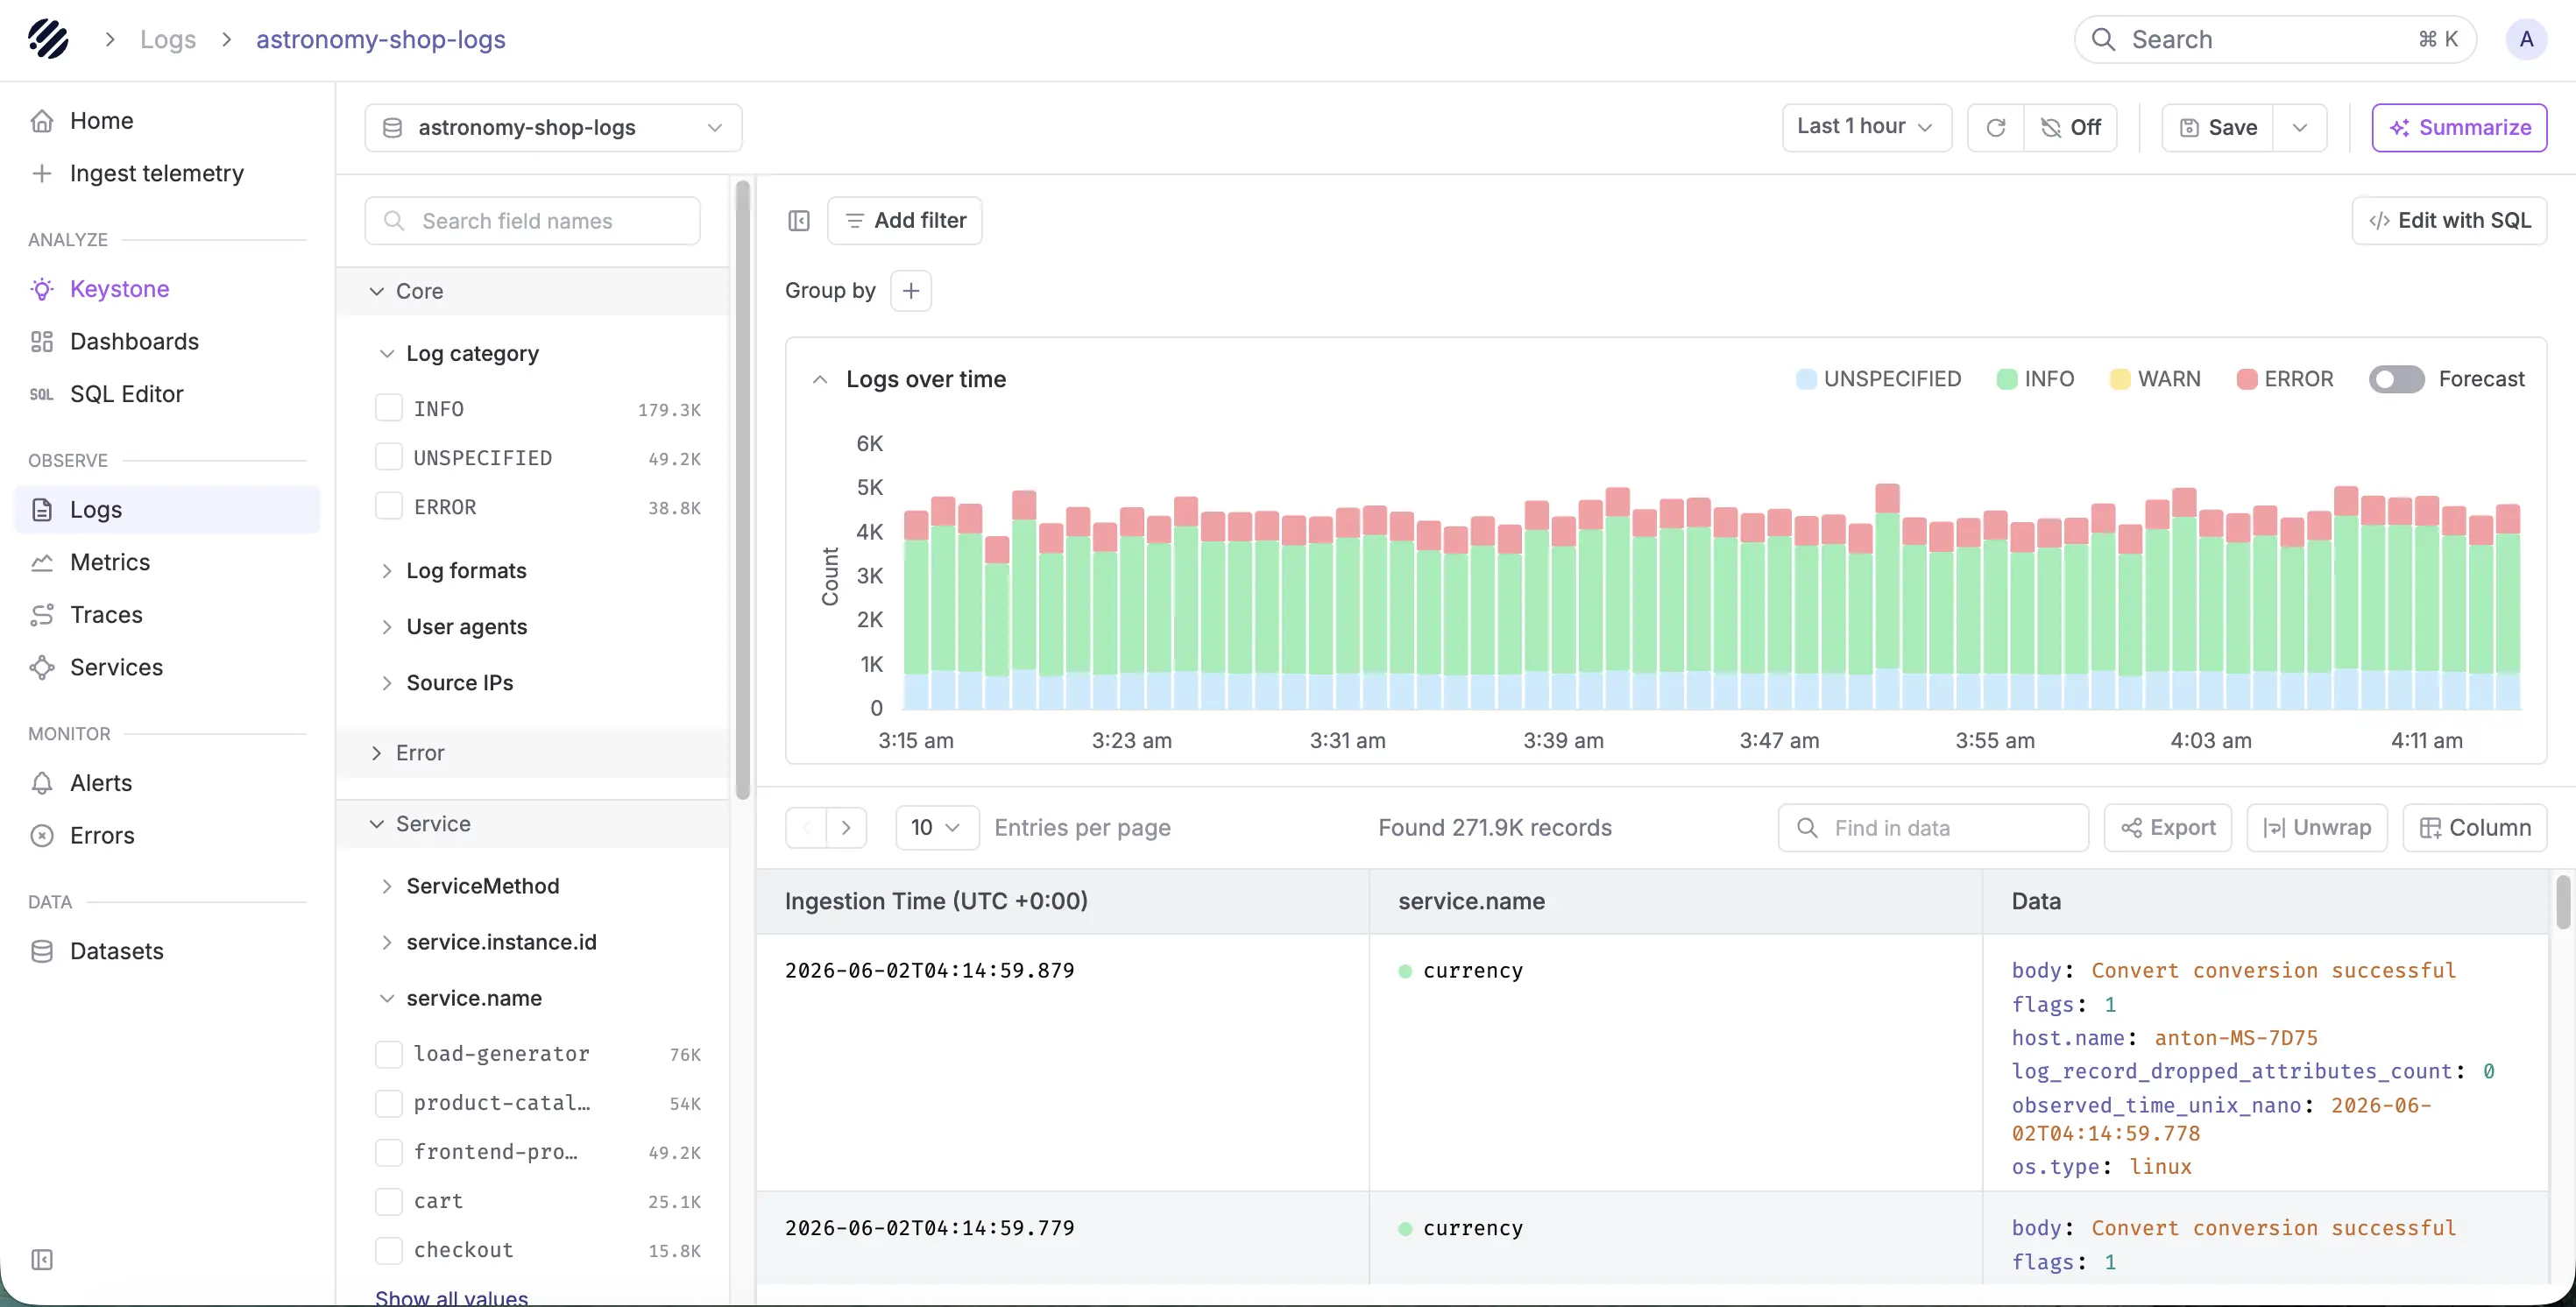
Use Grafana when logs need to sit beside metrics and traces
Grafana is useful when logs are only one part of the investigation. In many incidents, teams start with a metric spike, move into logs, and then check traces to understand what happened across services.
This is where Grafana becomes useful. It can show logs from connected backends such as Loki or Elasticsearch and place them near metrics, traces, and dashboard panels from other sources. That makes Grafana a better fit when teams want logs inside a broader monitoring workflow rather than a purely search-heavy log analysis workflow.
If your team already uses Grafana dashboards for monitoring, adding logs into Grafana can make incident review easier. But the log experience still depends on the backend connected to Grafana.
Where Parseable fits for log analysis
Kibana is strong for Elasticsearch-based log search. Grafana is strong for bringing logs into a broader dashboarding workflow. Parseable fits when teams want the log backend itself to be simpler and more connected.
With Parseable, teams can keep logs, metrics, and traces in one observability layer, query logs with SQL, use PromQL for metrics, and investigate related telemetry without spreading the workflow across separate systems.
This is useful when the problem is not just Kibana vs Grafana, but the growing complexity underneath both tools. If logs live in one backend, metrics in another, and traces in another, dashboards may look unified while the investigation still feels fragmented.
For log-heavy teams, Parseable becomes a better fit when they need SQL-based log analysis, longer-term telemetry retention, and unified observability capabilities like dashboards, alerts, and anomaly detection in the same platform.
If log investigations are already spread across too many tools, sign up for Parseable to keep logs, metrics, and traces connected in one telemetry layer.
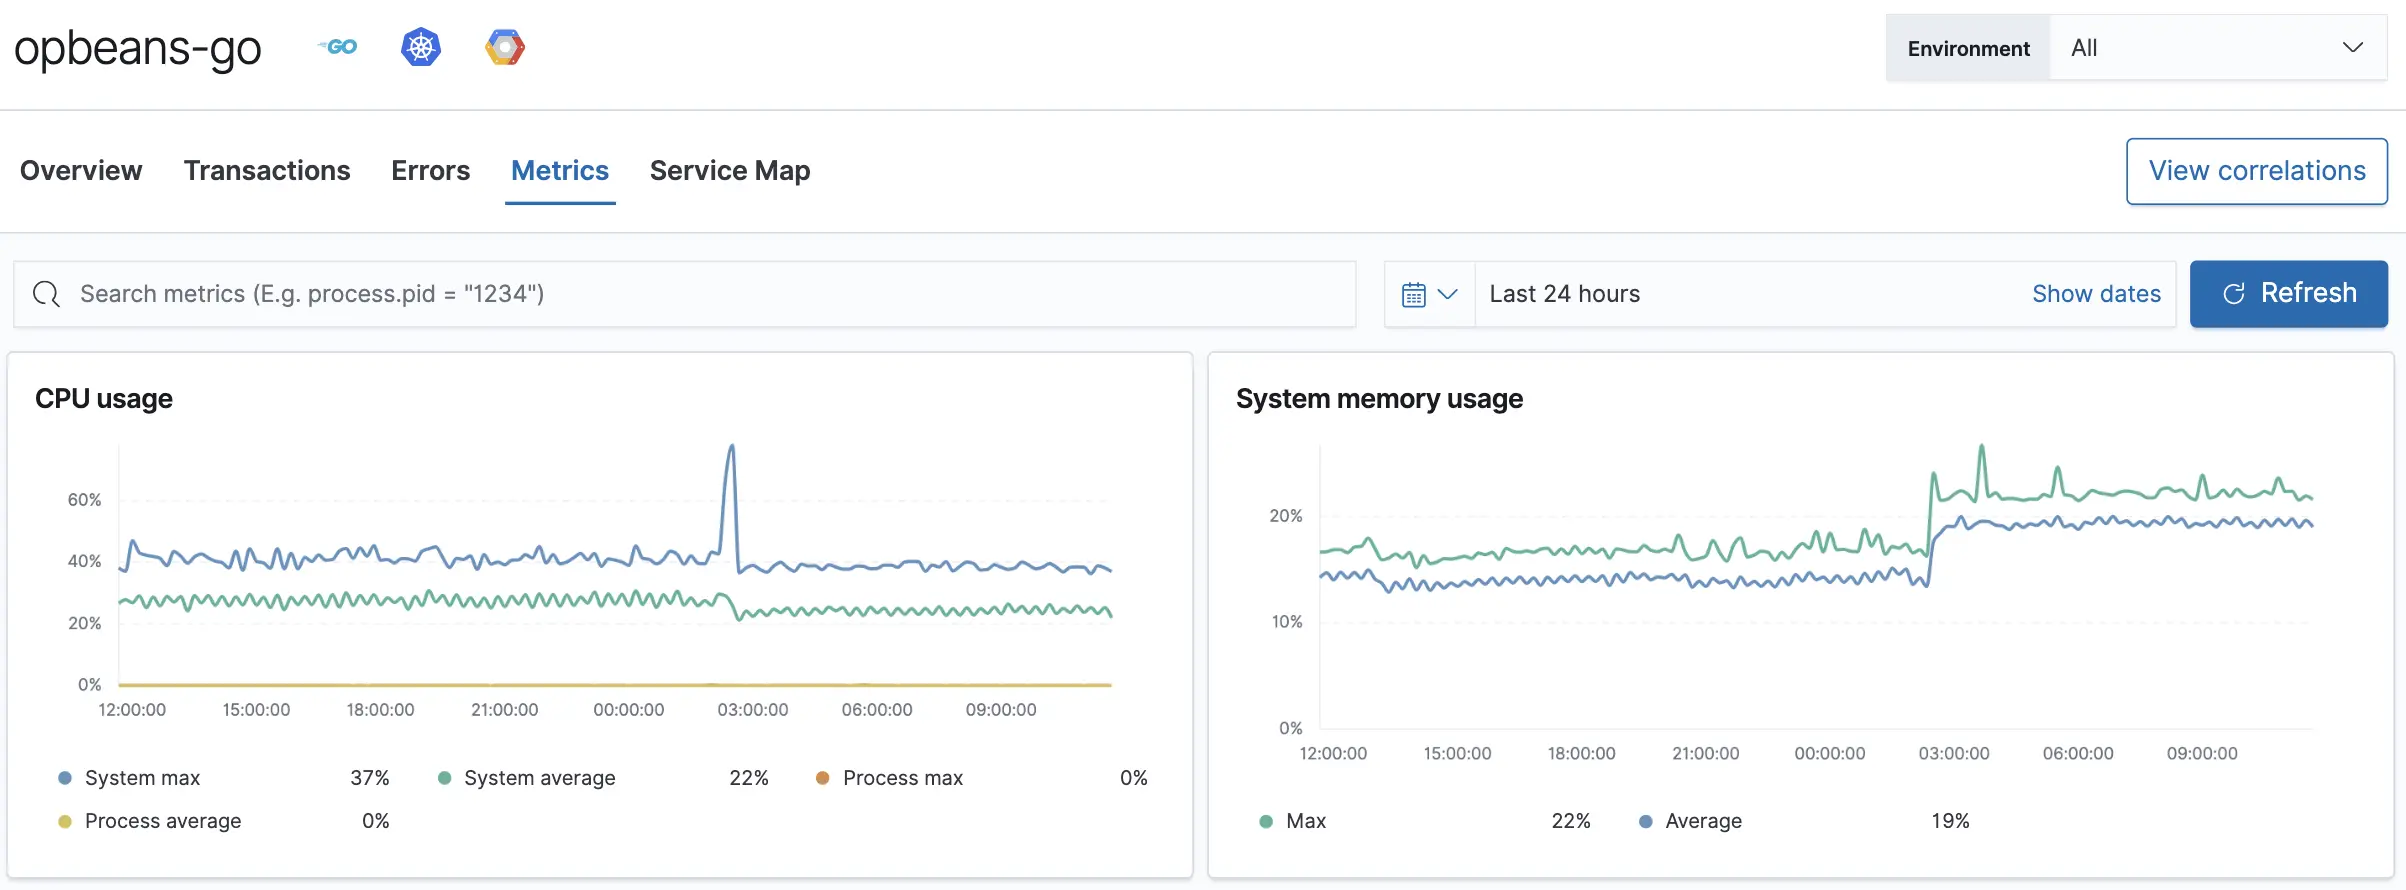
Kibana vs Grafana for metrics
Kibana can support metrics workflows when teams are already using Elastic Observability or storing metric data in Elasticsearch. But Grafana is more commonly used for metrics dashboards, especially when teams rely on Prometheus, Kubernetes, infrastructure exporters, cloud monitoring tools, and time-series databases.
Use Kibana when metrics are already part of Elastic
Kibana can visualize and analyze metrics inside Elastic workflows. This works well when teams already use Elastic for logs, infrastructure monitoring, APM, or security analytics and want metrics to stay close to the rest of their Elasticsearch data.
For Elastic-first teams, this can keep the workflow simple. Logs, events, metrics, and alerts remain inside the same ecosystem.
Use Grafana when metrics dashboards are the main workflow
Grafana is usually the more natural choice when metrics monitoring is the primary requirement. It is widely used with Prometheus and other time-series backends to build dashboards for infrastructure, Kubernetes, applications, databases, queues, APIs, and cloud services.
This is where Kibana vs Grafana for monitoring becomes more clear. Kibana works well when metrics are part of an Elastic-first workflow. Grafana works better when the team wants flexible metrics dashboards across many backends.
Where Parseable fits for metrics
Grafana is strong for metrics dashboards, and Kibana can work well for metrics inside Elastic. Parseable fits when teams want metrics to stay connected with logs and traces in the same observability layer.
Parseable supports PromQL for metrics and SQL for deeper telemetry analysis. That means teams can keep familiar Prometheus-style metric queries while also investigating related logs, traces, and events from the same platform.
This is useful when a metric shows the symptom, but the root cause lives somewhere else. For example, a latency spike may appear in a metrics dashboard, but the explanation may require logs from the same service, traces across dependent services, or deployment events from the same time window.
For metrics-heavy teams, Parseable becomes a better fit when they need:
- PromQL-based metric querying.
- SQL-based telemetry analysis.
- Metrics connected with logs and traces.
- Dashboards and alerts on the same platform.
- Fewer separate backends for metrics, logs, and traces.
Metrics dashboards are useful, but incidents rarely stop at metrics. Parseable lets teams query metrics with PromQL, investigate related telemetry with SQL, and keep logs and traces connected. Sign up for Parseable.
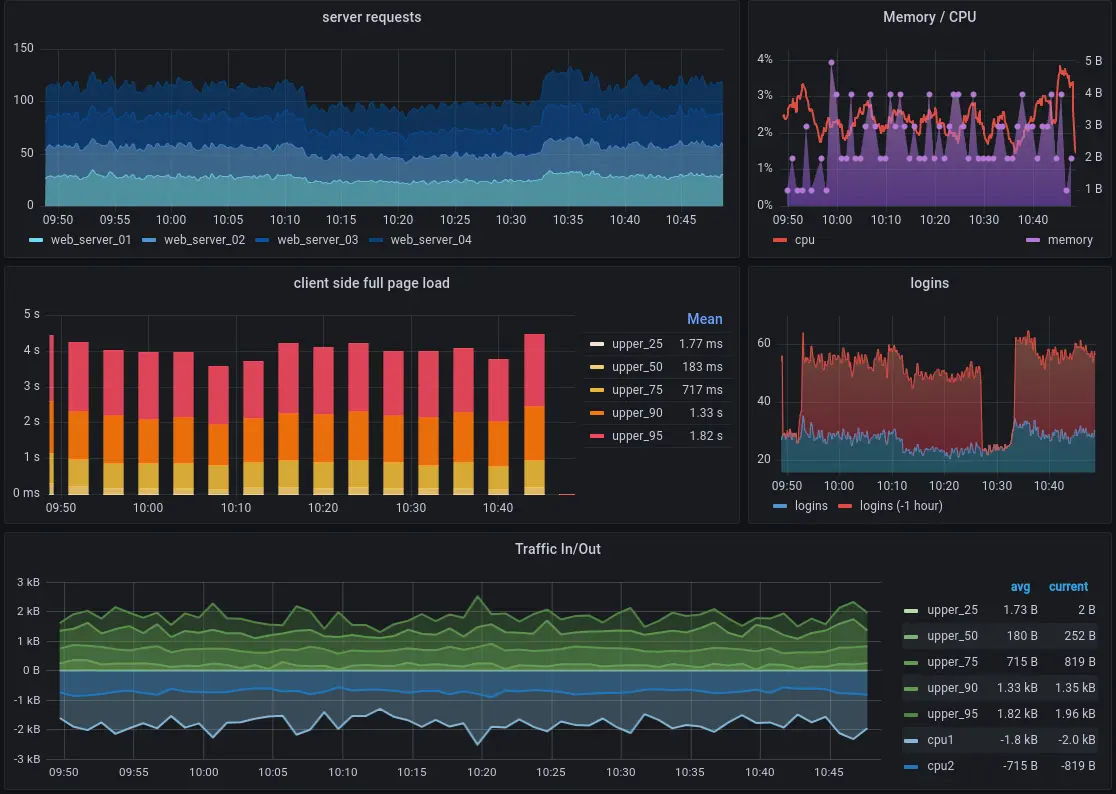
Kibana vs Grafana for dashboards and visualization
Both Kibana and Grafana are strong dashboarding tools, but they are built around different dashboarding models.
Kibana dashboards work best when the data comes from Elasticsearch. Grafana dashboards work best when the team needs to visualize data from multiple sources in one place.
Use Kibana for Elasticsearch-backed dashboards
Kibana is a strong fit when dashboards are built from Elasticsearch data. Teams can create dashboards for logs, events, infrastructure signals, security data, and application behavior using Kibana visualizations and Lens.
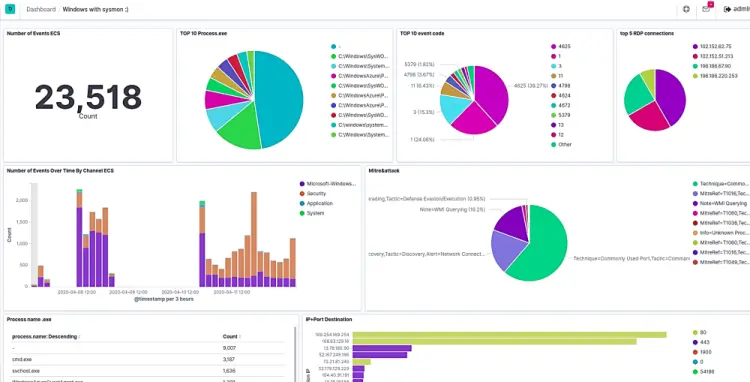
Kibana dashboards are useful when teams need to:
- Visualize log trends from Elasticsearch.
- Build dashboards from Discover sessions or saved visualizations.
- Add charts, tables, metrics, maps, and annotations to dashboards.
- Analyze Elastic Observability or Elastic Security data.
- Keep search, filtering, visualization, and dashboarding inside the Elastic Stack.
This makes Kibana a better fit when the dashboard is tied closely to Elasticsearch data and teams want an Elastic-native visualization workflow.
Use Grafana for multi-source dashboards
Grafana is usually better when dashboards need to combine data from several systems. A single Grafana dashboard can pull data from sources such as Prometheus, Loki, Tempo, CloudWatch, Elasticsearch, and SQL databases, depending on the configured data sources.
Grafana dashboards are useful when teams need to:
- Visualize Prometheus metrics.
- Build infrastructure and Kubernetes monitoring dashboards.
- Combine metrics, logs, traces, and cloud monitoring data.
- Create SRE, DevOps, and platform engineering dashboards.
- Build dashboards across multiple connected data sources.
- Track service health, latency, error rate, throughput, and resource usage.
This is why Grafana is often the better choice for dashboard-heavy monitoring workflows. It gives teams one visual layer across different telemetry systems.
Where Parseable fits for dashboards
Kibana and Grafana help teams visualize data, but dashboards are only as useful as the backend behind them. If logs, metrics, and traces are spread across separate systems, dashboards may look unified while investigations still require switching between backends, query languages, and retention models.
Parseable helps by keeping logs, metrics, and traces in one observability platform. Teams can build dashboards inside Parseable, query telemetry with SQL and PromQL, and still use Grafana where existing dashboards already work.
This makes Parseable useful when teams want dashboards backed by a more unified telemetry layer rather than a growing collection of separate systems.
Kibana vs Grafana for alerting
Alerting is another area where Kibana and Grafana overlap, but the better choice depends on where the alert data comes from.
Use Kibana when alerts are built around Elastic data
Kibana lets teams create and manage rules that monitor Elasticsearch data and trigger actions when conditions are met. This makes it useful for alerting on logs, events, security signals, infrastructure data, and Elastic Observability workflows.
Kibana is a good fit for alerting when teams need to:
- Alert on Elasticsearch data.
- Monitor log patterns, errors, and event conditions.
- Create alerts inside Elastic Observability or Elastic Security.
- Use connectors for third-party alerting or incident workflows.
- Keep alerting close to Elastic dashboards and searches.
For teams already using Elastic as the system of record, Kibana alerting keeps the workflow close to the data.
Use Grafana when alerts need to work across data sources
Grafana alerting is usually stronger when teams need one alerting layer across multiple sources. Grafana can create and manage alert rules for metrics or log entries from different data sources, which makes it useful for teams that already use Grafana as their main monitoring interface.
Grafana is a good fit for alerting when teams need to:
- Alert on Prometheus metrics.
- Create alerts across multiple connected data sources.
- Manage notification routing and contact points.
- Tie alerts back to dashboards and panels.
- Support SRE, DevOps, and platform engineering workflows.
This is where Kibana vs Grafana for alerting becomes clearer. Kibana is stronger when alerting is Elastic-first. Grafana is stronger when alerting needs to span several monitoring backends.
Where Parseable fits for alerting
Parseable fits when teams want alerting closer to a unified telemetry layer. Instead of keeping logs, metrics, and traces in separate systems, Parseable keeps them connected and supports dashboards, alerts, anomaly detection, SQL, PromQL, and AI-assisted investigation in one platform.
This matters because alerts are only useful when teams can quickly move from the alert to the context behind it. If a latency alert fires, engineers should be able to inspect related metrics, logs, and traces without jumping across separate systems.
For teams comparing Kibana vs Grafana, Parseable becomes relevant when the alerting issue is not just where to define rules, but how to keep the investigation connected after an alert fires.
A better long-term observability layer: Parseable
Kibana and Grafana solve important parts of the observability workflow. Kibana gives Elasticsearch-first teams a strong way to search, explore, and visualize indexed data. Grafana gives teams a flexible dashboard layer across multiple data sources.
But when teams compare Kibana vs Grafana because their observability stack is becoming harder to manage, the issue is often deeper than the UI. Logs, metrics, and traces may already be spread across different backends, each with its own query language, retention model, and scaling behavior.
Parseable fits at that layer. It gives teams one observability platform for logs, metrics, and traces, with SQL, PromQL, dashboards, alerts, anomaly detection, and AI-assisted investigation.
Bring logs, metrics, and traces into one platform
Parseable is built for teams that want telemetry in one place instead of maintaining separate systems for every signal.
In a traditional setup, logs may live in Elasticsearch or Loki, metrics may live in Prometheus, traces may live in Tempo or Jaeger, and dashboards may live in Grafana. That can work, but it also creates more systems to operate.
Parseable gives teams a different model:
Connect your data source —> Parseable —> Unified observability with AI-powered query analysis, alerts and more.
This does not mean Kibana or Grafana are bad tools. It means Parseable is useful when the team wants the telemetry backend itself to be more unified.
Query telemetry with SQL and PromQL
One of Parseable’s strongest advantages is that teams do not have to choose between SQL and PromQL.
SQL is useful for log analysis, trace investigation, event exploration, and high-cardinality telemetry. PromQL is useful for metrics workflows, especially for teams already familiar with Prometheus-style monitoring.
With Parseable, teams can use both:
- SQL for logs, traces, events, and deeper telemetry analysis.
- PromQL for metrics and Prometheus-compatible workflows.
- Plain-English querying when teams want to move from question to query faster.
This is important because query-language sprawl is one of the common problems in a growing Kibana and Grafana stack. Teams may use KQL or ES|QL in Kibana, PromQL in Grafana, LogQL for logs, and another query model for traces. Parseable reduces that friction by giving teams a more consistent query layer across telemetry.
Use Grafana where it already works
Parseable does not need to replace Grafana in every workflow.
If teams already have mature Grafana dashboards, they can keep using them where they work. Parseable can sit underneath as the telemetry layer for storage, querying, and investigation, while Grafana continues to serve dashboard-heavy workflows.
This is a better way to frame the Grafana vs Kibana decision. Grafana remains useful as a visualization layer. Parseable becomes useful when the team wants to simplify the backend that Grafana depends on.
Reduce dependence on Elasticsearch-heavy log storage
Kibana is strongest when logs and events are already in Elasticsearch. That is a good fit for many teams, especially when search-heavy log exploration is the main workflow.
But Elasticsearch-heavy log architectures can become harder to manage as telemetry volume and retention requirements grow. Teams may need to tune indexes, control storage growth, manage retention, and decide what data stays searchable.
Parseable is useful when teams want a more open telemetry architecture. It stores telemetry in Apache Parquet on object storage and gives teams SQL-based analysis on top. This makes it a better fit for long-term telemetry workflows where cost, retention, and query flexibility matter.
Use AI-assisted investigation when speed matters
During an incident, engineers do not always want to build a query from scratch. They usually know the question they want to answer, but not always the exact query syntax.
Parseable’s AI-assisted workflow helps teams generate SQL queries and dashboards faster using natural language.
This is useful when teams need faster investigation across logs, metrics, and traces without switching between several tools and query languages.
When Parseable makes more sense
Parseable is a better fit when the team’s observability problem is not just dashboarding, but backend complexity.
Use Parseable when:
- Logs, metrics, and traces need to stay connected.
- The team wants SQL and PromQL in the same platform.
- Engineers need AI-assisted querying during investigations.
- Long-term retention and storage cost matter.
- The team wants dashboards, alerts, and anomaly detection close to the data.
- The organization wants fewer separate backends for production observability.
Kibana is strong for Elasticsearch-native analysis. Grafana is strong for dashboards across connected sources. Parseable is stronger when teams want the telemetry layer itself to be unified.
Keep the dashboards that work, but simplify the telemetry layer underneath. Parseable gives teams unified logs, metrics, traces, SQL, PromQL, dashboards, alerts, and AI-assisted investigation in one platform. Sign up for Parseable.
Conclusion
Kibana and Grafana are both strong tools, but they solve different problems.
Kibana is the better fit when your observability workflow is built around Elasticsearch. It works well for search-heavy log analysis, event exploration, Elastic dashboards, and teams that already use the Elastic Stack as their main backend.
Grafana is the better fit when your team needs dashboards and alerts across multiple data sources. It works well for Prometheus metrics, infrastructure monitoring, Kubernetes dashboards, cloud data, logs, traces, and other connected systems.
So the real Kibana vs Grafana decision comes down to your architecture. If your data lives mostly in Elasticsearch, Kibana usually makes more sense. If your telemetry is spread across multiple backends, Grafana gives you a more flexible visualization layer.
But if the real problem is backend sprawl, query-language fragmentation, or disconnected logs, metrics, and traces, neither Kibana nor Grafana fully solves that alone. That is where Parseable becomes the cleaner long-term layer.
Parseable gives teams one observability platform for logs, metrics, and traces, with SQL, PromQL, dashboards, alerts, anomaly detection, and AI-assisted investigation. Teams can still keep Grafana where it already works, while using Parseable to simplify the telemetry layer underneath.
If your team is comparing Kibana and Grafana because your observability stack is getting harder to manage, Parseable gives you a more unified path forward. Sign up for Parseable to bring logs, metrics, traces, SQL, PromQL, dashboards, alerts, and AI-assisted investigation into one platform.

