Deploying an AI agent isn’t very different from hiring a new human customer support agent. You bring them up to speed on context, handle the knowledge transfer, train them, and - once you believe they’re ready - push them to face your customers.
Chances are, they do a good job.
Until they don’t.
When AI agents go MIA.
One day, you face an angry customer because your AI agent responded with fluff. You step in to find the root cause.
This is where distributed tracing comes in.
Think you found the root cause? Think again.
Given the non-deterministic behavior of AI agents, ideal observability must extend far beyond LLM prompts, token counts, and model calls. Traces must deeply penetrate the tools, services, and core infrastructure - the aquifer where corrupted data or state failures emerge to pollute the agent's reasoning and cause the error to burst to the production surface.
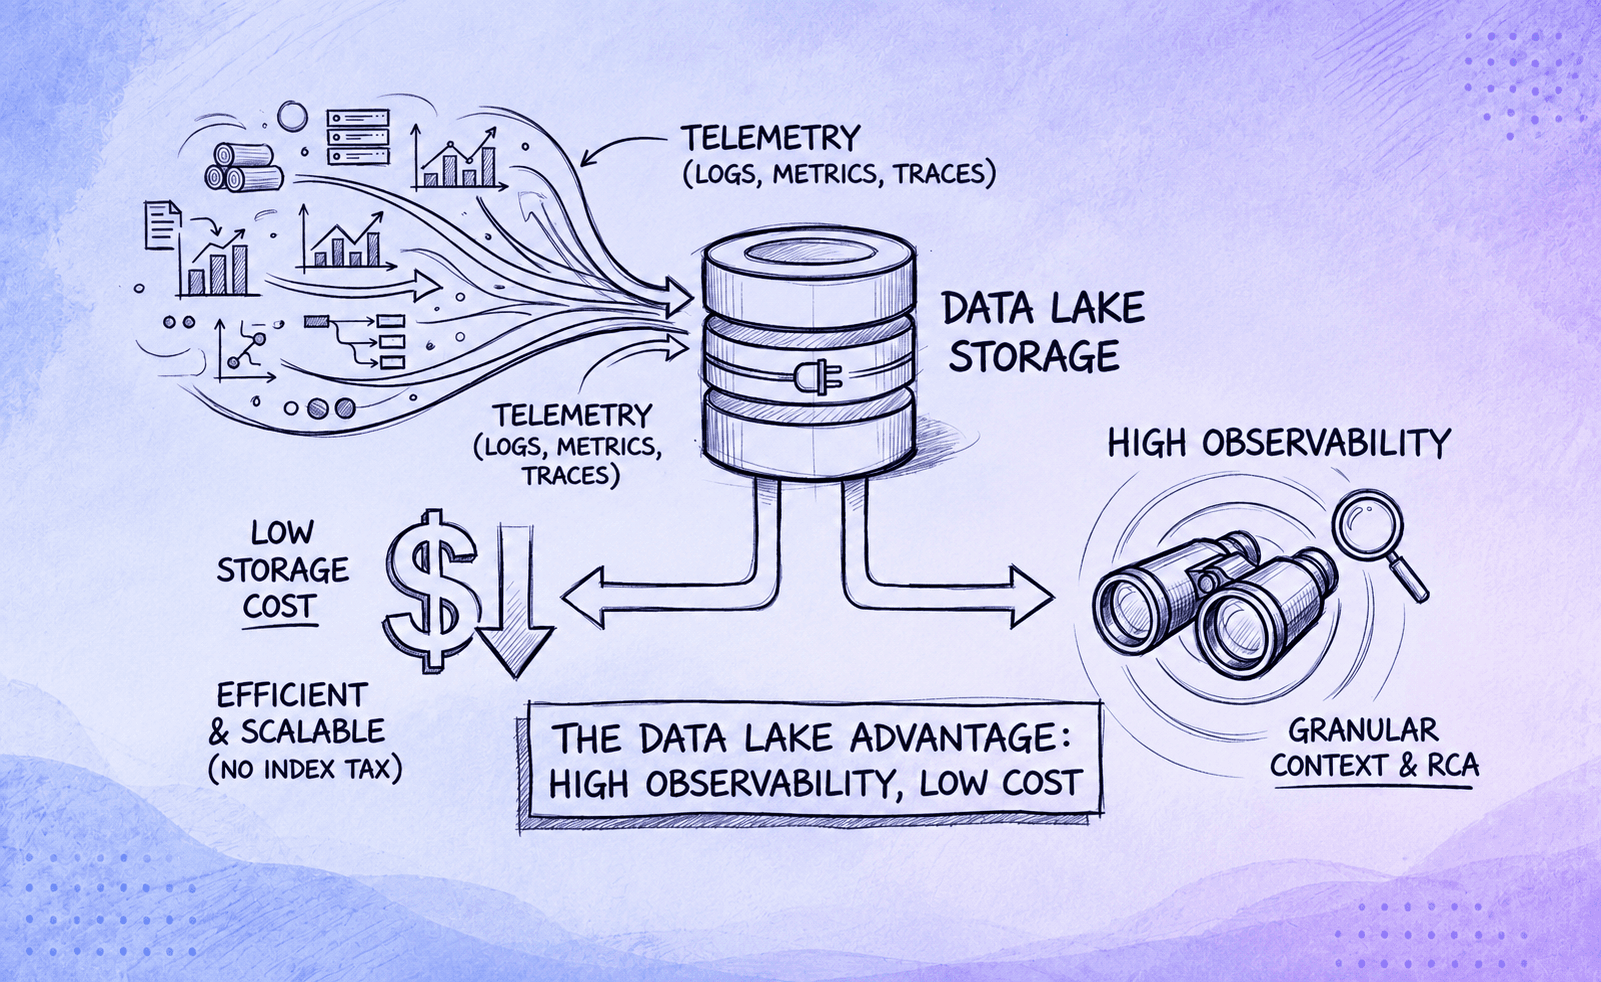
Enter data lakes.
Data lakes: heterogeneous data, better distributed tracing.
AI agent telemetry comes from three layers - the first from the front stack (what the customer faced), the second from the middle stack (AI models, LLM prompts, tokens, even other services), and the last from the bottom stack (infrastructure). Instrumentation gives each of these layers three observability pillars - logs, metrics, and traces.
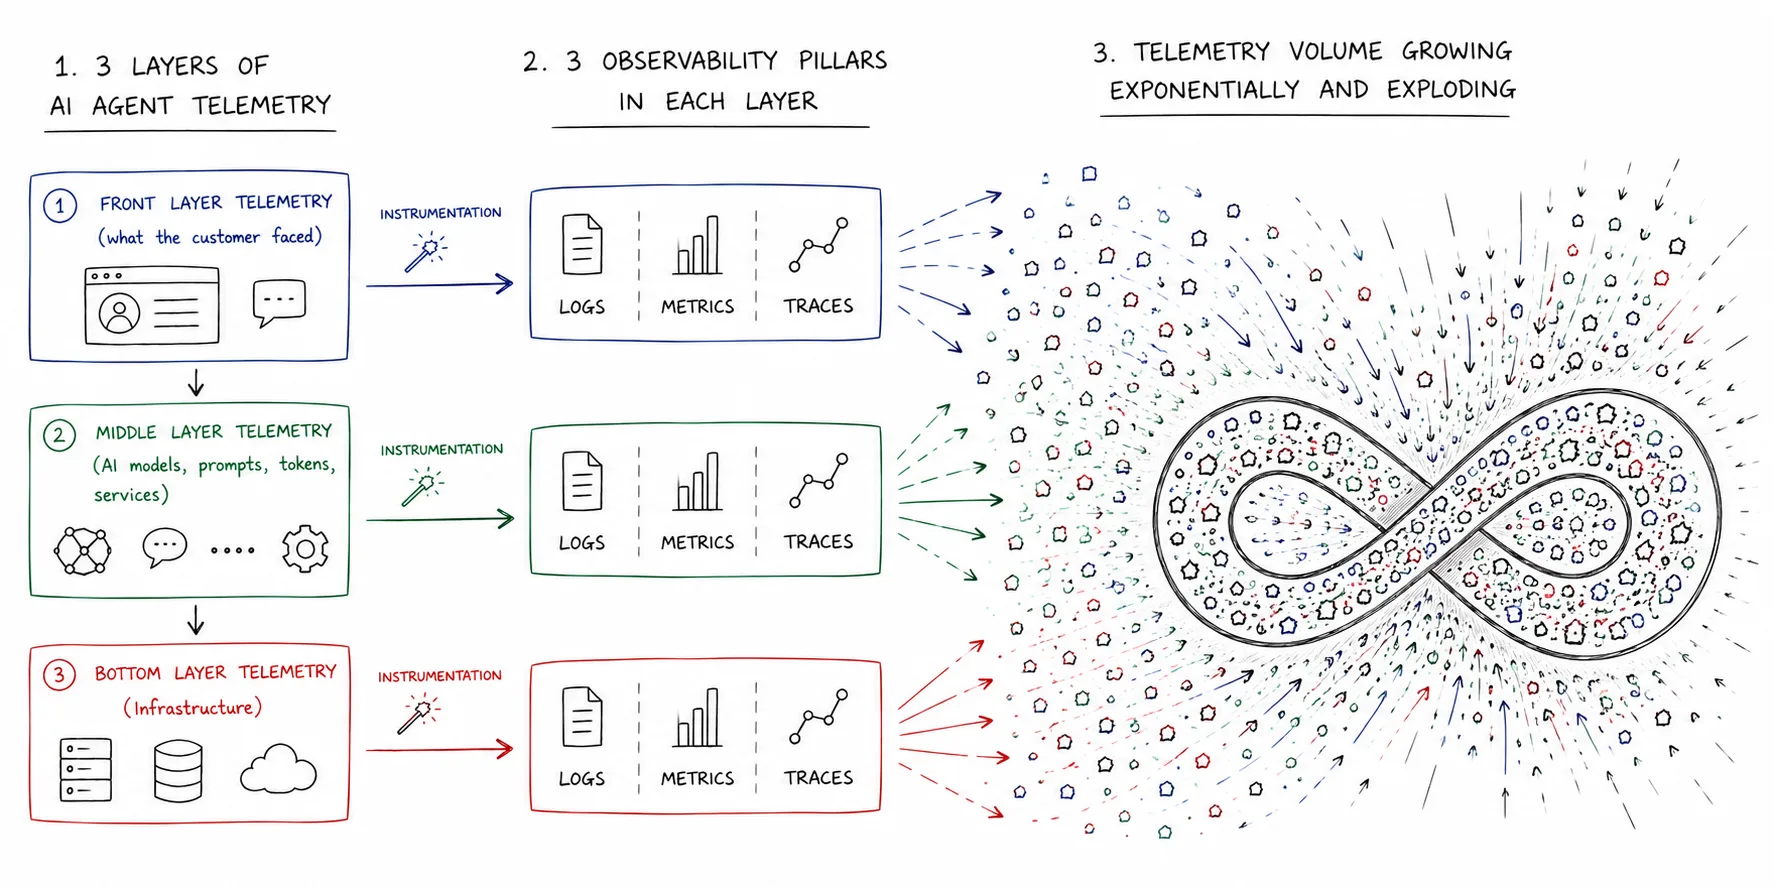
The catch: with AI agents, telemetry volume shoots up tremendously. Add layers and pillars to this volume, and you get a massive, exponentially growing, explosive potpourri of different data types.
Observability bane: high data segmentation, low data retention.
Many observability tools out there catch only the pillars right out of the box during data ingestion, compile them, and store them in siloes. Logs are formatted as logs and stored in one database with document-store search index schema. Metrics are aggregated and stored in a time-series database with TSDB schema. Traces go into a graph database with parent-child index schema.
It doesn’t end with telemetry-siloing. Traditional observability tools that use DB as storage don’t capture telemetry from all three layers - it’s either one layer, or maximum two. Two layers create a further double-silo trouble - they segregate data horizontally by telemetry type (logs vs. metrics vs. traces) and vertically by architectural layer (frontend vs. middle vs. infrastructure).
When data is split up and stored in segmented database silos, they come with heavy index baggage to enable quick search queries. When data volume shoots up, storage required shoots up, and so does the cost.
The (supposed) fix:
Rising storage cost is proportional to rising telemetry volume, so most observability platforms resort to cut data retention with time to bolster user retention. Telemetry retention rates are typically capped at 90 days, clearing up storage space for new telemetry to flow in.
Why this supposed fix is another bane:
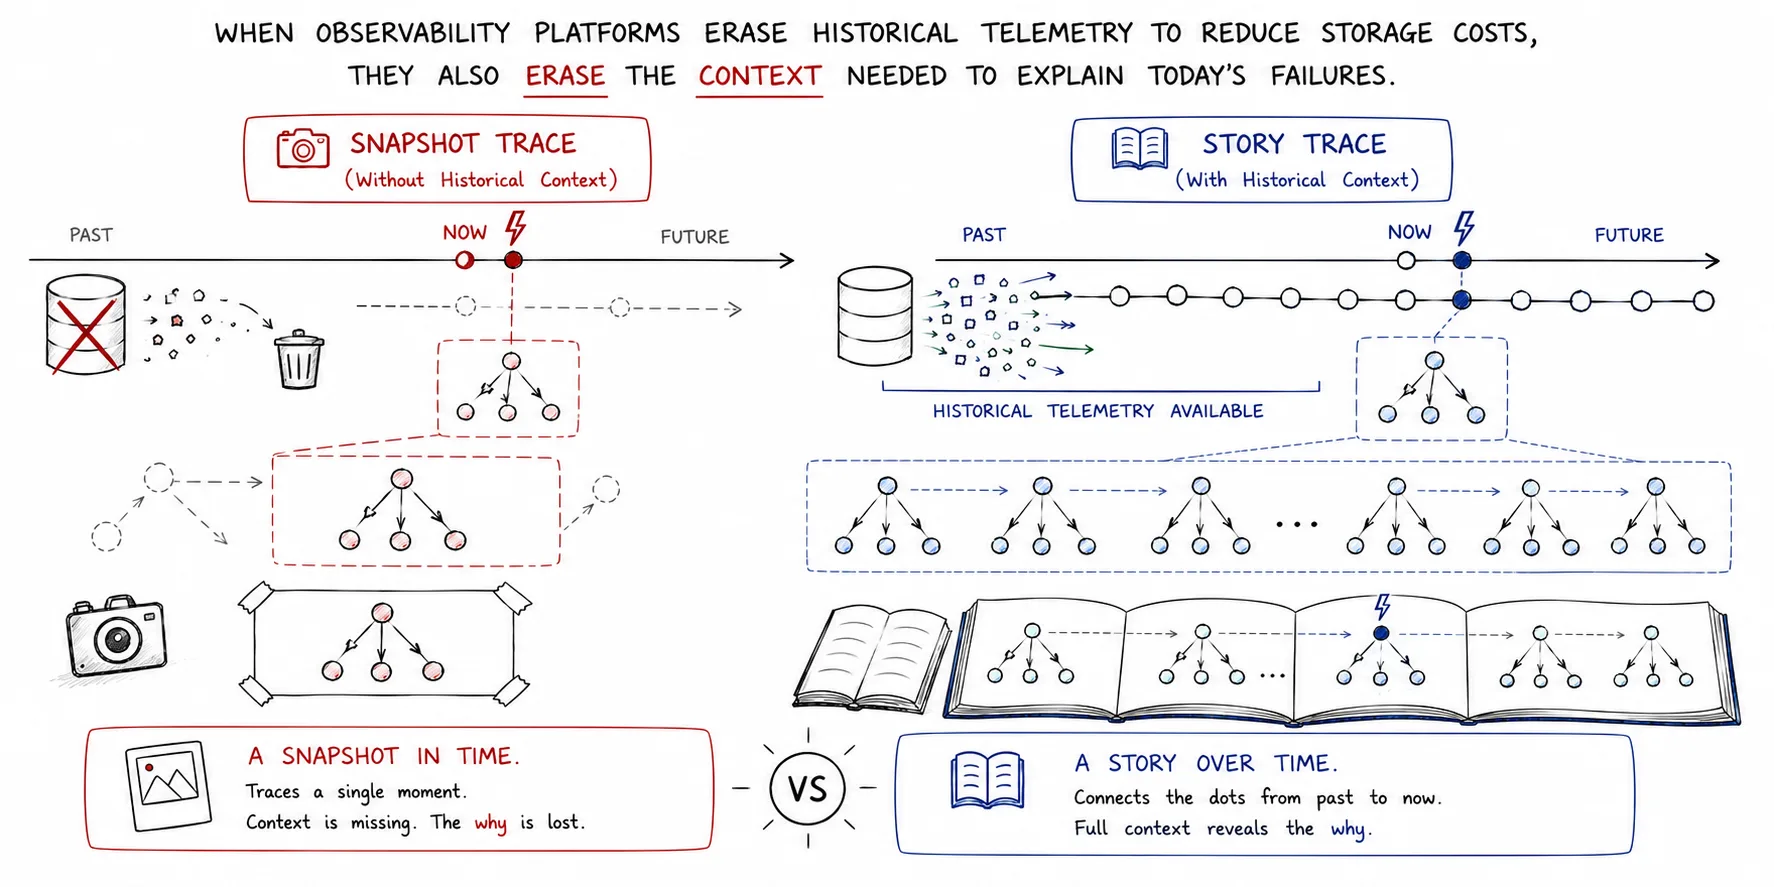
It all comes back to distributed tracing. In our previous section, we discussed how tracing deep into the underlying infrastructure is crucial to RCA. Just like how going deep through the stack adds more spatial context to debugging, going deep back in time lends more temporal context.
Retaining telemetry for longer periods lets your tracing go back in time, revisit earlier executions, and uncover clues that quietly accumulated before surfacing as a production failure.
When observability platforms erase historical telemetry to reduce storage costs, they also erase the context needed to explain today's failures. Without that historical context, distributed tracing becomes a snapshot instead of a story, making root cause analysis slower and less reliable.
How Parseable achieves high-context, low-cost observability with data lakes:
When it comes to observability, Parseable’s philosophy is this: quick telemetry correlation, quicker root cause identification, faster debugging. At a low observability cost.
Now, extending this philosophy to correlating the AI agent observability problems previously stated and the solution Parseable offers:
A quick recap:
The ideal observability solution for well-defined RCA:
- Percolate through AI agent observability layers, ending at the underlying infrastructure
- Correlate logs, metrics, and traces for highly-contextual distributed tracing
- Trace long-retained telemetry to uncover past clues, while preventing storage costs from spiking.
Obstacles to the observability solution:
Siloed, highly-structured DB storage that traditional observability platforms use causes the cross-signal correlation query to crawl, perform an inefficient “federated join,” and result in a lagging, partially-effective trace dashboard. The dashboard could be further worsened by the fact that not even all the three-layered telemetry signals could’ve been captured (blame it on S3 incompatibility).
To prevent storage costs from spiking, the approach that traditional observability platforms take is cutting down retention time. The distributed tracing dashboard now isn’t just lagging or partially-effective, but also incomplete - it literally stops miles (minutes) before the root cause.
The result? Instead of hitting RCA in 5 minutes, you spend 45 minutes manually retracing broken, disconnected traces while the AI agent continues to burn in production.
One pipeline, one query, one interface.
That’s how Parseable delivers the ideal observability solution.
Parseable uses S3-compatible data lake architecture for storage, keeping telemetry distributed, and un-siloed. Data of all types from all three layers and pillars flow through a single pipeline, removing the need for mismatched proprietary SDKs, siloed layer-specific tools, and disconnected dashboards.
With your full-stack telemetry living undisturbed in a single repository, every distributed trace span effortlessly bridges the agent's frontend, middle, and infrastructure layers. A single query traces the execution path from the user's initial interaction, through API calls and LLM token usage across multiple services, down to low-level CPU/GPU utilization and infrastructure costs. Correlation happens automatically, instantly connecting traces with relevant logs and metrics in a single pane - resulting in a highly-contextual trace that helps you pinpoint the exact root cause of an AI agent production failure in seconds.
Columnar design. Up to 90% data compression. High retention at a fraction of the storage cost.
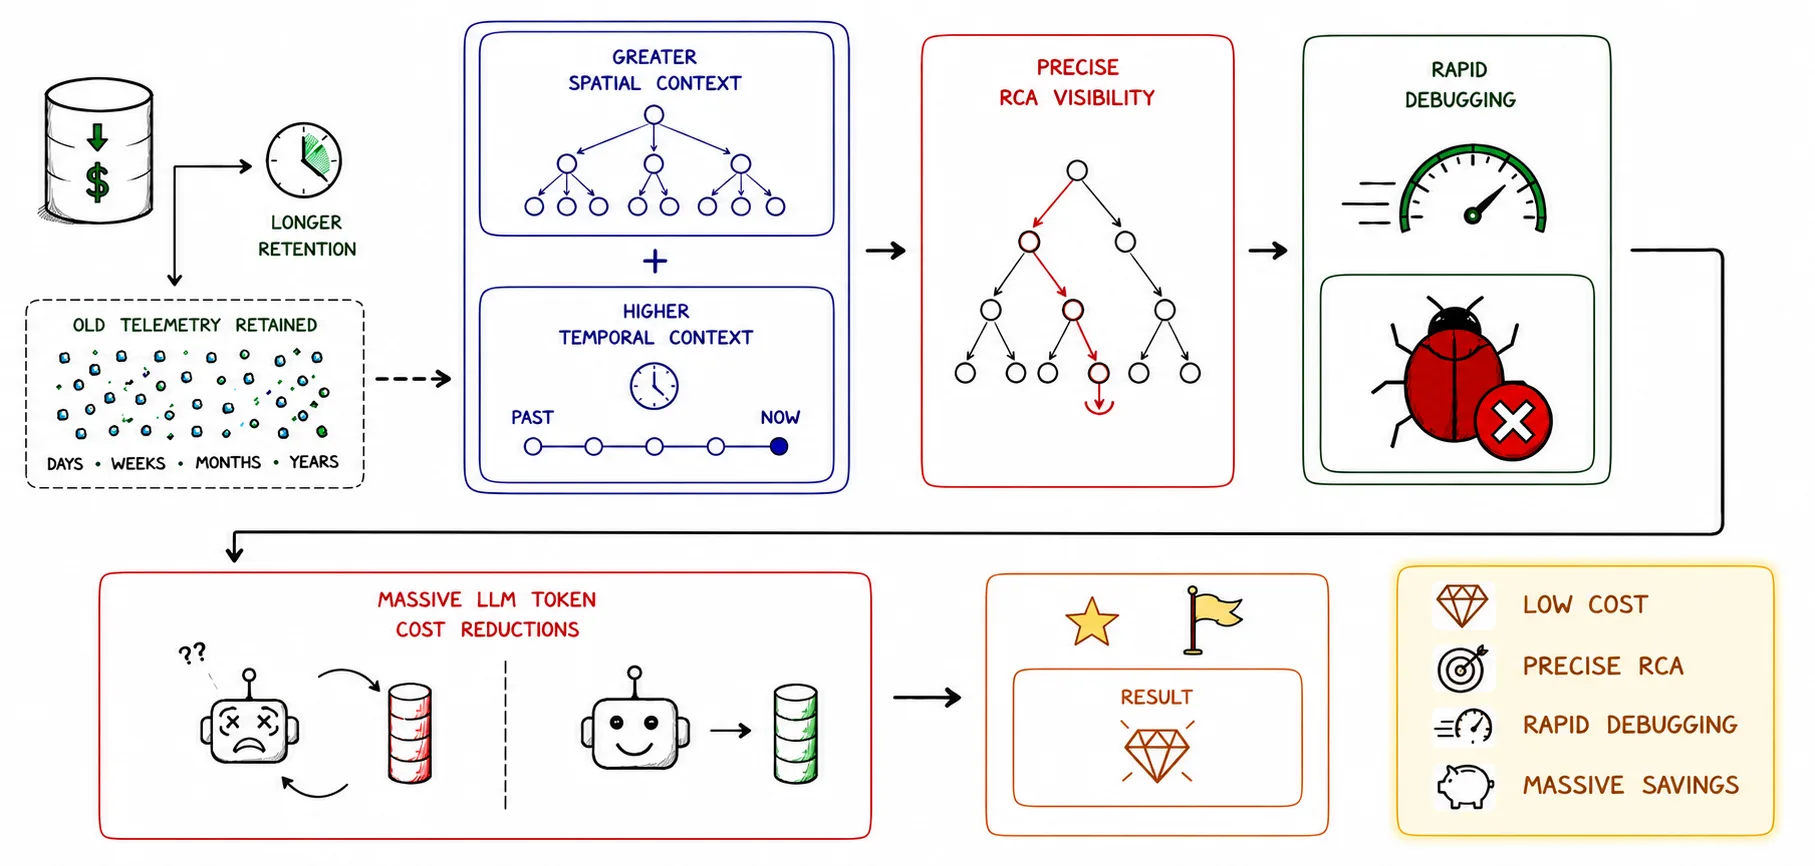
Data lakes are inherently cheaper - by removing the “index tax” associated with database storage - which explodes as AI agent-generated data volume grows exponentially - data lakes dramatically bring down storage space needed and the associated cost. Parseable makes storage cost even cheaper by utilizing Apache Parquet to columnize and compress ingested data by 90%, every 60 seconds.
Requiring low storage at incredibly low cost means you can retain old telemetry for a longer duration, making way for old telemetry to effectively contribute to distributed tracing. As greater temporal context now pairs with higher spatial context, you now attain precise visibility into the root cause and can debug rapidly.
Crucially, faster debugging translates directly to massive LLM token cost reductions. By pinpointing failures instantly, you prevent broken, looping AI agents from burning through an immense volume of expensive, unnecessary tokens in production.
Bottomline
The benefits of Parseable’s data lake architecture in AI agent observability are two-fold - first the storage cost goes down, then the LLM token usage cost. When you look at it from a high-level perspective, the two cost-saving lines converge, ending at Unified Observability That Costs a Dot.
Calculate your cost savings. If you’re convinced, dive into Parseable’s data lake.