
An OpenTelemetry Collector can work normally for weeks and still lose telemetry during a short backend outage. The Collector keeps receiving data, the exporter cannot send it, and the pending data has to wait somewhere. If that waiting space fills up, the Collector starts dropping data.
Three exporter settings control this behavior:
sending_queueholds data while the exporter is busy or the backend is unavailable.retry_on_failureretries temporary export failures.file_storagekeeps the queue on disk so it can survive a Collector restart.
They solve related problems, but they are not interchangeable. A retry policy does not create unlimited buffer space. An in-memory queue does not survive a restart. A persistent queue does not help when its disk is full.
This guide configures all three and explains where data can still be lost.
Where the Collector can lose data
The export path looks simple when the backend is healthy:
receiver -> processors -> exporter -> backendWhen the backend slows down or returns an error, the exporter path becomes more important:
receiver -> processors -> exporter queue -> export attempt -> backend
                                  ^              |
                                  |              |
                                  +---- retry ---+
The queue gives the exporter time to catch up. Retries handle failures such as a timeout, HTTP 429, HTTP 503, or gRPC Unavailable. Persistent storage protects queued data if the Collector process stops before the backend recovers.
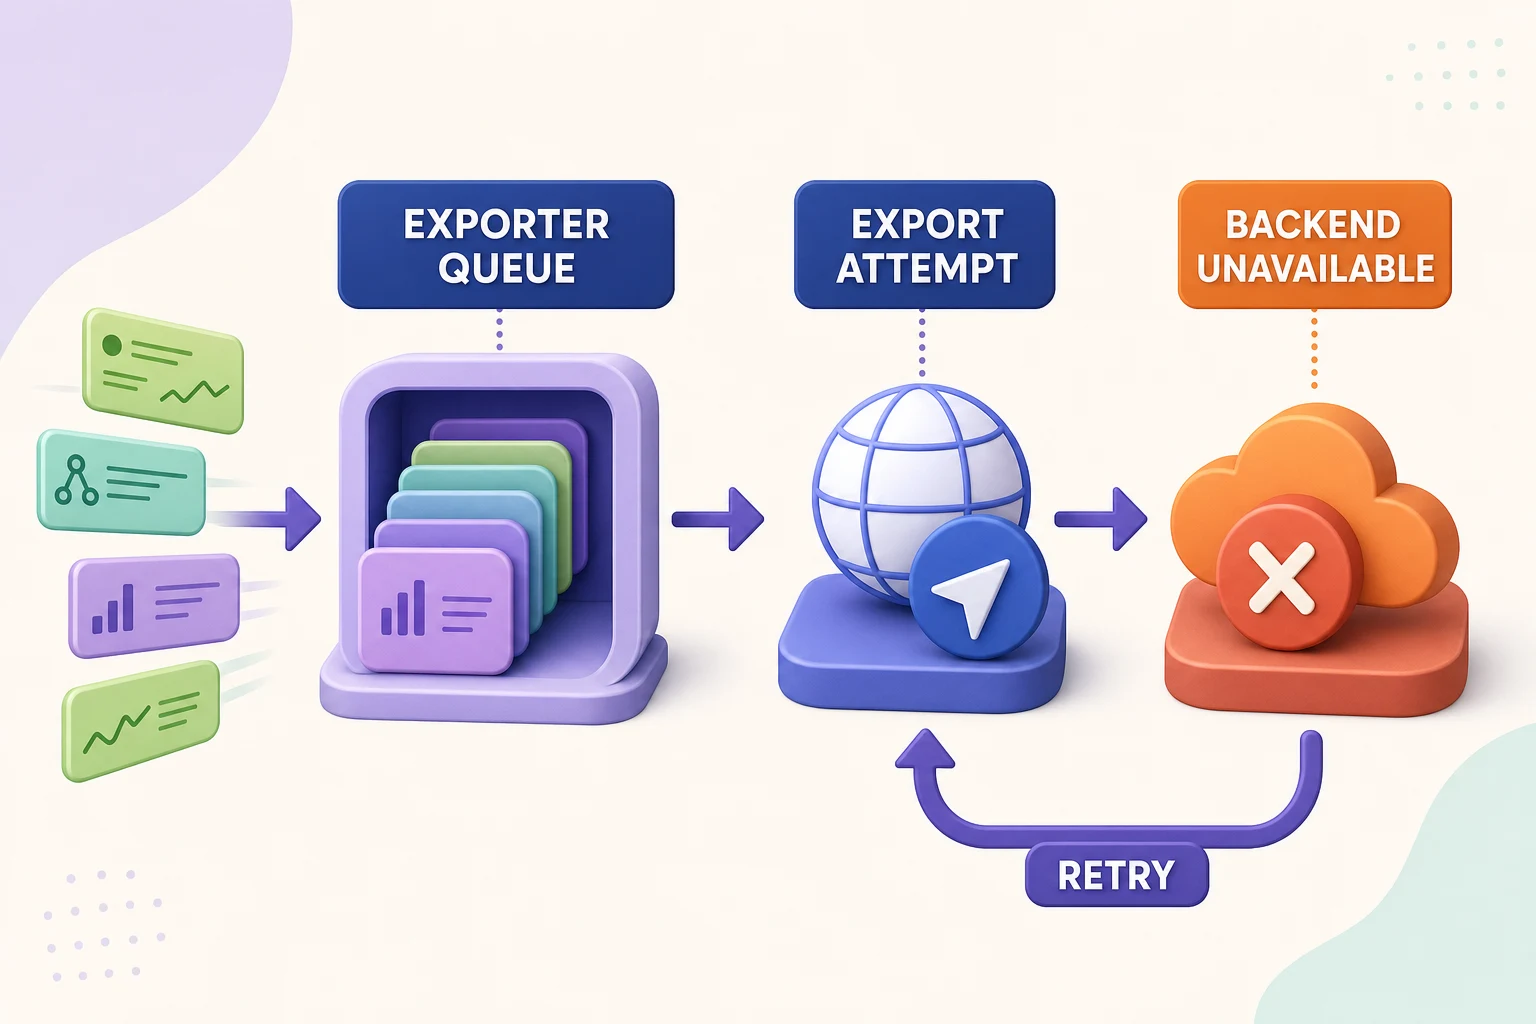
Data can still be lost at several points:
- The queue reaches its configured capacity.
- Retries continue longer than
max_elapsed_time. - The backend returns a permanent error, such as an invalid request.
- The Collector restarts while using only an in-memory queue.
- Persistent storage runs out of disk space or cannot be written.
- An upstream sender receives backpressure but does not retry.
The goal is not to claim that the Collector provides exactly-once delivery. It does not. The goal is to give the pipeline enough time and storage to recover from the failures you expect.
Complete queue, retry and persistent storage configuration
This configuration receives traces over OTLP, processes them in batches, and sends them to an OTLP HTTP backend. The exporter queue is stored on disk.
extensions:
  file_storage/exporter_queue:
    directory: /var/lib/otelcol/queue
    create_directory: true

receivers:
  otlp:
    protocols:
      grpc:
        endpoint: 0.0.0.0:4317
      http:
        endpoint: 0.0.0.0:4318

processors:
  memory_limiter:
    check_interval: 1s
    limit_percentage: 80
    spike_limit_percentage: 20

  batch:
    timeout: 1s
    send_batch_size: 1000
    send_batch_max_size: 2000

exporters:
  otlp_http/backend:
    endpoint: https://telemetry.example.com
    timeout: 10s
    sending_queue:
      enabled: true
      storage: file_storage/exporter_queue
      sizer: items
      queue_size: 100000
      num_consumers: 10
    retry_on_failure:
      enabled: true
      initial_interval: 5s
      max_interval: 30s
      max_elapsed_time: 10m

service:
  extensions: [file_storage/exporter_queue]
  pipelines:
    traces:
      receivers: [otlp]
      processors: [memory_limiter, batch]
      exporters: [otlp_http/backend]
telemetry.example.com is only a placeholder. Replace the endpoint and authentication settings with the values for your backend.
The component names must match. storage: file_storage/exporter_queue connects the exporter queue to the extension with the same name. Adding the extension under service.extensions starts it. Defining the extension without enabling it in service is not enough.
Configure the sending queue
The sending queue sits inside the exporter. The Collector adds completed batches to this queue, and queue consumers take them out and send them to the backend.
exporters:
  otlp_http/backend:
    endpoint: https://telemetry.example.com
    sending_queue:
      enabled: true
      sizer: items
      queue_size: 100000
      num_consumers: 10
When exports are fast, the queue remains close to empty. When the backend slows down, data waits in the queue. If incoming data continues to arrive faster than the exporter can send it, the queue grows until it reaches queue_size.
Once a non-blocking queue is full, new data cannot enter it and is dropped. The failed data never reaches the retry logic because it was rejected before an export attempt began.
Understand sizer and queue_size
sizer defines what queue_size counts.
sizer value | What the queue counts |
|---|---|
requests | Incoming telemetry requests or batches; this is the default |
items | Spans for traces, data points for metrics, and records for logs |
bytes | Serialized telemetry size in bytes |
With sizer: items in a traces pipeline, queue_size: 100000 allows the queue to hold up to 100,000 spans. The same configuration in a logs pipeline counts log records instead.
The default requests sizer is fast, but request sizes can vary. A queue containing 1,000 small requests holds much less data than one containing 1,000 large requests. Use items when the number of telemetry items is easier to estimate. Use bytes when the queue needs a clearer memory or disk boundary, but expect some additional work to calculate serialized size.
Size the queue for an outage
Start with the amount of telemetry one Collector receives per second and the outage duration it should absorb.
queue capacity = incoming items per second x outage duration in secondsIf one Collector receives 2,000 spans per second and should buffer five minutes:
2,000 x 300 = 600,000 spansThe initial configuration would be:
sending_queue:
  sizer: items
  queue_size: 600000
Add headroom for traffic spikes, then test with real telemetry. For an in-memory queue, also measure how much memory that backlog uses. For a persistent queue, make sure the volume has enough free space and is not sized right up to its limit.
What num_consumers controls
num_consumers is the number of workers reading from the queue and making export requests. More consumers can drain a backlog faster when the backend supports parallel requests.
Increasing it does not fix a backend that is already overloaded. It can make that problem worse by sending more concurrent requests. Start with the default, watch the queue and backend response times, and increase it only when the backend has spare capacity.
Should block_on_overflow be enabled?
By default, the sending queue does not block when it is full. It rejects new data immediately. Newer Collector versions also support block_on_overflow: true, which waits for queue space instead of rejecting data straight away.
sending_queue:
  block_on_overflow: true
This can push pressure back toward the receiver, but it is useful only when the upstream client handles backpressure and retries correctly. It also makes requests wait, so use it with clear receiver and client timeouts rather than treating it as unlimited buffering.
Configure retry_on_failure
The queue stores data waiting to be sent. retry_on_failure controls what happens after an export attempt fails with a retryable error.
retry_on_failure:
  enabled: true
  initial_interval: 5s
  max_interval: 30s
  max_elapsed_time: 10m
The first retry waits for initial_interval. If the backend is still unavailable, the delay increases with exponential backoff and jitter until it reaches max_interval. Jitter prevents many Collectors from retrying at exactly the same moment.
max_elapsed_time limits how long the Collector retries a failed request. In this example it gives up after ten minutes. The default is five minutes. Setting it to 0 keeps retrying without an elapsed-time limit, but the queue and storage are still finite. A long retry window is useful only when the queue can hold the data arriving during that window.
The exporter also has a separate timeout:
exporters:
  otlp_http/backend:
    timeout: 10s
This is the maximum time for one export attempt. It is not the total retry duration.
Retryable and permanent errors
The Collector retries temporary failures. Common examples include a network timeout, rate limiting, or a temporarily unavailable backend.
It does not keep retrying errors marked as permanent. Invalid credentials, malformed data, and some client-side HTTP errors will not become successful just because the same request is sent again. Check the exporter logs and fix the configuration or data instead.
Persist the queue with file_storage
Without a storage setting, the sending queue lives in memory. A Collector crash, pod replacement, or node restart removes everything still waiting in that queue.
The file_storage extension changes the exporter to use a persistent queue:
extensions:
  file_storage/exporter_queue:
    directory: /var/lib/otelcol/queue
    create_directory: true

exporters:
  otlp_http/backend:
    endpoint: https://telemetry.example.com
    sending_queue:
      enabled: true
      storage: file_storage/exporter_queue

service:
  extensions: [file_storage/exporter_queue]
When storage is configured, the exporter uses that storage-backed queue instead of an additional in-memory queue. If the Collector stops with data still queued, it can read the pending data and continue exporting after it starts again.
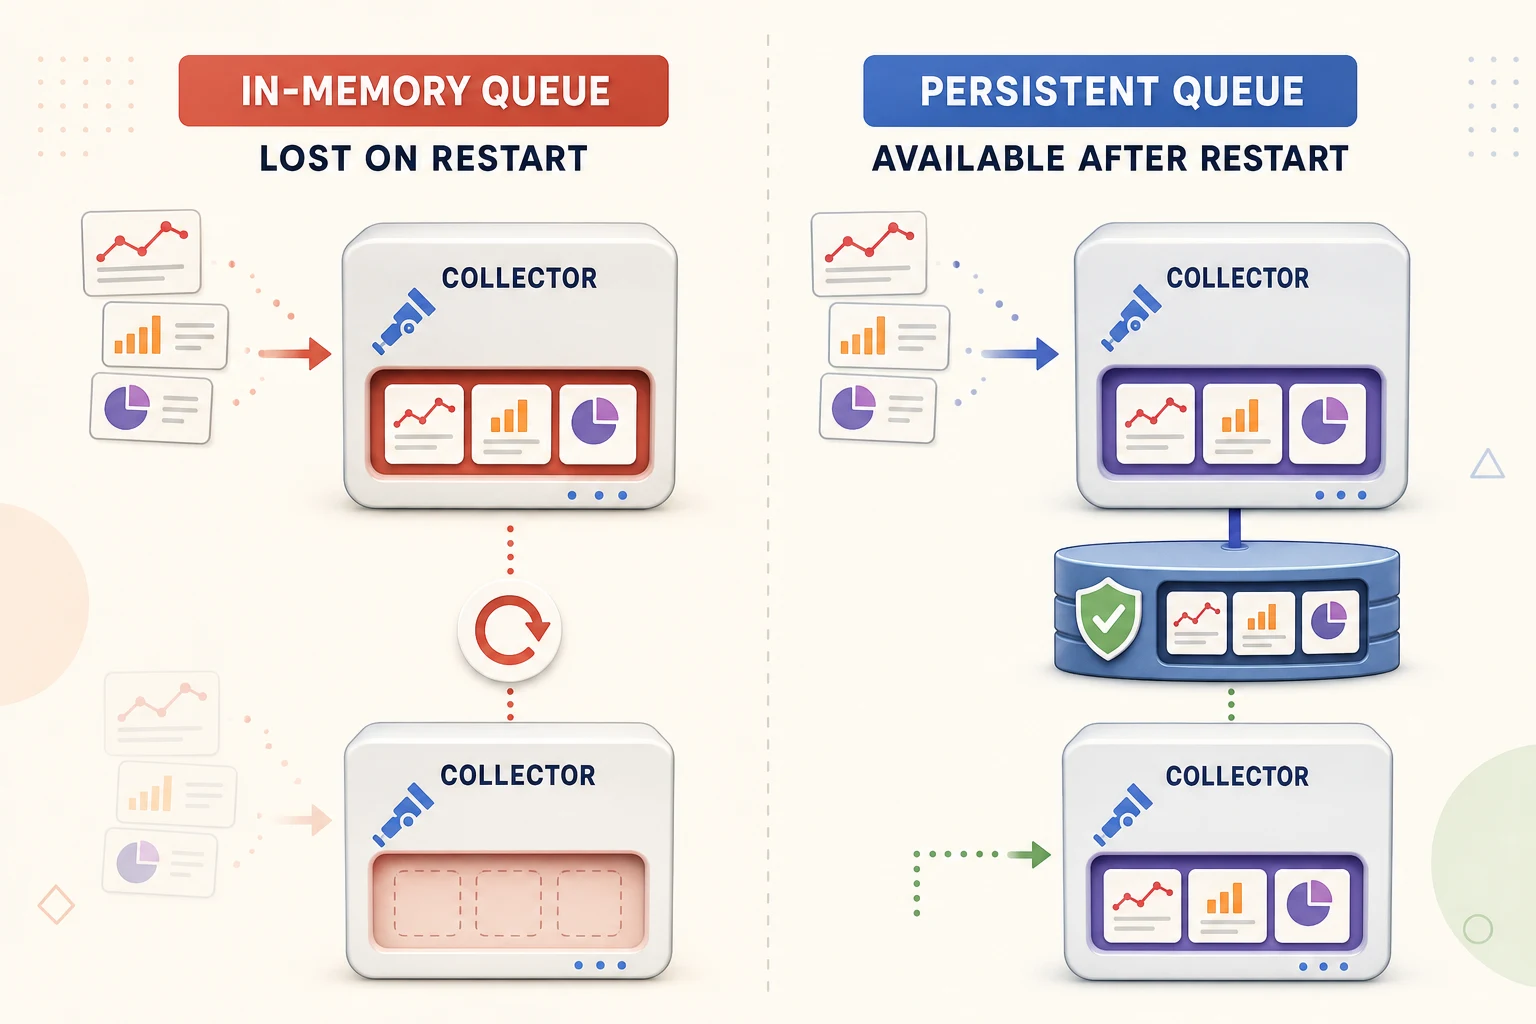
Persistent storage protects only data that has reached the exporter queue. Data still waiting inside the batch processor, tail sampling processor, or another in-memory component is not part of that queue.
Use durable storage in Kubernetes
A directory inside a container is not durable. It disappears when Kubernetes replaces the pod unless the directory is backed by a persistent volume.
Mount a volume at the same path used by file_storage:
volumeMounts:
  - name: otel-queue
    mountPath: /var/lib/otelcol/queue

volumes:
  - name: otel-queue
    persistentVolumeClaim:
      claimName: otel-collector-queue
Each Collector replica should have its own storage. A StatefulSet with one persistent volume claim per pod is usually easier to reason about than several replicas writing to one shared directory.
The Collector process also needs permission to create and write files at the mount path. Test this before relying on the queue during an outage.
Persistent does not mean unlimited
The persistent queue still follows queue_size. It can also stop accepting data if the volume is full, storage permissions change, or disk I/O fails.
Leave free space for normal filesystem operation and storage compaction. Monitor volume usage separately from the Collector's queue metrics. A queue can reach its configured capacity before the disk is full, and a disk can fill because of something outside the Collector.
The file storage extension is useful for short and medium outages. If the pipeline must survive long regional failures or hold a very large backlog, a dedicated message queue such as Kafka provides stronger separation, but it also adds another system to operate.
Batch processor and sending queue are different
The OTel batch processor groups small amounts of telemetry into larger requests. The exporter sending queue holds completed requests until they can be sent.
receiver -> processors -> batch processor -> exporter queue -> backendThe batch processor improves request efficiency. It does not retry failed exports or persist its pending batch. The exporter queue handles waiting and works with the retry policy. Persistent storage can protect the exporter queue across restarts.
Keep the batch processor near the end of the processor list and configure queue and retry settings under the exporter.
How memory_limiter fits into this setup
The memory limiter processor protects the Collector when memory usage becomes too high. It does not increase queue capacity or save queued data.
For an in-memory queue, a larger queue_size can increase the Collector's memory use during an outage. The memory limiter may begin refusing telemetry before the queue reaches its configured capacity. That is safer than an out-of-memory crash, but the upstream sender must retry refused data or it may still be lost.
Even with persistent storage, the Collector needs memory for receivers, processors, active export requests, and reading queued data from disk. Keep memory_limiter near the beginning of the pipeline.
Monitor the queue and export failures
The Collector exposes internal metrics at http://127.0.0.1:8888/metrics by default. These are the main metrics to watch:
| Metric | What it shows |
|---|---|
otelcol_exporter_queue_size | Current queue usage, measured using the configured sizer |
otelcol_exporter_queue_capacity | Maximum queue capacity, measured using the configured sizer |
otelcol_exporter_enqueue_failed_spans | Spans that could not enter the queue |
otelcol_exporter_enqueue_failed_log_records | Log records that could not enter the queue |
otelcol_exporter_enqueue_failed_metric_points | Metric points that could not enter the queue |
otelcol_exporter_send_failed_spans | Spans included in failed export attempts |
otelcol_exporter_sent_spans | Spans successfully exported |
Use the equivalent log and metric counters for those pipelines. Prometheus normally adds _total to counter names, so the scraped name may appear as otelcol_exporter_enqueue_failed_spans_total.
For example, with sizer: items in a traces pipeline, queue size and capacity are measured in spans.
Queue size should normally rise during a backend problem and fall after recovery. A queue that keeps growing during healthy backend operation means the exporter cannot keep up with normal traffic.
An increase in send_failed does not always mean data has already been lost because a retry may later succeed. An increase in enqueue_failed is more direct: data could not enter the queue. Alert before queue usage reaches capacity, not after failures begin.
The official Collector internal telemetry documentation explains the complete metric set.
Test the failure path
A configuration should be tested by making the backend unavailable. A successful startup only proves that the YAML is valid.
Use a staging Collector and send traffic similar to the real workload. Then stop the backend or point the exporter at an unavailable test endpoint. Check that:
- queue size increases while exports fail
- retry delays increase instead of creating a tight request loop
- queue capacity is large enough for the planned outage
- data is exported after the backend returns
- a Collector restart preserves queued data when
file_storageis enabled - the persistent volume does not fill during the test
- queue and exporter alerts fire before data is dropped
Run the test long enough to cross max_elapsed_time as well. This confirms what the pipeline does when an outage lasts longer than the retry window.
OpenTelemetry Collector data loss checklist
Before using the configuration in production, confirm the following:
- Network exporters have a sending queue enabled.
sizerandqueue_sizerepresent a known amount of telemetry.- Queue capacity covers the expected backend outage plus traffic spikes.
max_elapsed_timeis long enough for the same outage window.num_consumersdoes not overload the backend during recovery.- Critical queues use
file_storageon durable storage. - Kubernetes pods do not store persistent queues only in the container filesystem.
- Disk space, queue usage, enqueue failures and export failures are monitored.
- The upstream sender retries when the Collector applies backpressure.
- Backend outage and Collector restart tests have been completed.
Queues, retries and persistent storage reduce different kinds of data loss. Configure them together, size them from actual traffic, and test the point where each limit is reached.