An OpenTelemetry Collector can run as an agent beside a workload or as a gateway shared by many workloads. Kubernetes supports both patterns, which is useful right up to the point where you have to choose one.
The practical answer is usually based on the data source:
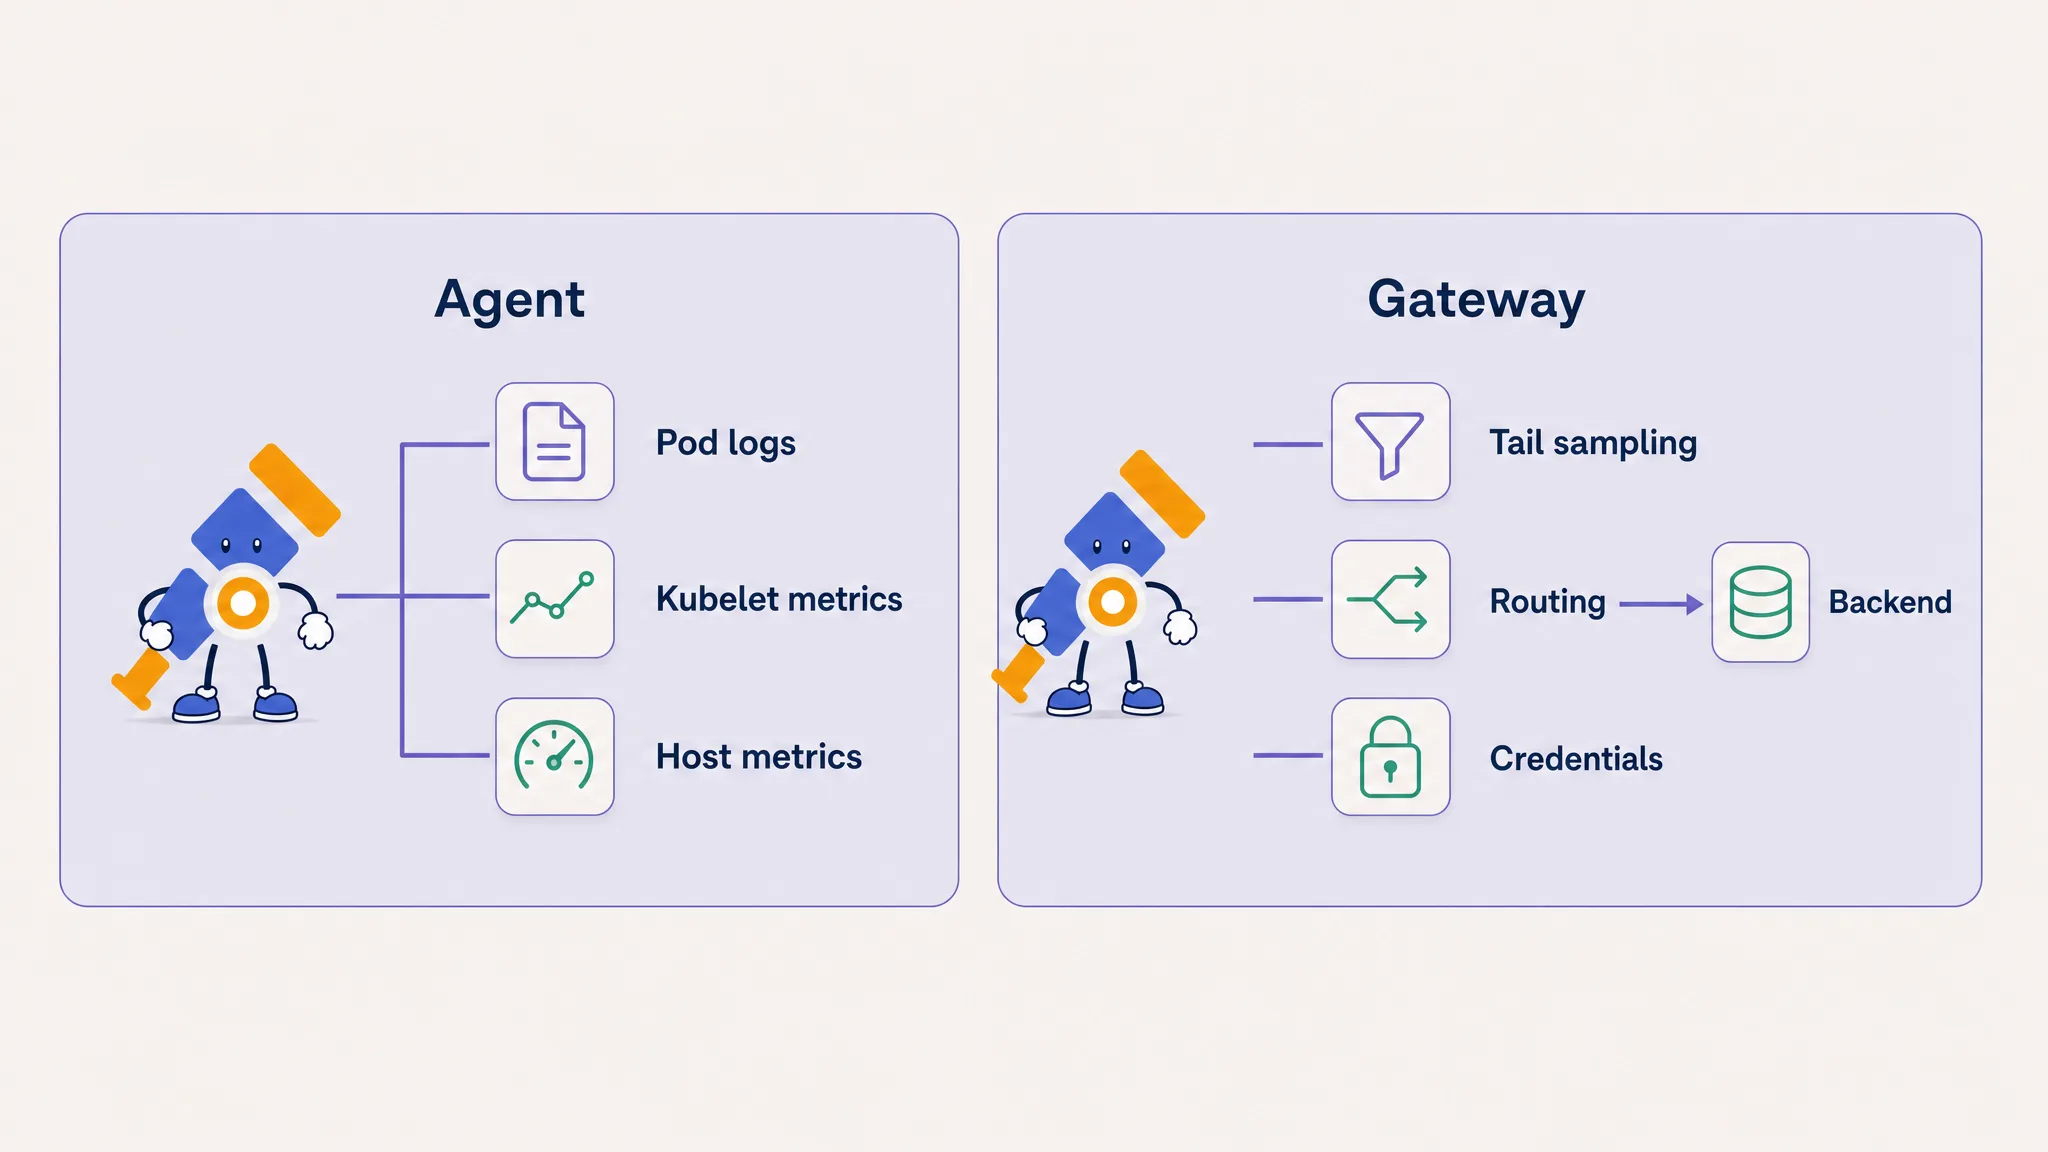
- Run agents as a DaemonSet for node-local data such as container logs, kubelet metrics and host metrics.
- Run gateways as a Deployment for a stable OTLP endpoint, centralized policy, backend credentials and processing that needs a wider view of the data.
- Use agents and gateways together when you need both local collection and centralized control.
For a small cluster that only receives OTLP from applications, a gateway may be enough. If you only collect node-local logs and metrics, agents can export directly to the backend. Adding both tiers without a job for each one gives you more queues, more failure modes and not much else.
This guide explains where each pattern fits, which Collector components belong in each tier and how to avoid the scaling mistakes that show up after the second gateway replica arrives.
Agent vs gateway at a glance
An agent and a gateway use the same Collector binary. The difference is placement and responsibility, not a special operating mode inside otelcol.
| Decision | Agent Collector | Gateway Collector |
|---|---|---|
| Kubernetes workload | DaemonSet, sometimes sidecar | Deployment or StatefulSet |
| Instance count | Usually one per node | One or more per cluster, region or environment |
| Best at | Reading local files and node endpoints | Shared OTLP ingress and central processing |
| Typical receivers | filelog, kubeletstats, hostmetrics, otlp | otlp, k8s_cluster, cluster events |
| Typical processing | Local enrichment, memory limiting, small batches | Filtering, routing, sampling, larger queues |
| Backend credentials | Repeated on every agent if exporting directly | Kept in one central tier |
| Scaling | Follows the node count | Scales independently from workloads |
| Main risk | Config and resource cost multiplied per node | A shared bottleneck or incorrect load balancing |
Start with the component that must stay close to the source. A Collector cannot read /var/log/pods from another node. A shared gateway, however, is a better place to keep an external API key than 80 copies of the same secret across 80 node agents.
If receivers, processors and exporters are still new, read the OpenTelemetry Collector guide first. This article assumes that pipeline model and stays with placement.
What is the agent deployment pattern?
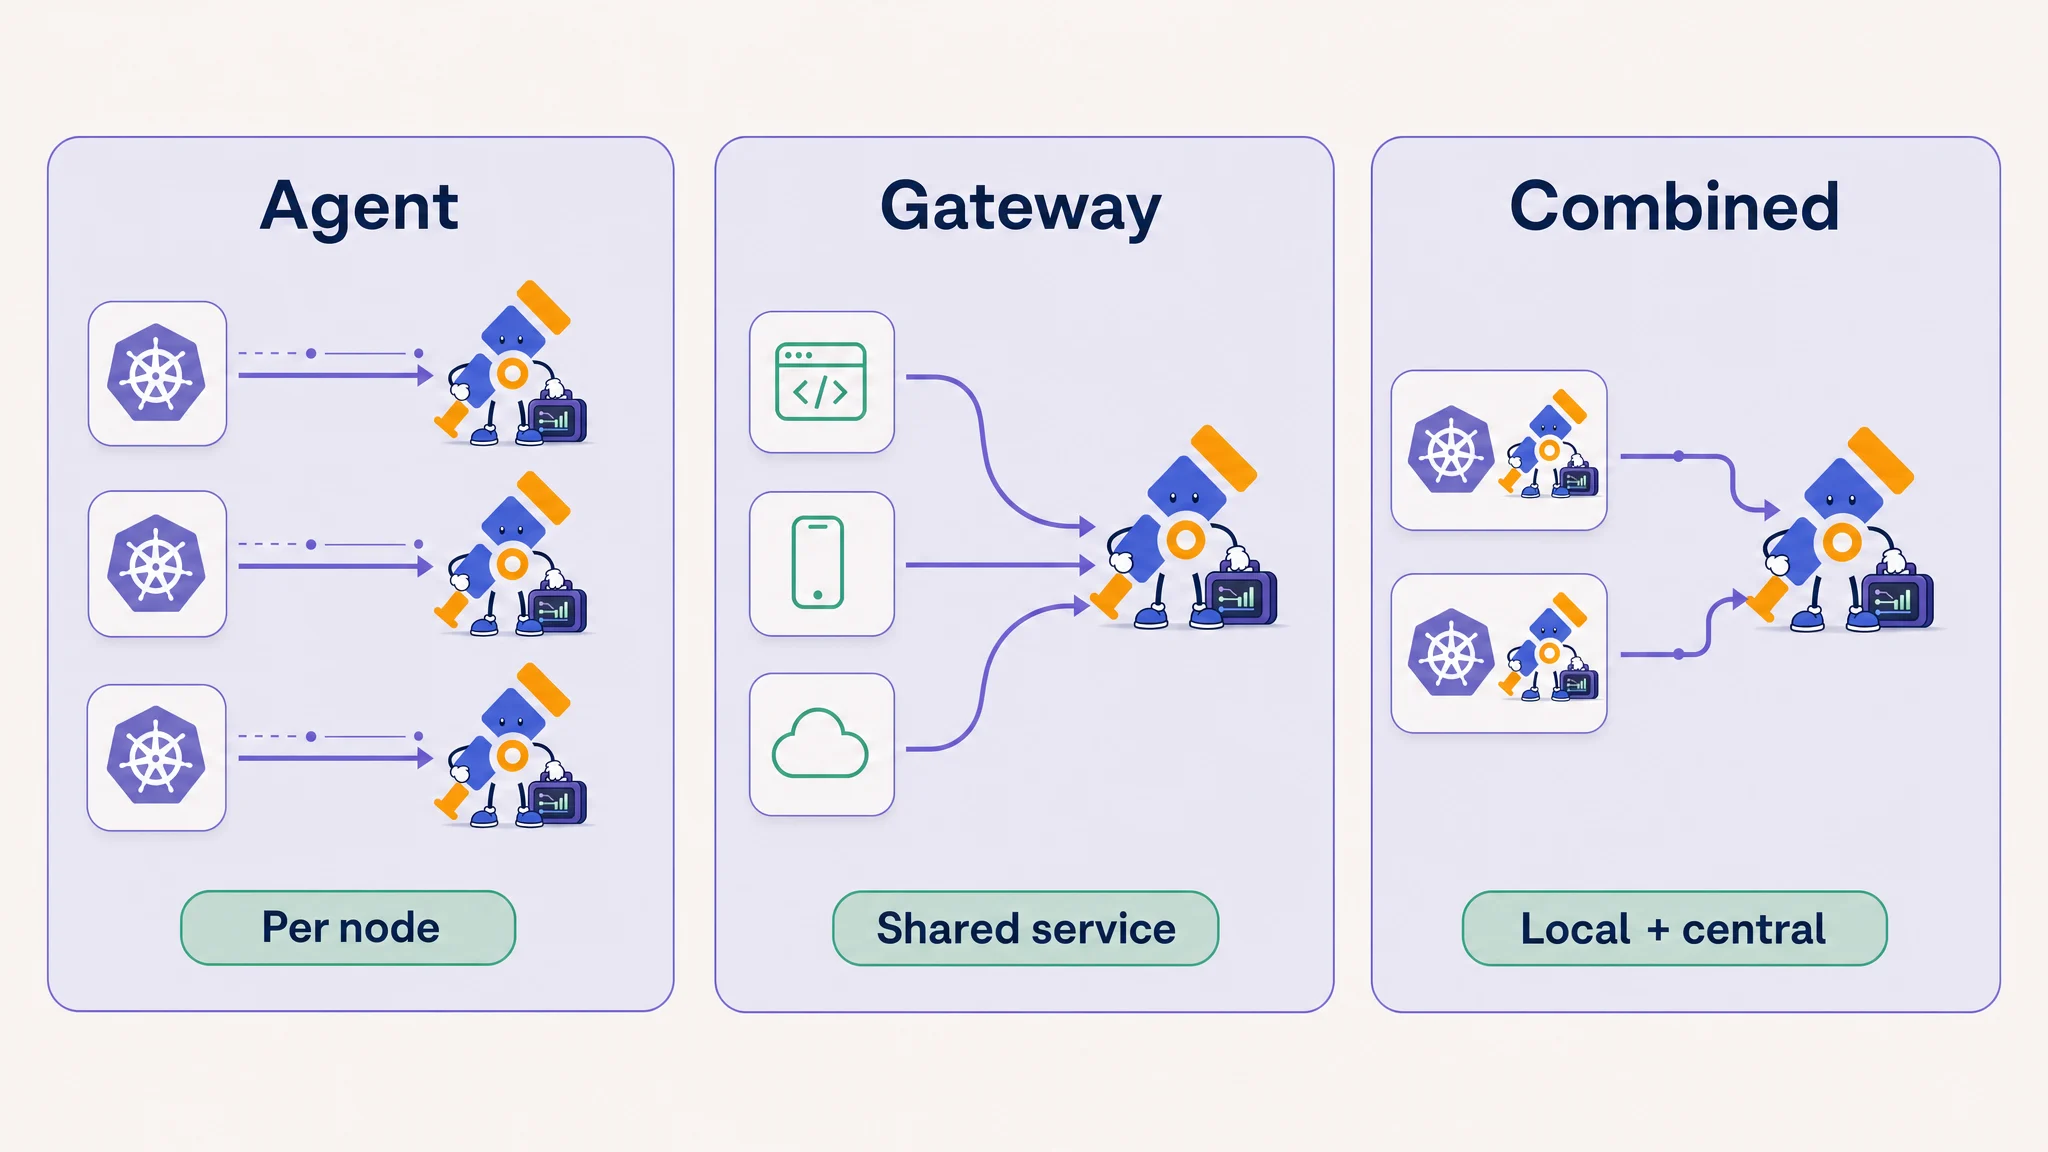
An agent Collector runs close to the system producing telemetry. On Kubernetes, that normally means a DaemonSet with one Collector pod on each node. A sidecar is also an agent, but it creates one Collector per application pod rather than per node.
The DaemonSet shape works well for data tied to a node:
- container logs under
/var/log/pods - kubelet and container metrics
- host CPU, memory, disk and network metrics
- local OTLP from workloads that are deliberately routed to the node agent
The Collector can mount the required host paths, read only the files on its node and add Kubernetes metadata before forwarding the data.
node-a                         node-b
├── application pods          ├── application pods
└── OTel agent                └── OTel agent
    ├── pod logs                  ├── pod logs
    └── node metrics              └── node metrics
Agents spread collection work across the cluster and keep the first telemetry hop short. They also spread configuration, credentials and queues across the cluster. A configuration change now rolls through every node, and a generous memory limit is multiplied by the node count.
When an agent alone is enough
Direct agent-to-backend export is reasonable when:
- collection is mostly node-local
- the backend accepts the protocol you need
- every agent can use the same processing policy
- duplicating backend credentials across agents is acceptable
- you do not need a processor that sees related data from several nodes
This is a useful baseline for Kubernetes logs. Our Kubernetes logs with the OpenTelemetry Collector guide walks through the DaemonSet, host mounts and filelog configuration.
What is the gateway deployment pattern?
A gateway Collector is a shared service. Applications or other Collectors send telemetry to its OTLP endpoint, usually through a Kubernetes Service. The gateway processes the data and exports it to one or more backends.
Gateways are useful for work that should be managed centrally:
- backend authentication and egress
- organization-wide filtering or redaction
- routing by tenant, environment or signal
- tail sampling and other processing that needs related telemetry together
- buffering during a backend slowdown
- fan-out to more than one destination
A Kubernetes Deployment lets the gateway scale independently from the nodes and applications producing telemetry. Two replicas can handle a larger workload or survive a pod restart, provided the pipeline is safe to distribute across both.
The gateway does not gain access to node-local files merely because it runs in the same cluster. A filelog receiver in a Deployment sees the filesystem of the gateway pod. It does not see logs on every Kubernetes node.
When a gateway alone is enough
A gateway-only deployment is a clean fit when instrumented applications send logs, metrics and traces over OTLP, and you do not need node-local receivers.
application SDKs
       |
       | OTLP
       v
Kubernetes Service
       |
       v
gateway Collectors
       |
       v
observability backend
It gives applications one stable endpoint and keeps processing outside application pods. You still need to plan gateway capacity because every workload now shares that path.
When to combine agents and gateways
The combined pattern gives each tier a smaller job. Agents collect and enrich local telemetry. Gateways enforce shared policy and handle external export.
pod logs ──> node agent ──┐
kubelet ───> node agent ──┼──> gateway Service ──> gateway pods ──> backend
host metrics > node agent ─┘

application OTLP can go to a node agent or directly to the gateway,
depending on which local processing the application data needs.
This is a sensible production default when a cluster has mixed sources, but the extra tier must earn its place. Agents forwarding OTLP unchanged to gateways still consume CPU, memory and network bandwidth. Send application OTLP directly to the gateway when the agent does not add local metadata, buffering or policy that the application path requires.
The combined pattern is most useful when you need at least two of these:
- node-local log or metric collection
- one controlled egress path from the cluster
- different scaling for collection and processing
- central credentials and routing rules
- trace-aware processing across workloads
Put each component in the right tier
The component list is where an architecture diagram becomes a working deployment. Some receivers depend on local access. Some processors depend on a complete view of related data.
| Component or job | Prefer agent | Prefer gateway | Why |
|---|---|---|---|
filelog receiver | Yes | No | Pod log files live on individual nodes |
kubeletstats receiver | Yes | No | Each agent can reach the kubelet on its node |
hostmetrics receiver | Yes | No | Host filesystems and process data are local |
| Kubernetes metadata enrichment | Yes | Sometimes | Enrich early when the agent knows the source pod |
k8s_cluster receiver | No | Yes | Cluster-wide collection should not run once per node |
| Kubernetes events | No | Yes | Multiple identical receivers can duplicate events |
| Memory limiter | Yes | Yes | Every Collector process must protect its own memory |
| Batch processing | Yes | Yes | Small local batches and backend-facing batches solve different costs |
| Backend credentials | Avoid | Yes | Fewer copies and one place to rotate them |
| Tail sampling | No | Yes | Sampling needs all spans for a trace at one decision point |
| Routing and external fan-out | Sometimes | Yes | Central policy is easier to change and audit |
The memory limiter and batch processor belong in both tiers when both tiers can queue or process data. They protect separate Collector processes; configuring them on a gateway does nothing for an agent that is running out of memory.
A minimal agent-to-gateway configuration
Keep the boundary easy to explain. The agent below receives OTLP, limits memory, adds the node name and forwards to the gateway over OTLP/gRPC.
receivers:
  otlp:
    protocols:
      grpc:
        endpoint: 0.0.0.0:4317

processors:
  memory_limiter:
    check_interval: 1s
    limit_percentage: 75
    spike_limit_percentage: 15
  resource/node:
    attributes:
      - key: k8s.node.name
        value: ${env:K8S_NODE_NAME}
        action: upsert
  batch:
    timeout: 1s
    send_batch_size: 1000

exporters:
  otlp/gateway:
    endpoint: ${env:OTEL_GATEWAY_ENDPOINT}
    tls:
      insecure: true

service:
  pipelines:
    traces:
      receivers: [otlp]
      processors: [memory_limiter, resource/node, batch]
      exporters: [otlp/gateway]
The DaemonSet injects the node name through the Kubernetes downward API:
env:
  - name: K8S_NODE_NAME
    valueFrom:
      fieldRef:
        fieldPath: spec.nodeName
Set OTEL_GATEWAY_ENDPOINT to the Kubernetes Service created for the gateway, for example otel-gateway.observability.svc.cluster.local:4317. Confirm the actual Service name after installing the chart rather than copying the example hostname.
Use authenticated TLS between tiers when telemetry crosses a trust boundary. The insecure setting keeps the example focused on placement; it should not become an unexplained production default.
The gateway accepts the forwarded spans, applies its own memory and batch limits and exports them. The exporter below uses placeholders because endpoint paths and authentication headers depend on the backend.
receivers:
  otlp:
    protocols:
      grpc:
        endpoint: 0.0.0.0:4317

processors:
  memory_limiter:
    check_interval: 1s
    limit_percentage: 80
    spike_limit_percentage: 20
  batch:
    timeout: 5s
    send_batch_size: 4000
    send_batch_max_size: 8000

exporters:
  otlphttp/backend:
    endpoint: ${env:OTLP_BACKEND_ENDPOINT}
    headers:
      Authorization: ${env:OTLP_AUTH_HEADER}

service:
  pipelines:
    traces:
      receivers: [otlp]
      processors: [memory_limiter, batch]
      exporters: [otlphttp/backend]
The complete Collector configuration guide covers component activation, validation and environment-based secrets. Validate both configurations with the exact Collector distribution and version you plan to deploy.
Deploying the two tiers with Helm
The official OpenTelemetry Collector Helm chart requires a mode. Use separate releases because agents and gateways have different workload types, configurations and resource limits.
helm repo add open-telemetry https://open-telemetry.github.io/opentelemetry-helm-charts
helm repo update

helm upgrade --install otel-agent open-telemetry/opentelemetry-collector \
  --namespace observability --create-namespace \
  --set mode=daemonset \
  --set image.repository=otel/opentelemetry-collector-k8s \
  -f agent-values.yaml

helm upgrade --install otel-gateway open-telemetry/opentelemetry-collector \
  --namespace observability \
  --set mode=deployment \
  --set image.repository=otel/opentelemetry-collector-k8s \
  -f gateway-values.yaml
Pin the chart and Collector image versions in production. Review the chart defaults before an upgrade because presets can add receivers, mounts and RBAC that affect the final configuration.
Sidecars have their own use cases, particularly when a workload needs isolated configuration or a localhost endpoint. They also multiply Collector containers by pod count. A DaemonSet is usually more efficient for node-wide logs and host metrics.
Scaling gateways without breaking the data
Stateless processing is easy to spread across replicas. Memory limiting, attribute insertion, filtering and batching can usually run independently on each gateway. A normal Kubernetes Service can distribute OTLP traffic across those replicas.
Stateful processing needs a routing plan.
Tail sampling needs complete traces
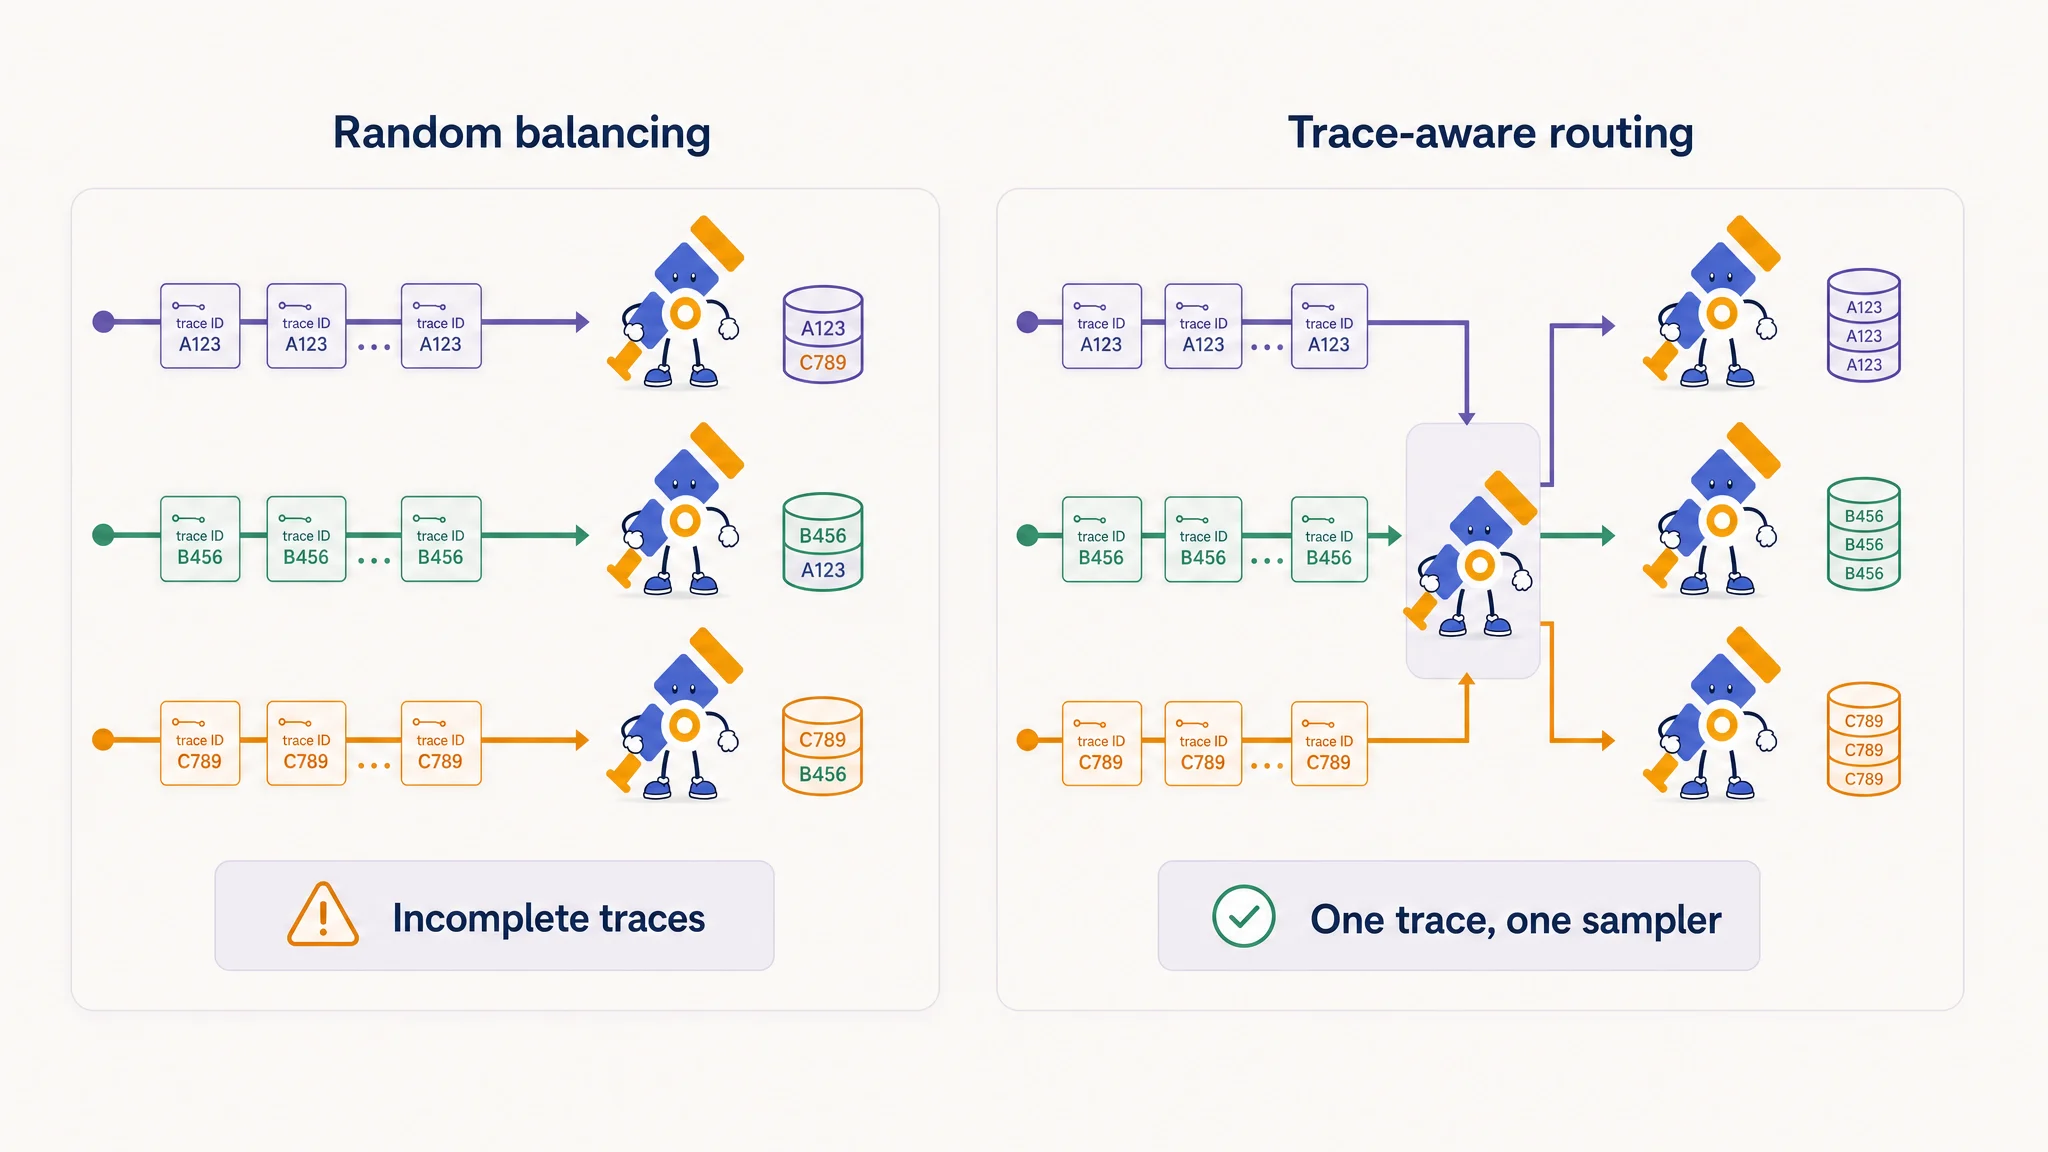
The tail sampling processor waits for spans belonging to the same trace before deciding whether to retain that trace. If a Service sends those spans to random gateway replicas, each processor sees an incomplete trace.
Use a two-tier gateway or a load-balancing exporter configured to route by trace ID so all spans from one trace reach the same sampling Collector. The OpenTelemetry tail sampling guide covers that topology, decision wait and memory sizing.
Metrics need a single writer
Some metric processing keeps state for a series. Cumulative-to-delta conversion and span-derived metrics can produce incorrect or conflicting results when points for one series move between replicas. Route consistently and preserve a globally unique resource identity.
The same principle applies to Prometheus scraping. If every gateway replica discovers and scrapes every target, the cluster receives duplicate samples. Use the OpenTelemetry Operator Target Allocator or another explicit sharding mechanism instead of hoping the replicas divide the work themselves.
Scale from Collector pressure, not pod count
Application replica count is a weak proxy for telemetry volume. Scale gateways using observed CPU and memory together with Collector signals such as refused data, exporter failures and queue utilization.
The OTel Collector metrics guide provides a dashboard and alert sequence for that path. Leave enough capacity for a replica failure and test backend slowdowns; normal steady-state traffic is the easy part.
Failure boundaries to test
Two tiers create two queues and two network hops. Test each boundary separately.
- Stop one gateway pod and confirm agents reconnect without losing an unexpected amount of data.
- Make the backend unavailable and watch gateway queue utilization, memory and failed exports.
- Restart an agent while a node is producing logs and verify the file checkpoint resumes correctly.
- Scale the gateway and confirm tail sampling or metric processing still receives consistently routed data.
- Roll out a bad gateway configuration in a test namespace and check that readiness prevents it from receiving traffic.
Persistent queues can reduce loss during a restart, but they need durable storage and capacity planning. A queue is a buffer, not a substitute for fixing a destination that remains slower than ingestion.
Which deployment should you choose?
Use this as the starting decision:
- Choose agents when the Collector must read data tied to each node.
- Choose a gateway when applications already emit OTLP and need one managed processing and export path.
- Choose both when node-local collection and centralized processing are separate requirements.
For many production Kubernetes clusters, the combined design ends up cleanest: small DaemonSet agents collect local data and shared gateway Collectors own backend-facing policy. Keep application OTLP on the shortest useful route, and do not add an agent hop merely because the agent pods already exist.
The official OpenTelemetry documentation covers the agent, gateway and combined deployment patterns. Use those references alongside the component-specific guidance because Collector behavior changes faster than copied configuration snippets.
Common deployment questions
Is an OpenTelemetry agent different from the Collector?
An OpenTelemetry agent deployment uses the Collector binary close to a workload, usually as a DaemonSet, sidecar or host service. “Agent” describes its placement and job; it is not a different Collector product.
Should the OpenTelemetry Collector run as a DaemonSet or Deployment?
Use a DaemonSet for node-local collection such as pod logs, kubelet metrics and host metrics. Use a Deployment for a shared gateway that receives OTLP and performs centralized processing. A production cluster may use both as separate Helm releases.
Can applications send OTLP directly to a gateway?
Yes. Applications can send OTLP directly to a gateway Service when they do not need processing on a node agent first. This removes a network hop and reduces load on the agents.
How many gateway replicas do I need?
Start with enough capacity to tolerate one replica being unavailable, then load test with representative telemetry. Monitor Collector CPU, memory, refused data, exporter failures and queue utilization. Stateful processors may also require trace- or service-aware routing as replicas increase.