Kubernetes observability rarely breaks because nobody cares about telemetry. It breaks because every team has a slightly different version of the truth.
One service has traces. Another has logs but no useful labels. Metrics are scraped somewhere else. Kubernetes events are only looked at after someone remembers they exist. A new namespace gets created and nobody is quite sure whether the collector config applies to it. The cluster is observable, technically. But when production gets interesting, the path from "something is wrong" to "here is what happened" is still too long.
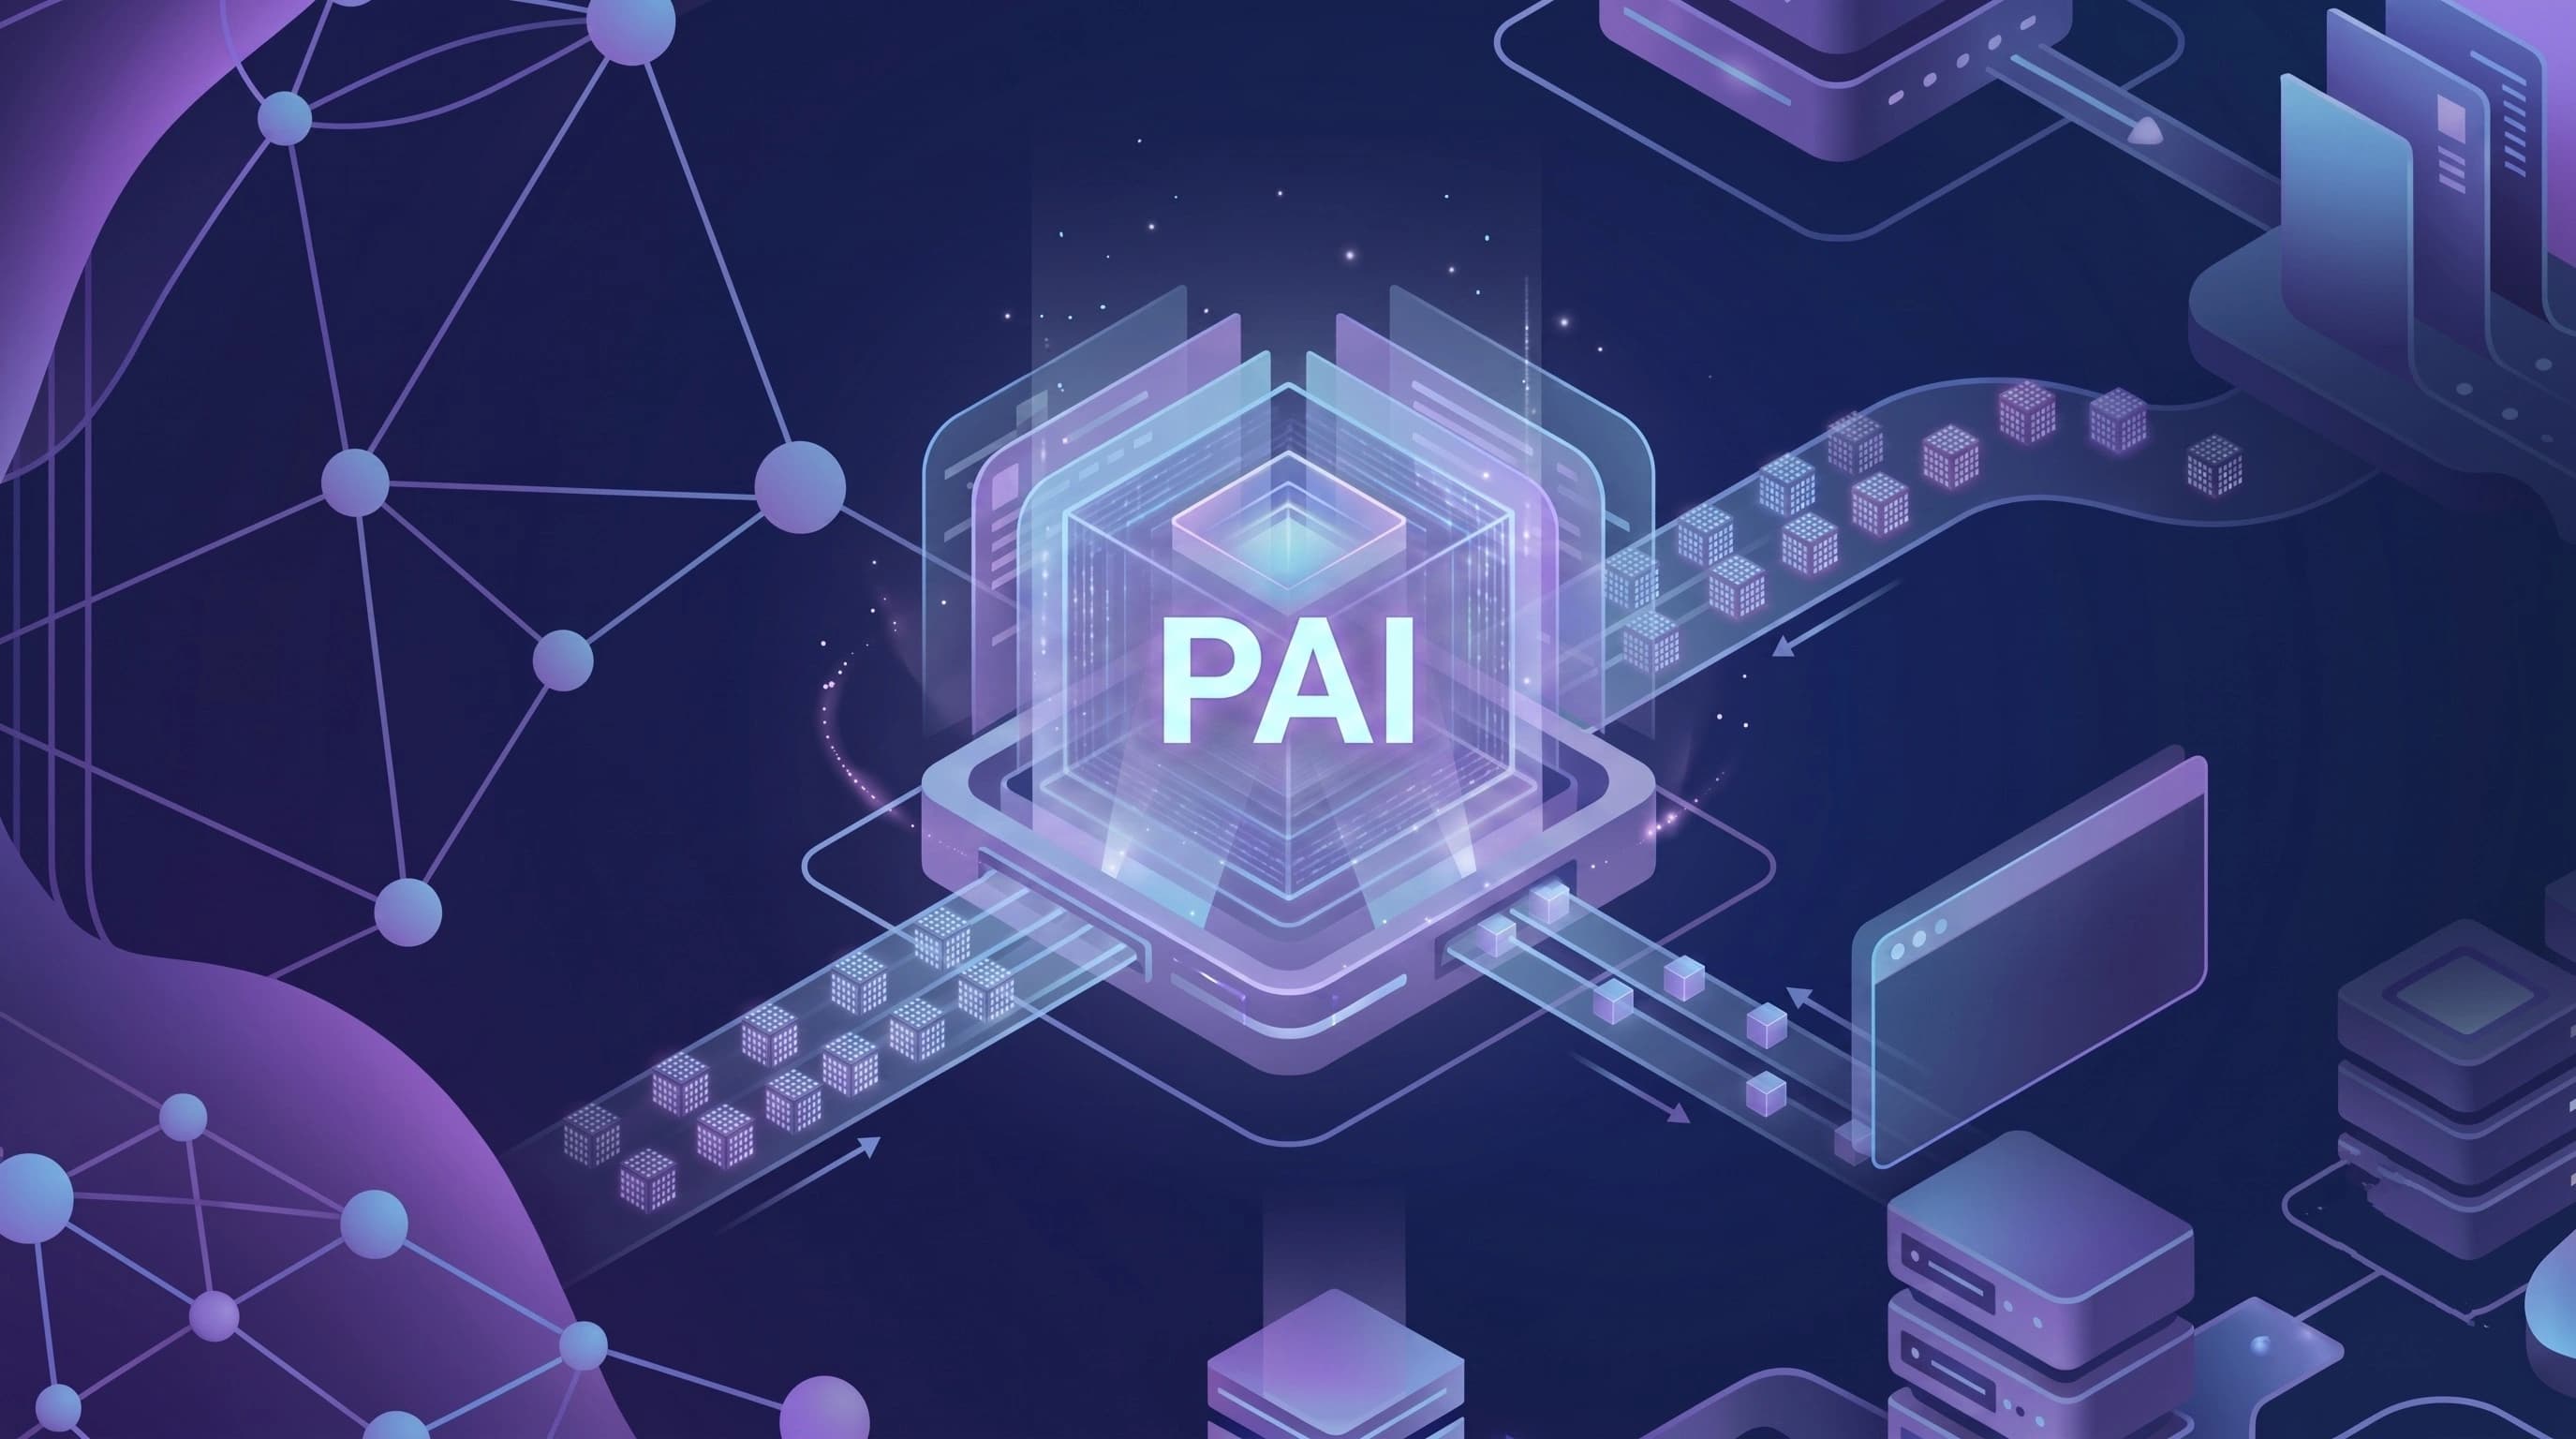
This is the problem Parseable Auto Instrumentation, or PAI, is built for. It is an open source Kubernetes operator that collects logs, metrics, traces, and Kubernetes events from a cluster and exports them to Parseable, with zero manual OpenTelemetry configuration required.
That last phrase matters. PAI is not a new telemetry protocol. It does not try to replace OpenTelemetry. It uses the OpenTelemetry Operator and the OpenTelemetry Collector as the collection layer. What it adds is a smaller, Parseable-aware control plane for platform teams who want the boring parts of Kubernetes telemetry to stay boring.
The real problem is drift
Most teams do not start with a platform-wide observability plan. They start with one service.
A team adds OpenTelemetry tracing to a Java deployment. Another team ships pod logs through a collector. Someone on the platform side writes a pipeline for kubelet metrics. Application metrics get scraped through Prometheus. Events are added later because they explain half the things that look mysterious during rollouts.
None of this is wrong. In fact, this is how most real systems grow. The problem is that every signal gets owned by a different bit of YAML, a different habit, and sometimes a different person. After a while, the cluster has telemetry, but it does not have a consistent telemetry workflow.
Drift usually shows up in small ways. A namespace has logs but no traces. A dataset name changes in one collector but not another. A service moves to a distroless image and runtime detection stops being obvious. A workload is redeployed without the annotation it needs. A staging cluster works, production almost works, and nobody wants to diff collector configs during an incident.
PAI is an attempt to make that workflow explicit. The platform team defines a ParseableConfig custom resource. That one object says where Parseable is, how to authenticate, which datasets to write to, which namespaces are in scope, which signals are enabled, and which runtimes should be instrumented. PAI reconciles the OpenTelemetry resources from there.
You still use Kubernetes. You still use OpenTelemetry. You can still inspect the collectors. You just do not have to hand-maintain every receiver, processor, exporter, header, and pipeline for every cluster.
How PAI fits in
PAI sits above the OpenTelemetry Operator.
The OpenTelemetry Operator knows how to manage OpenTelemetryCollector and Instrumentation resources. PAI knows how Parseable expects logs, metrics, traces, and events to arrive. The two work together.
ParseableConfig
  |
  v
PAI operator
  |
  | reconciles
  v
OpenTelemetry Operator resources
  |
  +-- pai-log-collector                 DaemonSet collector
  +-- pai-metrics-events-collector      Deployment collector
  +-- pai-traces                        Deployment collector
  +-- pai-instrumentation-collector-v1  Instrumentation CR
  +-- pai-agent                         DaemonSet for runtime detection
  |
  v
Parseable datasets
The flow is intentionally plain. PAI does not hide OpenTelemetry from you. It generates standard OpenTelemetry resources and keeps them reconciled. If you want to see what was created, you can inspect it with the same tools you already use.
kubectl get opentelemetrycollector -n pai-system
kubectl get instrumentation -n pai-system
kubectl get pods -n pai-system
This helps when something goes wrong. You get a higher-level API, but the generated collectors and instrumentation resources remain ordinary Kubernetes objects.
Start with one namespace
The safest way to understand PAI is not to imagine turning it on for the whole cluster on day one. Start with one namespace.
Suppose the shop namespace contains a checkout service. You want pod logs, resource metrics, traces, and Kubernetes events in Parseable. A ParseableConfig can describe that boundary directly.
apiVersion: observability.parseable.com/v1alpha1
kind: ParseableConfig
metadata:
  name: production
  namespace: pai-system
spec:
  target:
    endpoint: https://<YOUR_PARSEABLE_OTLP_ENDPOINT>
    authType: apiKey
    encoding: json
    credentialsSecret:
      name: parseable-creds
      namespace: pai-system

  logs:
    podLogs:
      enabled: true
      targetDataset: shop-logs
      namespaceSelector:
        mode: include
        namespaces: [shop]

  metrics:
    clusterMetrics:
      targetDataset: shop-metrics
      namespaceSelector:
        mode: include
        namespaces: [shop]
      k8sCluster:
        enabled: true
      kubelet:
        enabled: true

  events:
    enabled: true
    targetDataset: shop-events
    namespaceSelector:
      mode: include
      namespaces: [shop]

  traces:
    targetDataset: shop-traces
    namespaceSelector:
      mode: include
      namespaces: [shop]
    instrumentation:
      languages: [java, python, nodejs, dotnet]
      detectionTimeout: "1m"
The nice part is not that this YAML is short. The nice part is that it becomes the place where the platform team can reason about intent. Logs go to shop-logs. Metrics go to shop-metrics. Events go to shop-events. Traces go to shop-traces. The namespace boundary is visible. The authentication path is visible. The runtime list is visible.
Under the hood, PAI creates the collectors, service accounts, RBAC, instrumentation resources, and exporter headers needed to make that happen.
The signals do not all behave the same
A lot of observability setup gets confusing because we talk about logs, metrics, traces, and events as if they are just four checkboxes. In Kubernetes, they are four different collection problems.
Logs are node-local. PAI runs pai-log-collector as a DaemonSet so each node can read pod logs from paths such as /var/log/pods. The collector parses container log records, enriches them with Kubernetes metadata, and sends them to the configured Parseable log dataset.
Kubelet metrics also fit naturally into the DaemonSet shape because each collector instance can talk to the kubelet on its own node. That keeps node-local resource telemetry close to where it is produced.
Cluster metrics, Prometheus scrapes, and Kubernetes events use pai-metrics-events-collector, a deployment-mode collector. Cluster metrics can use receivers such as k8s_cluster and kube-state-metrics when enabled. Application metrics can be configured through spec.metrics.scrapeConfigs, where PAI builds Prometheus scrape pipelines from selectors, ports, and metrics paths.
Traces use a dedicated pai-traces collector. Application pods do not need to export directly to Parseable. They send spans to the stable in-cluster pai-traces-collector service. That collector owns the Parseable endpoint, API key, dataset, OTLP encoding, and headers.
This split is the point. PAI does not force every signal through one collector shape just because that would look neat in a diagram. It uses the collector mode that fits the signal.
Runtime detection is messier than it looks
Auto-instrumentation sounds simple until you meet production images.
An image named checkout-java is easy. An internal platform image with a generic name is not. A distroless container may not have a shell. Sometimes the runtime is obvious from the image name, sometimes it has to be inferred from the running process.
PAI handles this in stages. It checks known image patterns, probes running workloads when possible, and uses a node-level pai-agent for cases such as distroless containers. The agent can inspect host process information so PAI can still identify runtimes when ordinary exec-based inspection is not available.
Once the runtime is detected, PAI annotates the workload for the matching OpenTelemetry auto-instrumentation path. The OpenTelemetry Operator then injects the SDK through the Instrumentation resource. PAI currently configures auto-instrumentation images for Java, Python, Node.js, and .NET.
The result is not supposed to be mysterious. It is supposed to be inspectable.
kubectl get parseableconfig production -n pai-system -o yamlThe status.workloads field shows the workload, image, detected language, and instrumentation status. If a workload was skipped or detection failed, that status is where you start.
Rollout control is part of the feature
Cluster-wide automation needs brakes.
PAI supports namespaceSelector on Kubernetes-aware signal configs. Use include when you want to start with a known set of namespaces. Use exclude when you want everything except system or noisy namespaces. If you omit the selector, PAI collects from all namespaces for that signal.
For traces, workloadSelector gives you another level of control. You can instrument only workloads with a specific label.
spec:
  traces:
    targetDataset: shop-traces
    workloadSelector:
      mode: include
      matchLabels:
        observability: enabled
That makes the rollout less heroic. Start with one namespace. Add one workload label. Check the data in Parseable. Then expand. This is not glamorous, but it is how platform changes survive contact with production.
Headers, datasets, and tenants
Collectors need more than an endpoint. They need the right dataset headers, authentication headers, log-source headers, and tenant headers when tenancy is configured.
PAI generates those Parseable exporter headers from the ParseableConfig. It sets authentication, X-P-Stream, X-P-Log-Source, and tenant headers when needed. Custom headers can be set globally under spec.target.headers or per signal under fields such as spec.traces.headers, spec.logs.podLogs.headers, and spec.metrics.clusterMetrics.headers.
The target supports API key authentication through a Kubernetes Secret.
kubectl create secret generic parseable-creds \
  --from-literal=apiKey=<PARSEABLE_API_KEY> \
  -n pai-system
The CR references the secret. The credential stays in Kubernetes Secret storage.
This is one of those small pieces that gets annoying fast when every collector pipeline is maintained by hand. With PAI, the headers are generated consistently, and built-in headers take precedence over custom values.
Security boundaries should be obvious
Auto-instrumentation should not require you to stop asking security questions.
PAI creates RBAC for collector service accounts so the OpenTelemetry receivers can read the Kubernetes resources they need. Parseable credentials live in the referenced Secret. Generated collectors, instrumentation resources, service accounts, and workload annotations are visible through Kubernetes.
The component to review closely is pai-agent. It exists for runtime detection, including distroless workloads, and runs as a privileged host-PID DaemonSet with host /proc mounted read-only. That access is what lets it inspect process information when normal container inspection is not enough.
For many platform teams, this is a reasonable tradeoff. For tightly restricted clusters, it is something to review explicitly before rollout. PAI gives you namespace and workload selectors so the blast radius can stay deliberate.
Day two behavior
The first install matters, but day two matters more.
PAI is a reconciler. If you update the ParseableConfig, it updates the generated OpenTelemetry resources. If you delete the ParseableConfig, it cleans up the collectors, instrumentation, annotations, and agent it created.
You can also pause collection without deleting the configuration.
spec:
  paused: true
When paused, PAI removes the generated collection resources. Set it back to false, and the operator reconciles them again.
Troubleshooting follows the same path as any other Kubernetes-operated system. Check the CR status. Then check the collector logs.
kubectl get parseableconfig production -n pai-system -o yaml
kubectl logs -n pai-system deployment/pai-traces-collector --all-containers --tail=200
kubectl logs -n pai-system deployment/pai-metrics-events-collector-collector --all-containers --tail=200
For pod logs, look at the relevant pai-log-collector DaemonSet pod on the node you are investigating.
What you get in Parseable
Once the signals land in Parseable, the workflow becomes much shorter.
Start with a trace in shop-traces. Follow the service and time window into shop-logs. Check resource pressure in shop-metrics. Look at shop-events if the timeline points toward scheduling, restarts, image pulls, or other Kubernetes actions.
The signals stay in separate datasets because they are different telemetry types. But the setup comes from one Kubernetes object, and that is what changes the operational feel. Instead of asking "which collector owns this?" you can ask the more useful question: "what did the system do?"
That is the kind of observability platform teams need. Not just a prettier dashboard, but a reliable way to ask better questions when the system is doing something you did not expect.
Try PAI
With the OpenTelemetry Operator already installed, the first run is intentionally small.
helm install pai pai --repo https://charts.parseable.com -n pai-system --create-namespace
kubectl create secret generic parseable-creds -n pai-system --from-literal=apiKey=<PARSEABLE_API_KEY>
kubectl apply -f parseableconfig.yaml
PAI requires Kubernetes 1.26 or later, Helm 3, and OpenTelemetry Operator 0.99.0 or later. The PAI documentation covers the full configuration schema and the OpenTelemetry Operator prerequisite. The PAI GitHub repository contains the source code, generated collector examples, and troubleshooting details.
If you already run Kubernetes and think in OpenTelemetry, PAI should feel familiar. It gives you a Parseable-aware control plane for the OpenTelemetry resources you would otherwise assemble by hand.
Open source, Kubernetes-native, OpenTelemetry-based, and boring enough to operate. That is the bar.