
Sometimes you just need a quick way to ask your telemetry data a question from the terminal. You may want to run a SQL query, check a PromQL expression, tail a dataset during a deploy, or verify which environment your script is pointing to.
A CLI helps in those moments because it keeps the workflow close to the tools developers already use. The query can sit next to the code, the shell history, the runbook, or the jq pipeline that is already part of the work.
Parseable supports this through pb. It is the command line interface for Parseable, built for developers and operators who want to work with logs, metrics, datasets, profiles, and live events without leaving the shell.
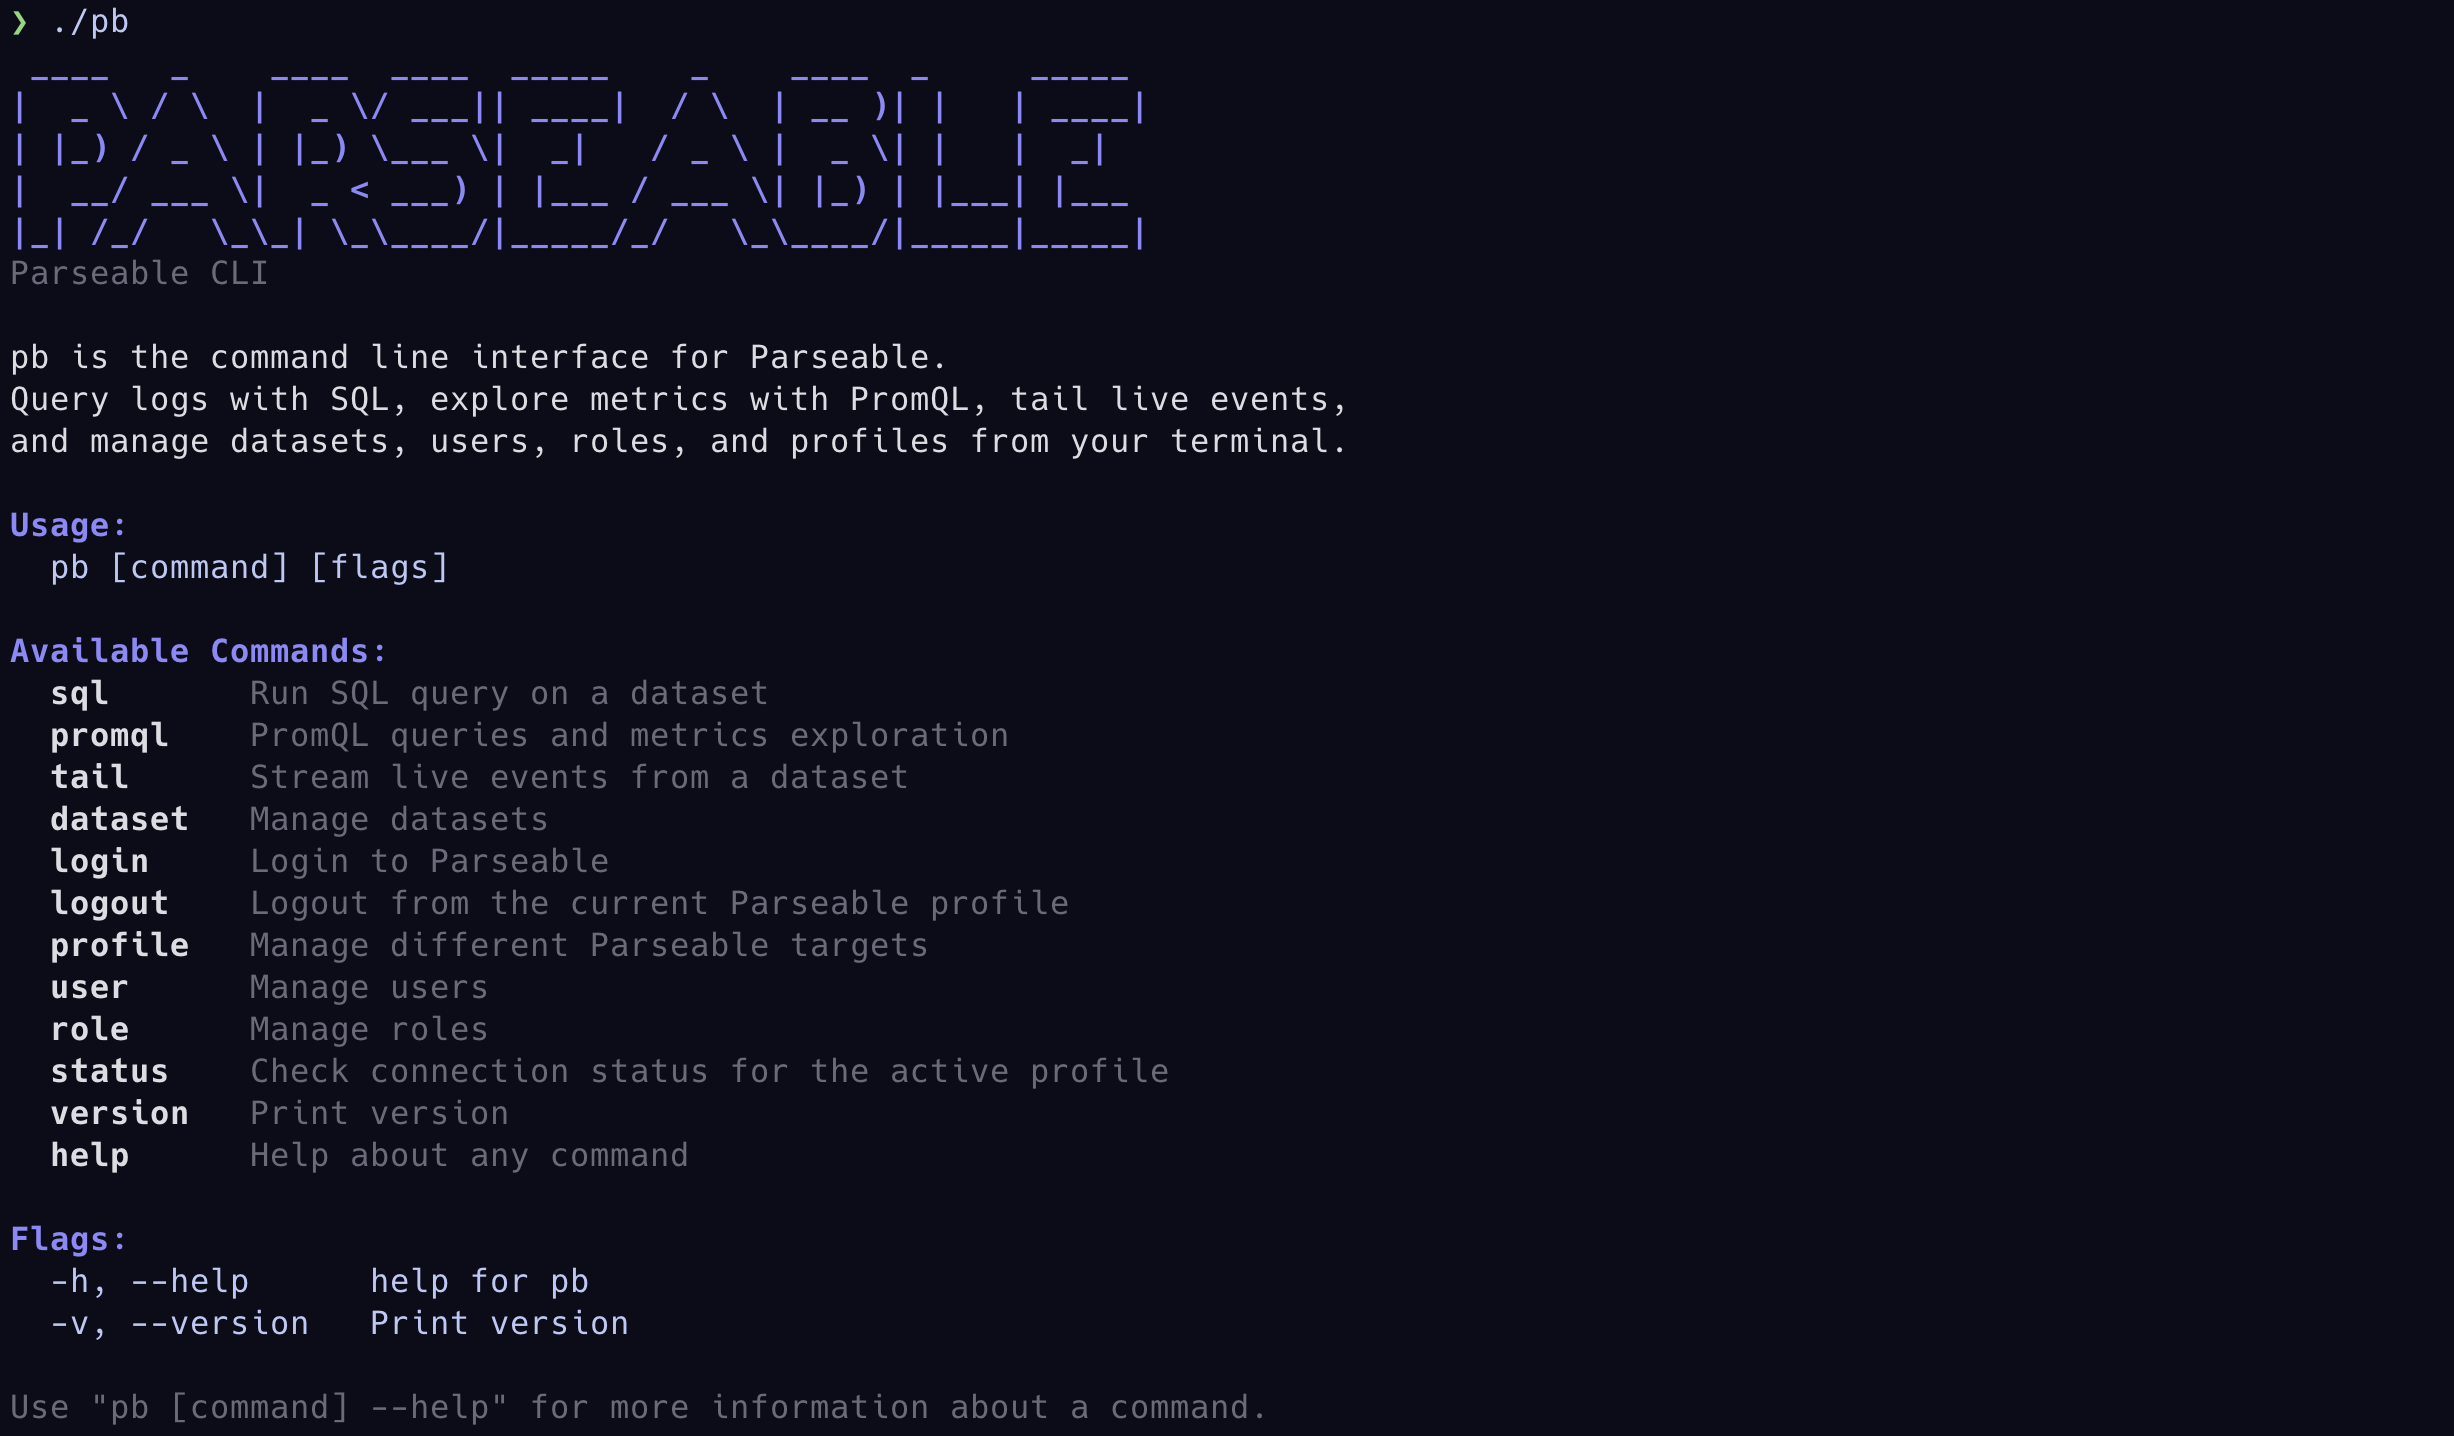
If your next step is already in the terminal, pb lets you keep going from there.
Why we built pb
Telemetry work often happens in small loops. Run a query. Change the time range. Check one field. Pipe the result into another command. Try the same thing against staging. Share the command with someone else.
That loop needs a tool that feels natural in a shell. If every command is just a long API call with flags, the CLI starts to feel like an integration task instead of part of the investigation.
pb is meant to sit in the middle. It gives you a terminal-native way to work with Parseable while still keeping the flow familiar. You can open an interactive view when you want to explore, or ask for JSON when another tool needs to read the output.
pb sql run -i
pb dataset list -o json
The same command surface works for direct investigation, shell scripts, scheduled checks, and agent workflows.
Start from the question
When something looks off, you usually know the first question before you know the answer. Maybe the checkout service started returning errors. Maybe a deployment changed latency. Maybe you want to confirm whether a noisy log line is still coming in.
With pb, you can start there instead of first setting up a view.
pb sql run "SELECT * FROM backend WHERE status >= 500 LIMIT 50" --from=1h --to=nowIf the query needs a little more space, open the interactive SQL view.
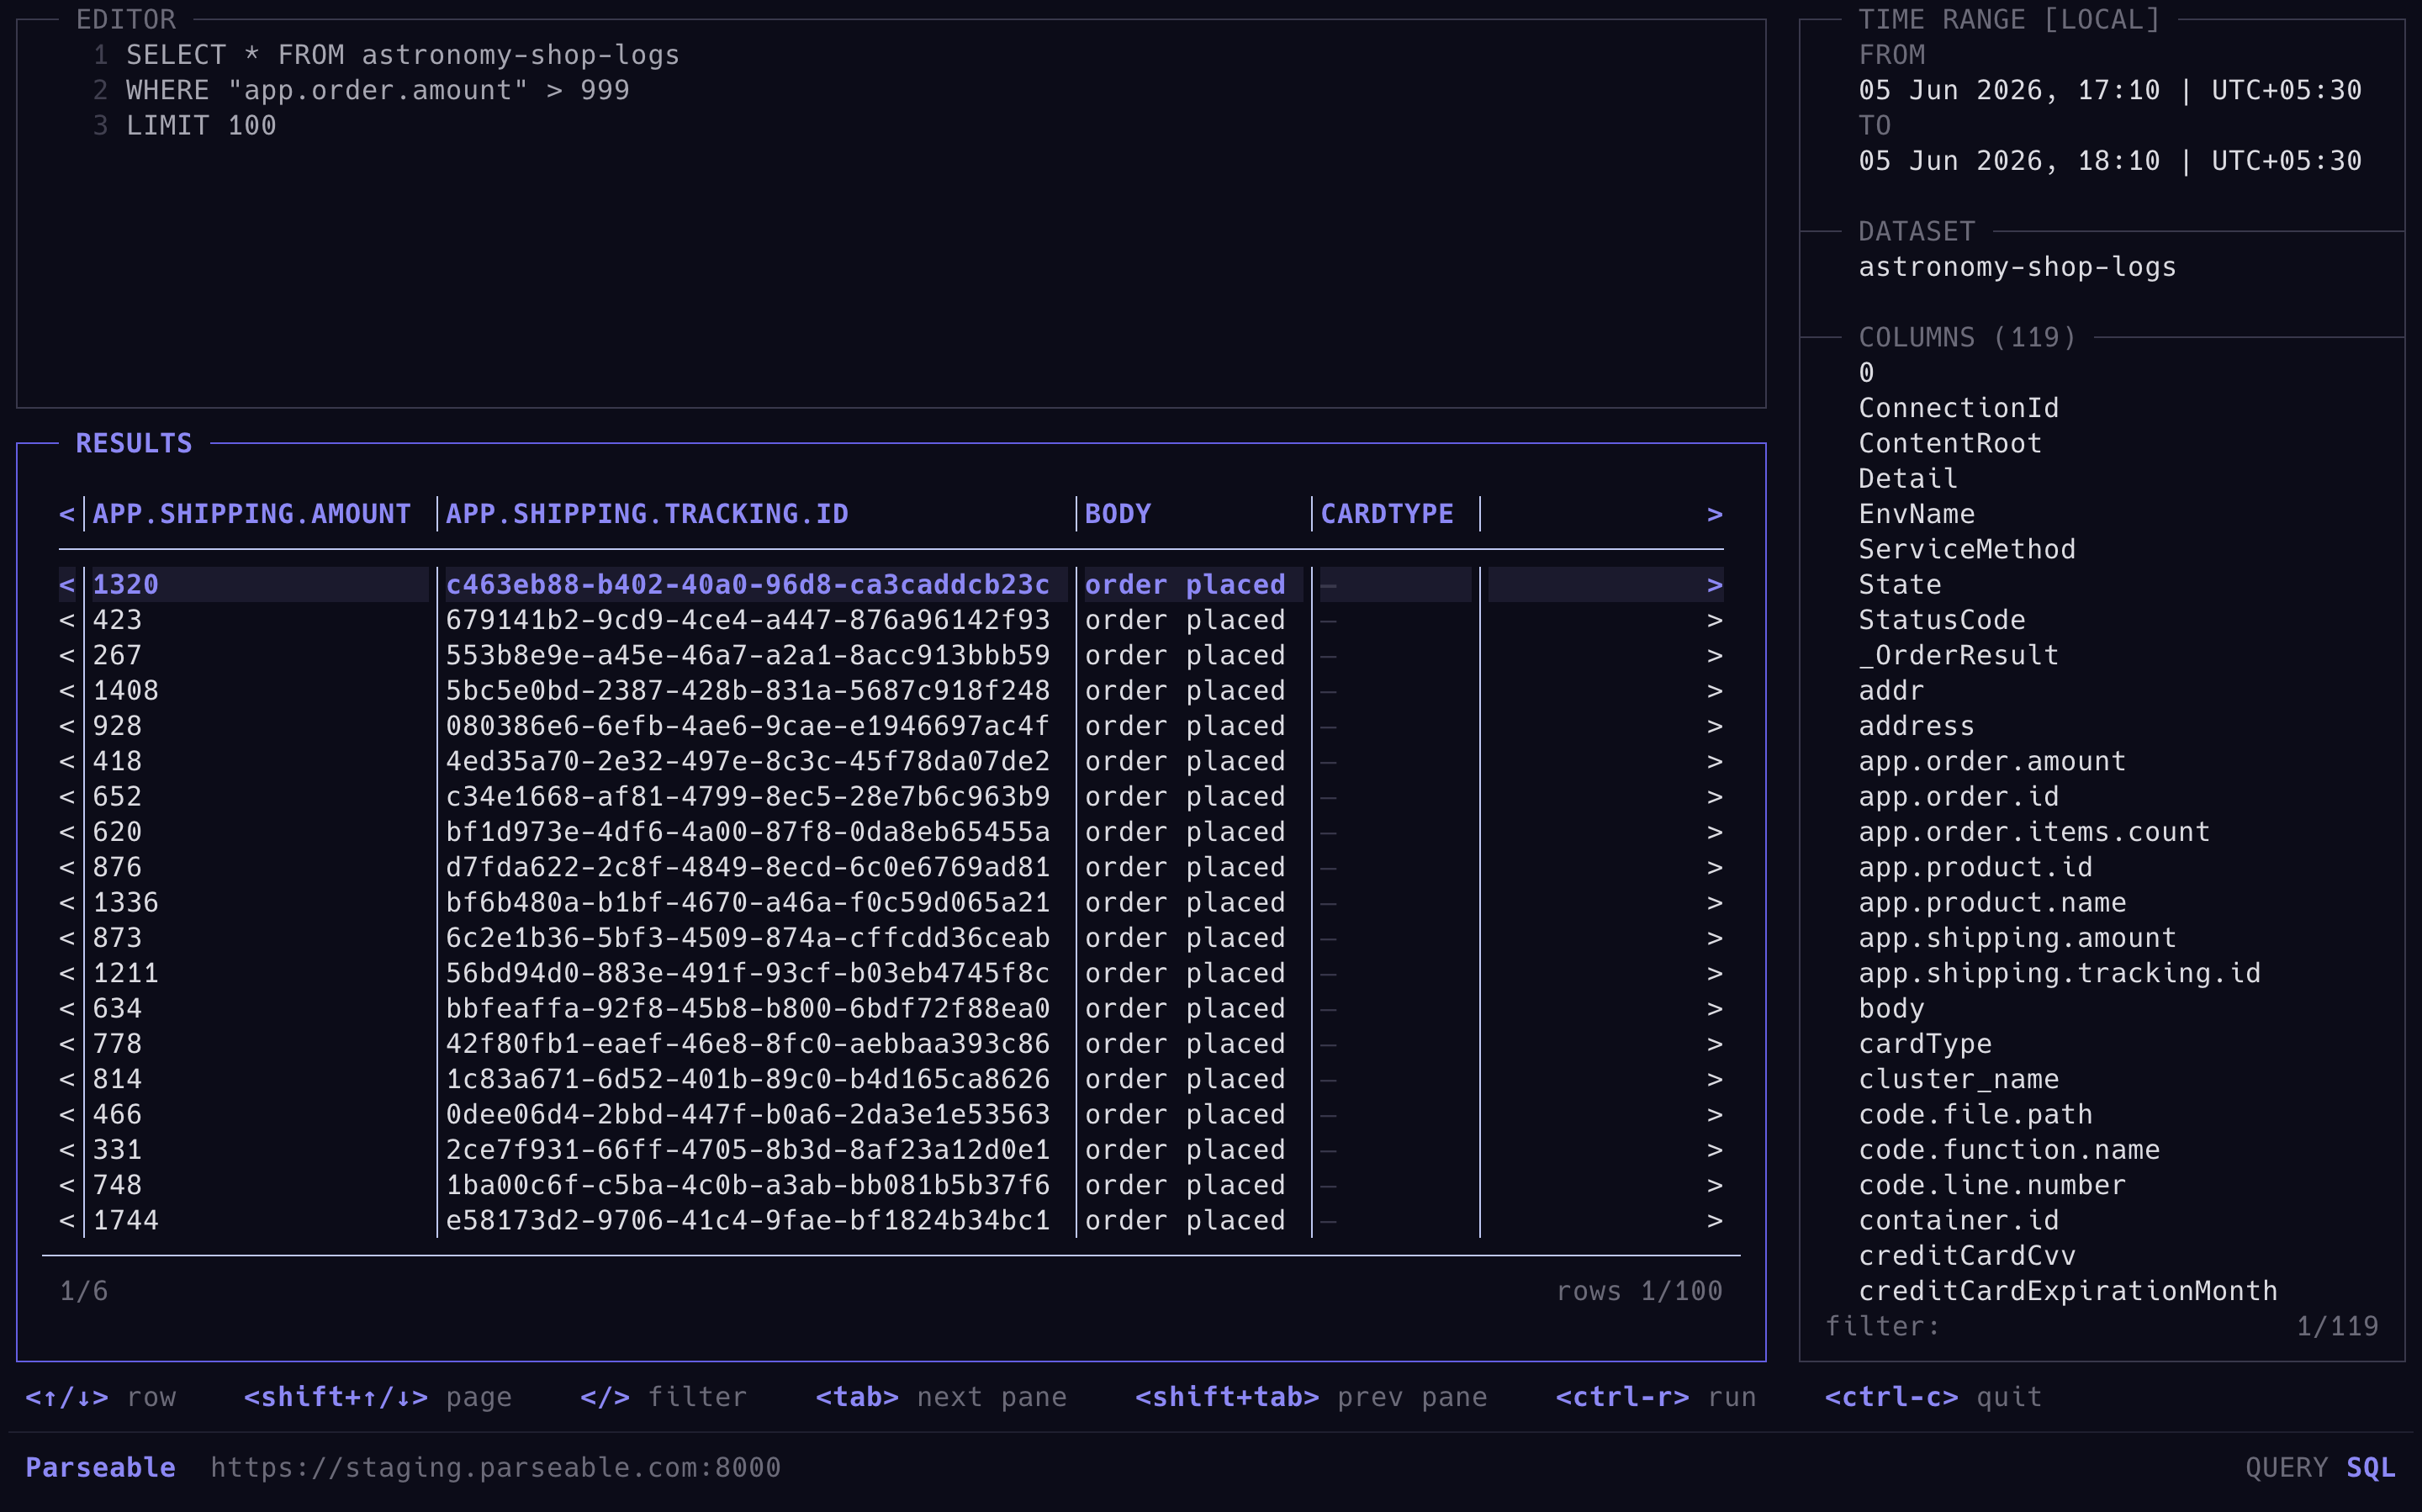
The interactive view is useful when you are still shaping the question. You can select the dataset, edit the SQL, adjust the time range, choose columns, and inspect the result table from one place. It is still the terminal, but it gives you enough structure to move through the data without constantly rebuilding the command.
This is especially helpful when a query starts somewhere else. An alert, a runbook, or a teammate may already give you the rough SQL. You can bring that query into pb, open it interactively, and keep narrowing it until the useful records are visible.
Metrics belong in the same loop
Logs are not always the first signal. Many investigations start with a metric. Error rate moved. Latency spiked. A queue grew. A service started using more CPU than expected.
pb includes PromQL support so metrics can stay in the same terminal workflow.
pb promql run "rate(http_requests_total[5m])" --dataset otel_metrics --from=1h --step=1mWhen you want to explore instead of running a one-off expression, the interactive PromQL view gives you a place to select the metrics dataset, write the expression, choose the time window, and inspect the result.
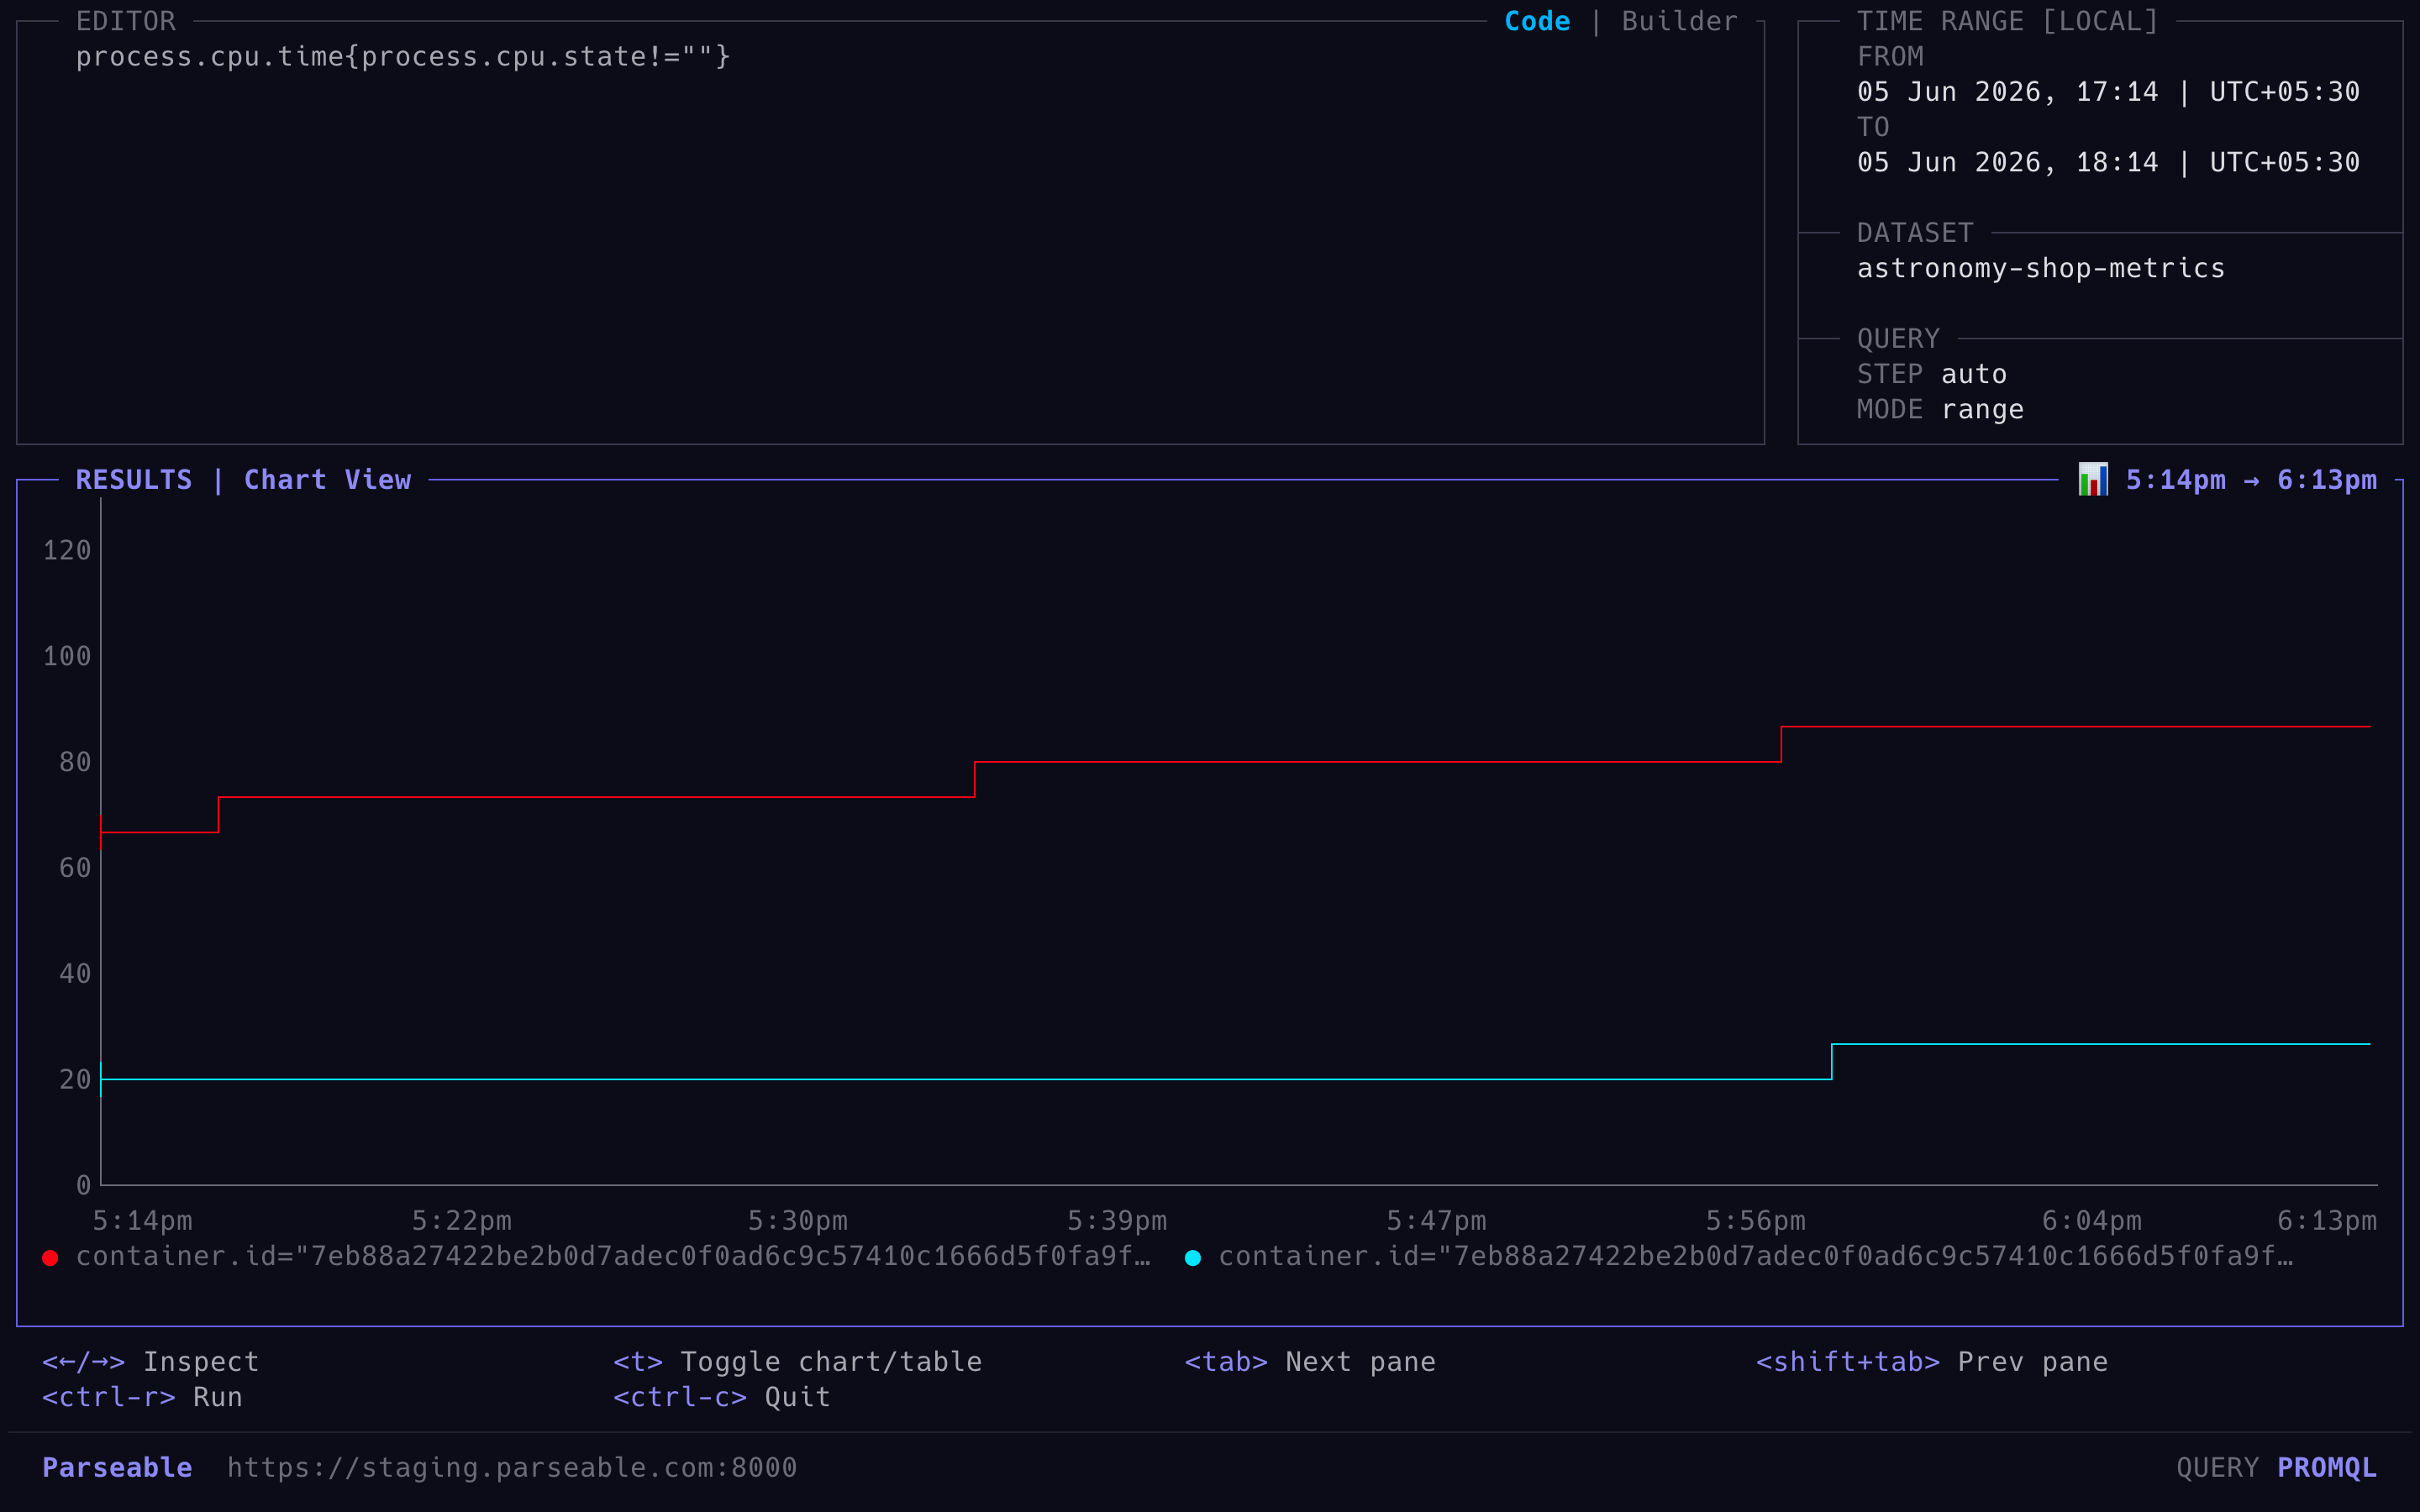
This is not only about reading a value. Sometimes the metric itself needs investigation. You may want to list labels, inspect series, or understand why a label set became noisy. pb includes commands for labels, series, cardinality, active queries, and TSDB statistics, so you can keep that work in the same context.
Live tail is still useful
There are times when a historical query is not enough. During a rollout, a rollback, or a reproduction, you want to see new events as they arrive.
pb tail backend_logsThis is a small feature, but it is one developers reach for often. Keep it running while you hit an endpoint or deploy a fix. If you need to filter the stream, ask for JSON and use the tools you already know.
pb tail backend_logs -o json | jq 'select(.level == "error")'pb tail uses gRPC, so the Parseable server's gRPC port needs to be reachable from the machine running the CLI. The important part is that live tail does not become a separate debugging path. The events are still stored in Parseable, and anything interesting can become the next SQL query.
Profiles make environments explicit
Most engineers work across more than one Parseable environment. Local, staging, production, and cloud workspaces all show up in daily work. The risky part is not switching between them. The risky part is forgetting where a command is pointed.
pb handles this with named profiles.
pb profile list
pb profile default staging
pb status
Once the active profile is set, SQL, PromQL, tail, dataset, user, role, and status commands use that same target. It makes the current context visible and repeatable.
The login flow supports self-hosted Parseable and Parseable Cloud. For self-hosted environments, profiles can use username and password or an API key. For Parseable Cloud, pb cloud profile add lets you add a profile with a Cloud API key.
If you no longer need the active profile, pb logout removes it from the local config.
Structured output for scripts and agents
The default output is meant to be readable in a terminal. But a CLI becomes much more useful when the output can also be consumed by other tools.
pb status -o json
pb dataset list -o json
pb sql run "SELECT COUNT(*) FROM backend" --from=1h --output json
This makes pb useful in scripts, CI jobs, and scheduled checks. Empty collections return as arrays, failures use a structured error envelope, and commands return a nonzero status when work fails.
It also helps with coding agents. An agent that is trying to investigate a failing service needs context, but it should not get broad production access just because it needs to read telemetry. pb includes a read-only command catalog that an agent can discover in JSON.
pb agent -o json
pb help dataset list -o json
The catalog tells the agent which commands exist, what they can read, whether a profile is required, and which commands stream output. Server-side permissions still remain the authority, so the right pattern is to connect agents through a dedicated read-only role or API key with the minimum access they need.
Where to start
Install pb, connect it to your Parseable instance, and start with the command you are most likely to use during a real investigation. On macOS and Linux, Homebrew is the shortest path.
brew install parseablehq/tap/pb
pb login
pb status
pb sql run -i
If you are connecting to a self-hosted Parseable instance from a script or a remote machine, you can create the profile without going through the interactive login flow.
pb profile add local-key http://localhost:8000 --api-key psk_xxx
pb profile default local-key
pb status
After that, the rest of the workflow stays the same. Run SQL against log datasets, query metrics with PromQL, or tail new events as they arrive.
pb sql run "SELECT * FROM backend WHERE status >= 500 LIMIT 50" --from=1h
pb promql run "rate(http_requests_total[5m])" --dataset otel_metrics --from=1h
pb tail backend_logs
Prebuilt binaries are available for Linux, macOS, and Windows from the pb releases page. For the full setup guide, command reference, install options, and profile details, read the pb CLI documentation.
Use pb when the work is already happening in the terminal, when a script needs structured output, or when an agent needs a narrow read-only path into telemetry.
Explore the project on GitHub, try the SQL and PromQL workflows, and tell us where your terminal workflow still feels heavier than it should.