

Production work rarely stays as clean as a single request and response. A user clicks something, but behind that action there may be a workflow that runs across services, waits on external systems, retries a failed step, and continues after a restart.
In real systems, a lot of important work does not finish inside one neat request. A workflow may finish one step now, wait for another step later, retry after a temporary failure, or continue after a process restart. With AI workloads this becomes even more common. One user action can involve model calls, tool calls, database writes, external APIs, and background work that you do not want to repeat from the beginning every time something gets interrupted.
Durable execution helps with the first part of that problem. It lets the application remember what already happened and continue from a known point. But once the workflow can survive failures, teams still need visibility into the work itself.
That is usually where the real debugging starts. Which workflow ran? Which step took time? What did the application log while the workflow was running? Are workflows starting to pile up in Conductor? And when something fails, how much of the work had already completed?
Durable workflows with DBOS
DBOS gives developers a way to build durable workflows inside their application. You write workflows and steps in code, and DBOS preserves execution state so the application can continue from the right point after failures or restarts.
That model is useful for agentic and workflow-heavy applications because the application can survive crashes, restarts, redeploys, and transient errors without losing its place. A workflow can complete one step, checkpoint the result, and continue later from that point if something interrupts the process.
For developers, this changes the shape of the application. A workflow is no longer just a short request that either returns or fails. It can span multiple steps. It can wait. It can retry. It can call external systems. It can keep running while the rest of the system changes around it.
That reliability is valuable, but reliability alone does not answer every operational question. When a workflow slows down, retries, fails, or stays pending longer than expected, teams still need to understand the path it took.
Parseable for durable workflows
We are excited to announce our DBOS integration 🎉, built to help teams see what is happening inside durable workflows as they run in production.
Parseable gives teams a place to inspect the telemetry that comes from these durable workflows.
With the integration, workflow logs and traces can be sent from the application to Parseable using OpenTelemetry OTLP over HTTP. Conductor metrics follow a separate path: they are exposed through a Prometheus/OpenMetrics endpoint and then forwarded to Parseable.
So the integration gives you three useful views:
- Logs from the application
- Traces for workflow and step execution
- Metrics from Conductor
The important thing is that these are not three disconnected pieces of information. They describe the same operational system from different angles. Logs show what the application wrote. Traces show how workflow execution moved across steps. Metrics show the state of Conductor and the workflow runtime around it.
Getting started
The setup has a simple shape. Your application sends logs and traces to Parseable through OpenTelemetry. Conductor exposes runtime metrics, and those metrics can be scraped and forwarded to Parseable separately.
Send logs and traces
Start with logs and traces, because they are the easiest way to see workflow execution. In the application, enable OpenTelemetry export and point the OTLP logs and traces endpoints to Parseable.
In Parseable, each signal usually goes to its own stream. For example, you can send application logs to dbos-logs and workflow traces to dbos-traces. That keeps the data easy to explore later. When a workflow runs, logs show what the application wrote, and traces show the workflow and step spans that were produced during execution.
The application-side configuration usually looks like this at a high level:
import { DBOS } from '@dbos-inc/dbos-sdk';

DBOS.setConfig({
  name: 'dbos-node-starter',
  systemDatabaseUrl: process.env.DBOS_SYSTEM_DATABASE_URL,
  applicationVersion: '0.1.0',
  enableOTLP: true,
  otlpLogsEndpoints: [`${process.env.PARSEABLE_OTLP_ENDPOINT}/v1/logs`],
  otlpTracesEndpoints: [`${process.env.PARSEABLE_OTLP_ENDPOINT}/v1/traces`],
  otelAttributeFormat: 'semconv',
});

await DBOS.launch({
  conductorURL: process.env.DBOS_CONDUCTOR_URL,
  conductorKey: process.env.DBOS_CONDUCTOR_KEY,
});
Parseable stream headers decide where each signal lands. In practice, that means one stream for logs and one stream for traces.
X-P-Stream=dbos-logs
X-P-Log-Source=otel-logs

X-P-Stream=dbos-traces
X-P-Log-Source=otel-traces
At a high level, this path looks like:
Application
  -> OpenTelemetry OTLP logs
  -> OpenTelemetry OTLP traces
  -> Parseable streams
Once this is configured, trigger a workflow and check Parseable for fresh records in the logs and traces streams.
Forward Conductor metrics
Metrics work differently. They are not emitted directly from the application process through the same OTLP path.
Conductor exposes runtime metrics through a Prometheus/OpenMetrics compatible endpoint. These metrics describe the state of the execution system around your workflows, such as executor count, pending workflow count, and other Conductor-level signals.
For this part, Prometheus scrapes Conductor and forwards the metrics to Parseable through remote write. In Parseable, those metrics can land in a stream such as dbos-conductor-metrics.
The Prometheus configuration is also small conceptually. It scrapes Conductor and remote writes the collected metrics into Parseable.
scrape_configs:
  - job_name: dbos-conductor
    metrics_path: /v1/metrics

remote_write:
  - url: <parseable-remote-write-endpoint>
    headers:
      X-P-Stream: dbos-conductor-metrics
At a high level, this path looks like:
Conductor
  -> Prometheus scrape
  -> Prometheus remote write
  -> Parseable metrics stream
This separation is important. Logs and traces come from the application through OpenTelemetry. Metrics come from Conductor through the metrics endpoint. If you are planning to use all three signals, you should configure both paths.
Validate the setup
The first validation is not complicated. Run a workflow and check whether the expected streams are receiving data:
dbos-logsshould contain application log recordsdbos-tracesshould contain workflow and step spansdbos-conductor-metricsshould contain Conductor metrics if the metrics path is enabled
From there, you can start using Parseable the way you normally would: search logs, open traces, inspect span details, and plot metrics. For the exact configuration values, headers, and Prometheus setup, you can also refer to the Parseable DBOS guide.
What it looks like in Parseable
Once the data starts flowing, Parseable gives you different ways to inspect the same system. You can start from traces when you want the workflow path, logs when you want application context, and metrics when you want the runtime view from Conductor.
Traces
Traces are usually the best place to understand the shape of a workflow.
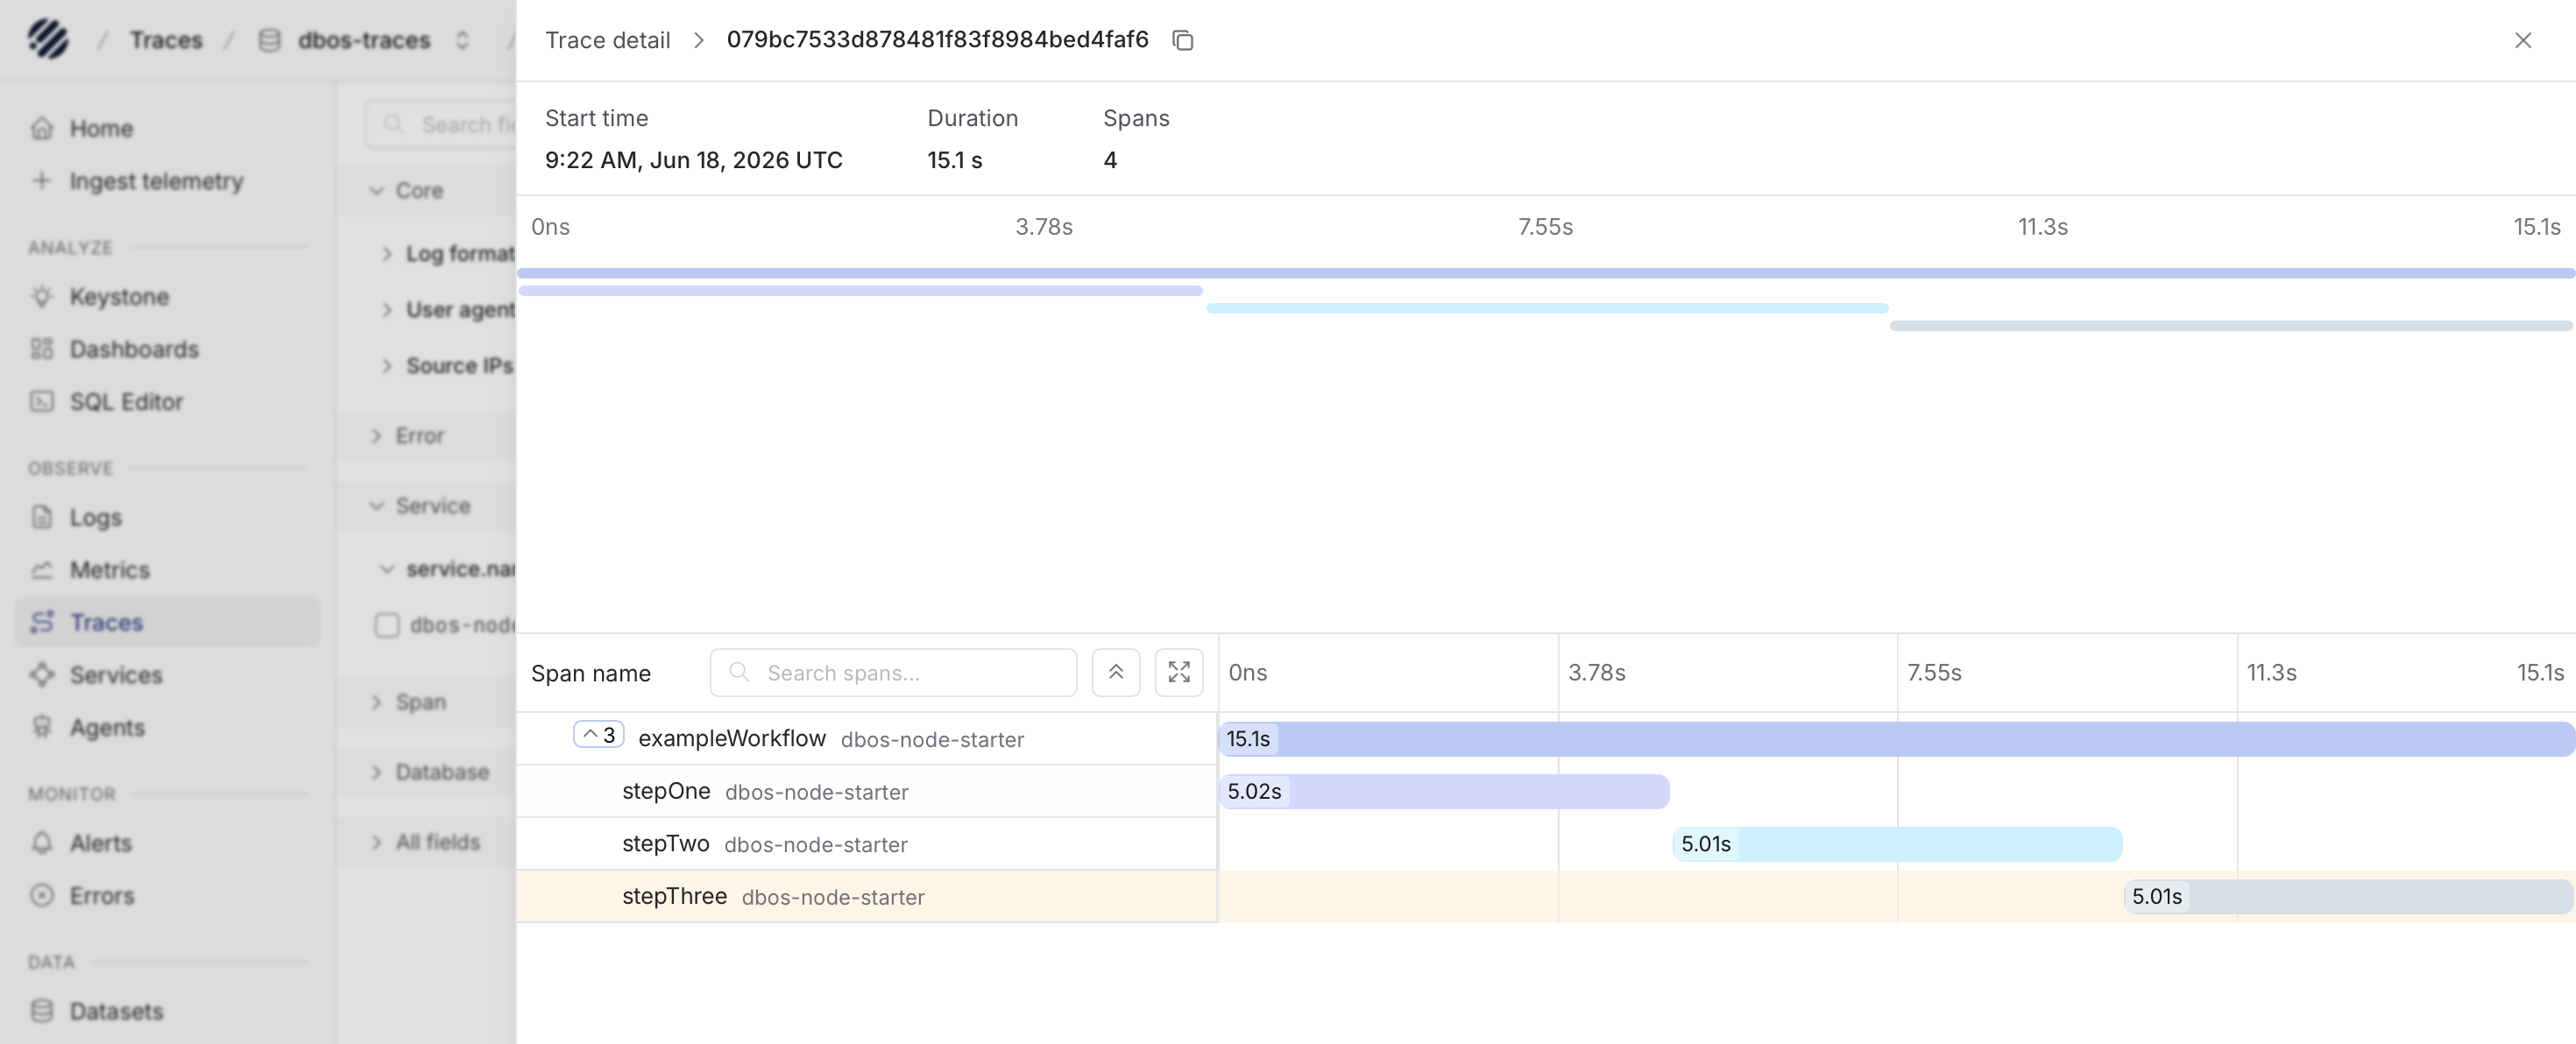
In Parseable, a trace can show the main workflow and the steps that ran inside it. This is useful because durable execution often turns one user request into a sequence of work. You may have one workflow that calls multiple steps, waits for one step to finish, then moves to the next.
When you open the trace detail view, you can see the overall workflow duration, the number of spans, and the timeline of the execution. The waterfall makes it easier to understand which step took the most time and how the steps relate to each other.
For example, a workflow can have steps such as stepOne, stepTwo, and stepThree. Looking at these as separate spans is much easier than trying to rebuild the order from logs alone. If one step takes longer than expected, the trace gives you the place to start. If a workflow fails halfway through, the trace helps you understand how far it got.
This matters a lot for durable execution because the question is often not just "did it fail?" The better question is usually "where was the workflow when it failed, and what had already completed?"
Logs
Logs are still where a lot of operational context lives. A trace can show that a step happened and how long it took, but the log line often explains what the application was doing at that moment.
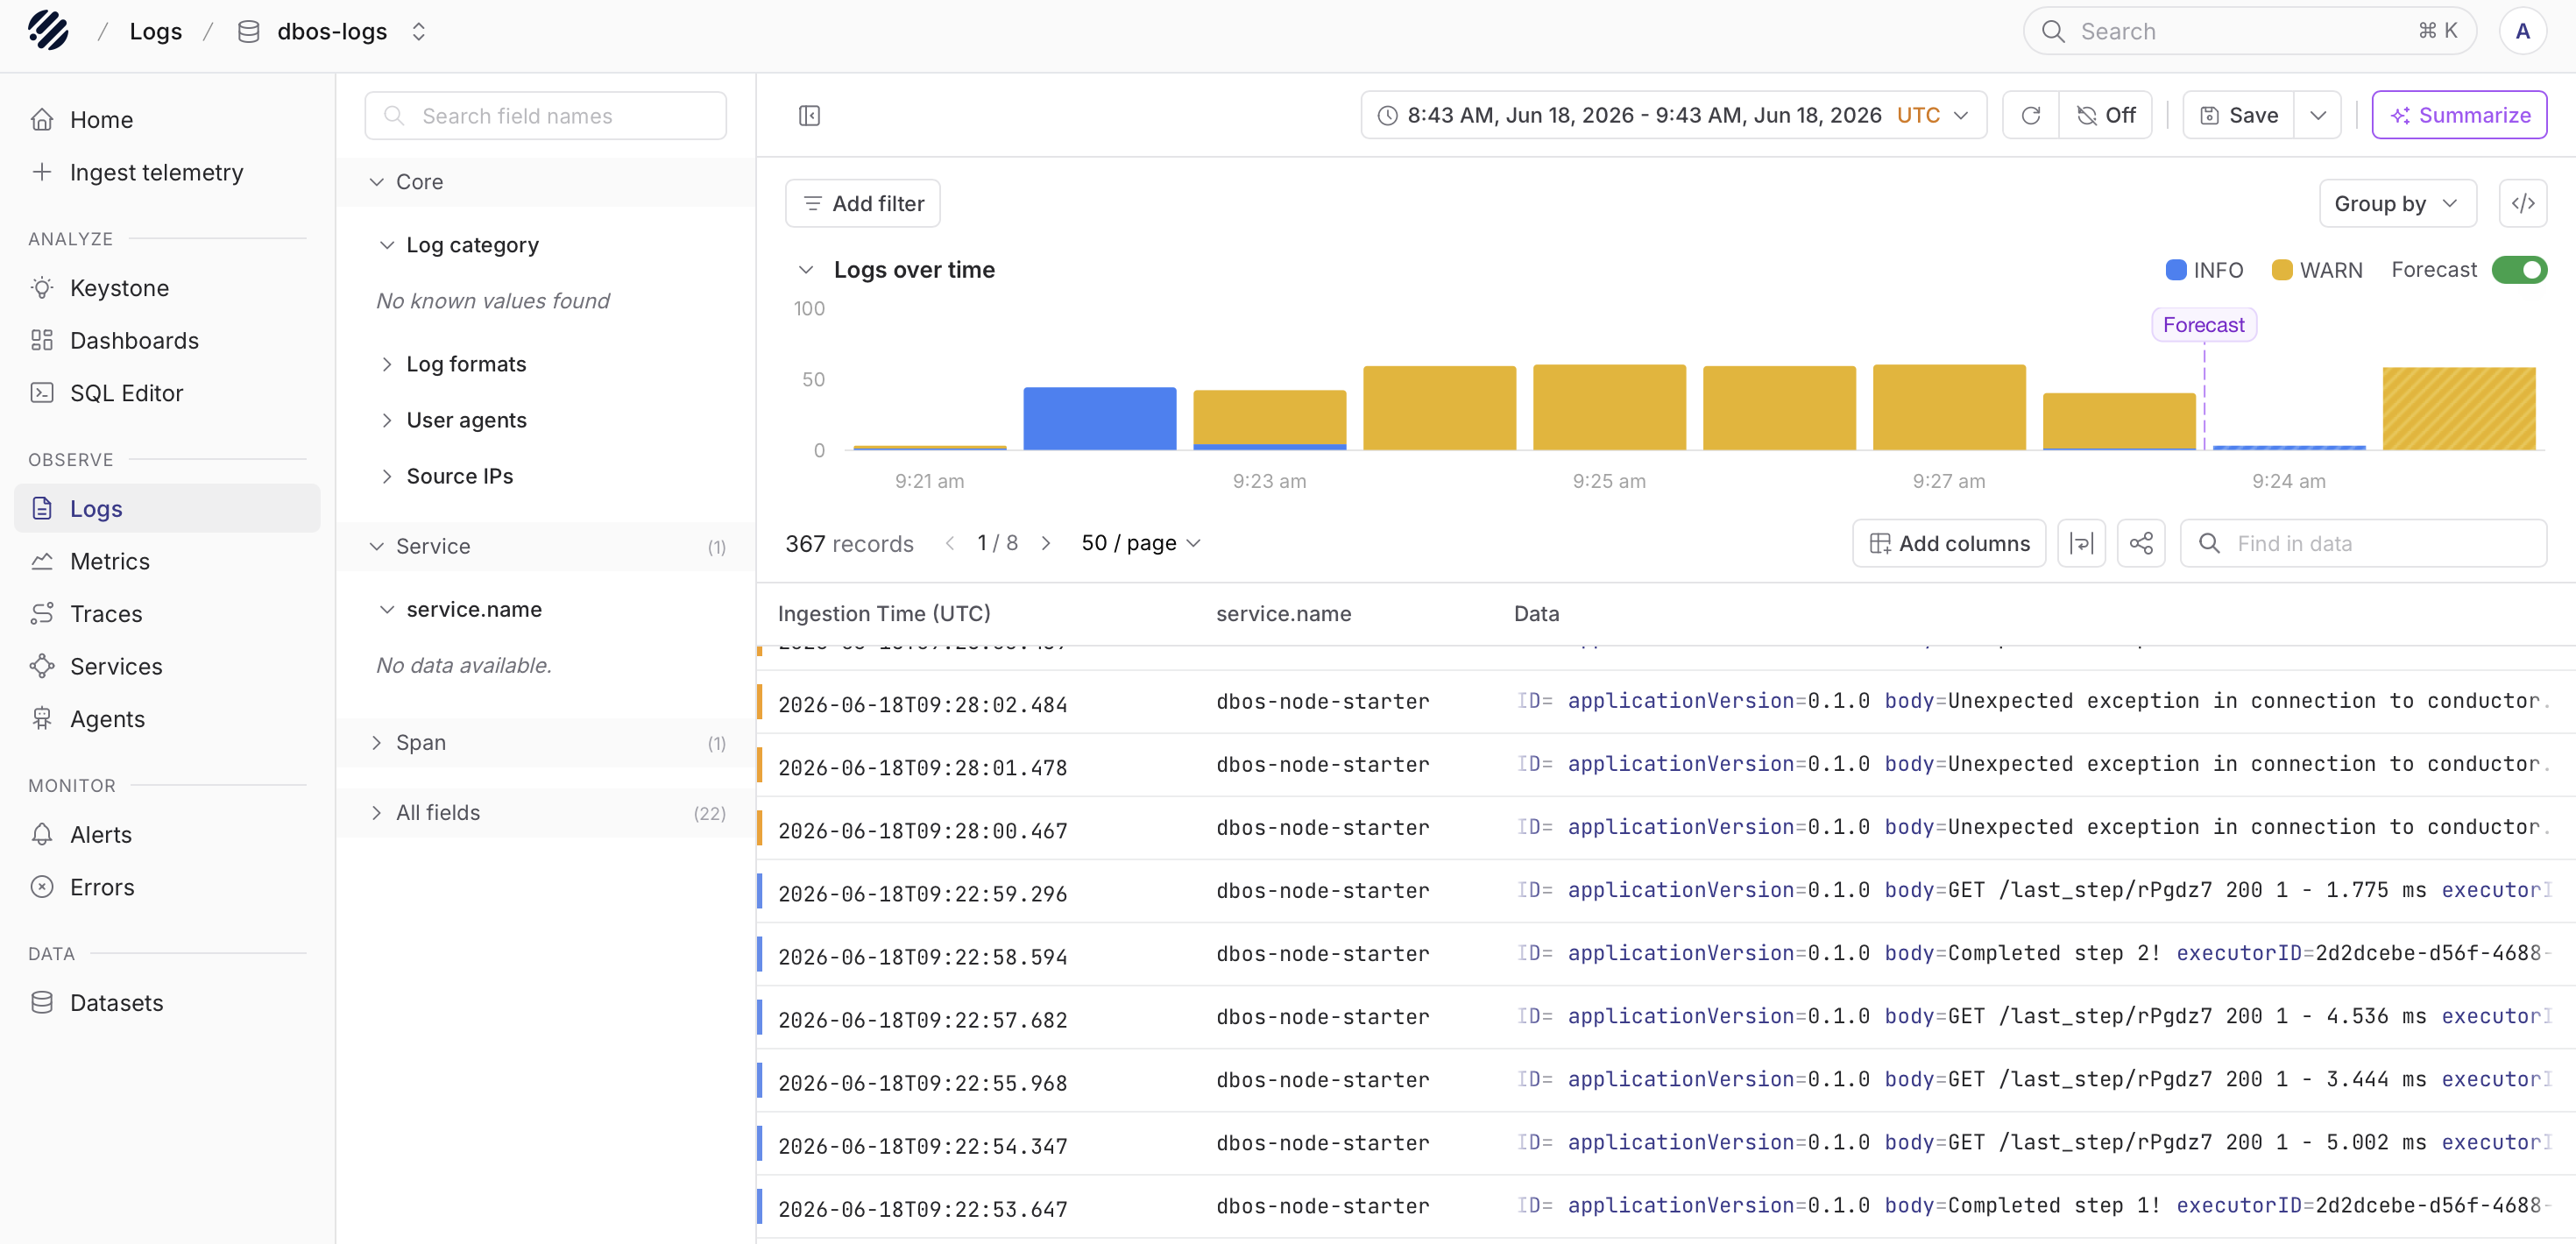
With logs in Parseable, users can inspect records from the application in the Logs page. The top chart gives a quick view of log volume over the selected time range. The table below shows the matching log records, including fields such as ingestion time, service name, and the log body.
This makes it easier to answer day-to-day questions:
- Did the application write an error during the workflow?
- Which service produced the log?
- What happened before or after a workflow step completed?
- Are the same messages repeating across a short time window?
You can also use the field panel and search controls to narrow the data. For example, if you are looking at a service such as dbos-node-starter, you can filter around that service and inspect only the records that matter for the workflow you are debugging.
The value here is simple. Durable execution keeps the application from losing progress, and logs help you see what the application said while that progress was happening.
Metrics
Metrics tell you what is happening around the execution system over time. The important distinction is that metrics do not come from the application process through the same OTLP path used for logs and traces.
Conductor exposes metrics through its /v1/metrics endpoint in a Prometheus/OpenMetrics compatible format. From there, Prometheus can scrape the endpoint and forward the metrics to Parseable.
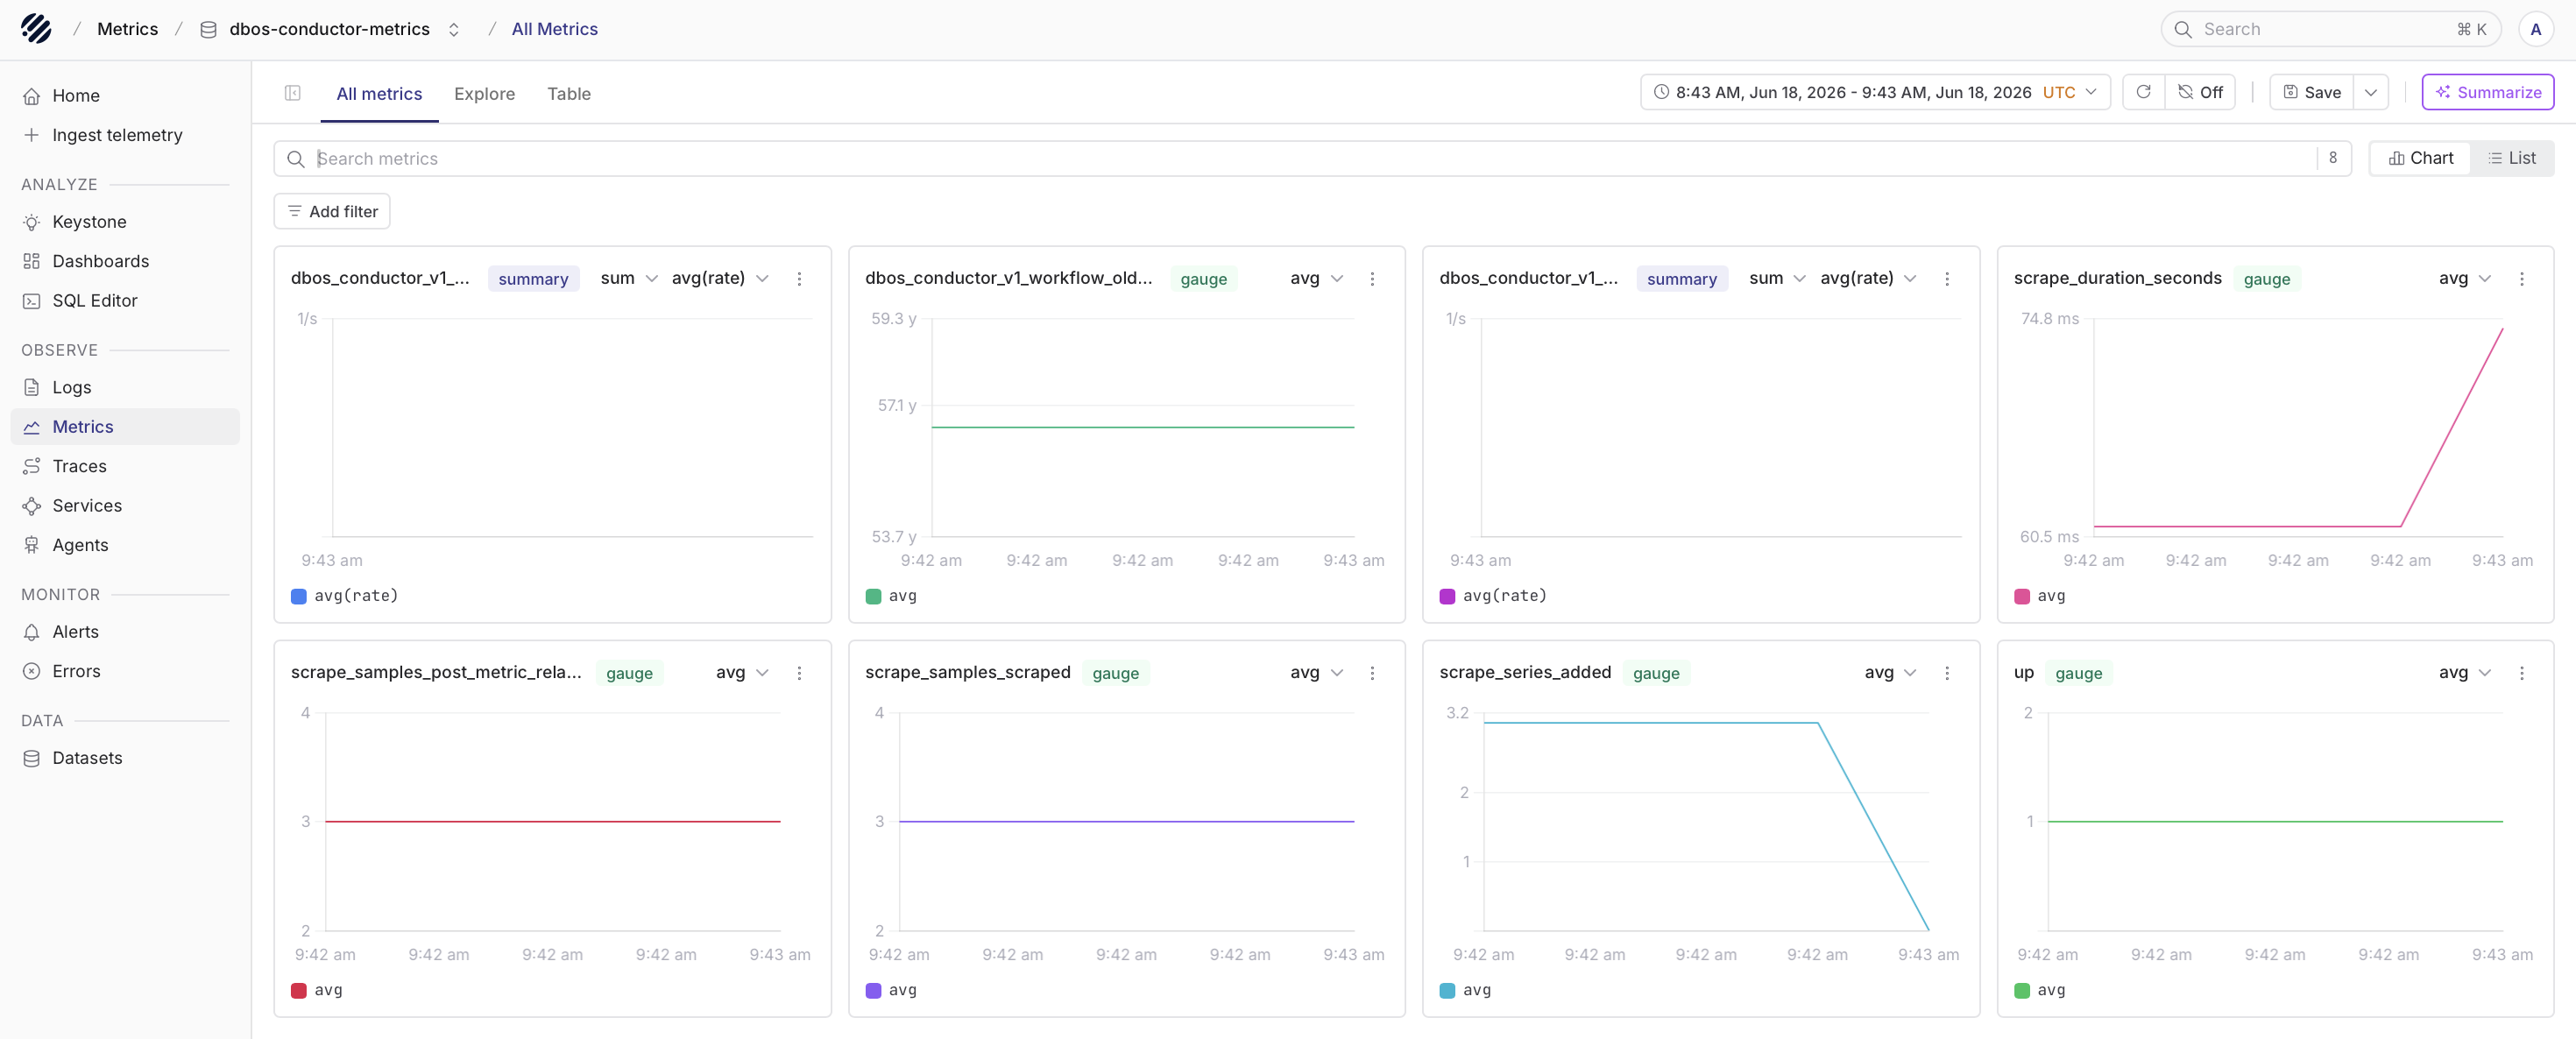
Once the metrics are in Parseable, users can inspect Conductor metrics from the Metrics page. This includes signals such as executor count, pending workflow count, the oldest pending workflow timestamp, scrape duration, and other runtime-level signals.
These metrics are useful when the issue is not inside one single workflow. Sometimes the problem is broader:
- Workflows are piling up.
- Executors are not keeping up.
- A queue is moving slower than expected.
- The Conductor metrics endpoint is being scraped, but the values show an unhealthy runtime.
In those cases, the metrics view gives you the higher-level signal before you drill into logs or traces.
For this path, users need Conductor and Parseable Enterprise metrics support. Without Conductor, there is no /v1/metrics endpoint to scrape. Without Parseable Enterprise metrics support, those metrics cannot be queried through Parseable PromQL.
Conclusion
DBOS helps applications continue through failures, retries, and restarts without losing their place. That gives teams a stronger execution model for workflows and agentic systems.
Parseable adds the visibility layer around that execution. Logs show what the application wrote, traces show how the workflow moved across steps, and Conductor metrics show the runtime state around those workflows.
Together, the integration gives teams a practical way to run durable workflows and understand them in production.

