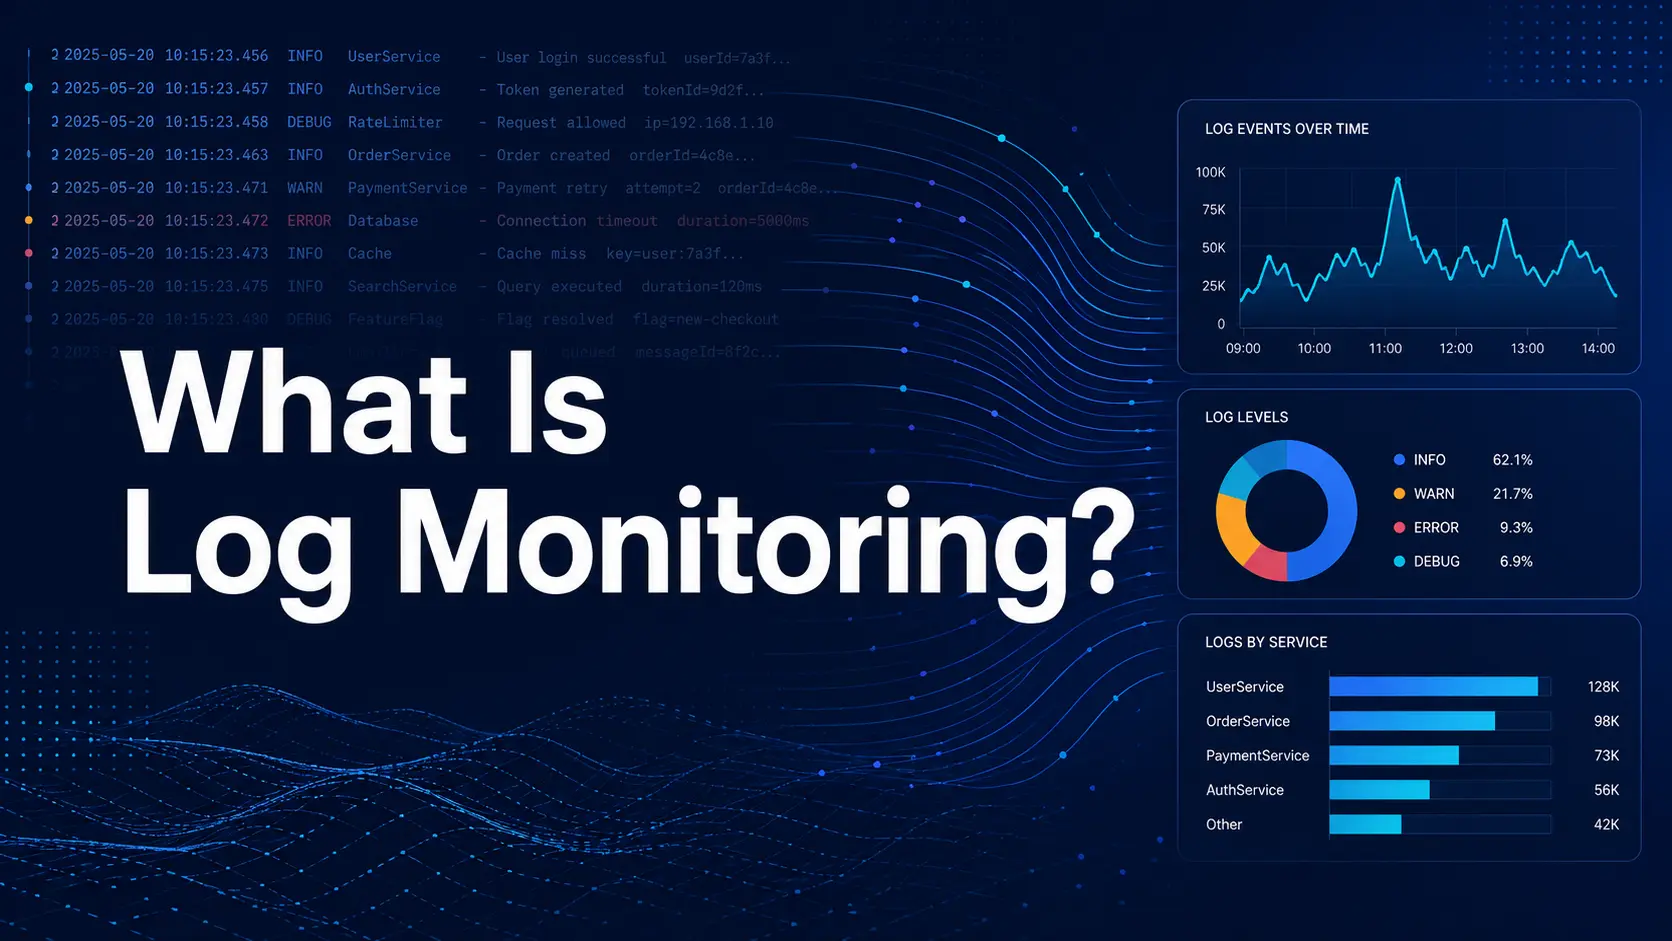
When something breaks in a modern system, the first question engineers ask is: what do the logs say? Log monitoring is the practice that makes that question answerable in real time, not after the fact.
In cloud-native environments built on containers, microservices, and distributed infrastructure, logs are produced by hundreds of services simultaneously. Without a systematic approach to collecting and watching them, engineers are left guessing.
This guide explains what log monitoring is, how it works, why it matters, and how to build a practical setup that keeps your system observable as it grows.
What is log monitoring?
Log monitoring is the continuous process of collecting, parsing, analyzing, and acting on log data in real time.
Every application, server, database, and cloud service generates logs: timestamped records of what happened, when, and why. Log monitoring gives teams a structured way to watch those records, detect when something goes wrong, and investigate the cause.
Teams use it to detect anomalies, investigate incidents, improve reliability, and maintain operational visibility across complex environments. It sits at the foundation of modern observability alongside metrics and traces.
Why is log monitoring important?
In small, simple systems, tailing a log file on a single server is enough. In distributed systems running at scale, it is not. Log monitoring fills that gap:
Faster incident detection and resolution
When a service fails, log monitoring surfaces the signal immediately. Alerts fire when error rates spike, timeouts appear, or critical patterns emerge. On-call engineers can jump straight to the relevant log stream rather than searching manually across machines.
That reduction in mean time to detect (MTTD) and mean time to resolve (MTTR) is one of the most concrete operational benefits of a solid log monitoring setup.
Better system visibility
Logs capture what metrics cannot: the specific context behind a failure. A CPU spike is a number. The logs tell you which request triggered it, what user triggered that request, and what error the service returned.
Continuous log monitoring gives teams a persistent view into system behavior over time, not just point-in-time snapshots.
Stronger security monitoring
Security events leave traces in logs: failed login attempts, unusual access patterns, privilege escalations, and unexpected API calls. Log monitoring enables real-time detection of these patterns and provides the audit trail needed for post-incident forensics.
Without centralized log monitoring, many security incidents go undetected until the damage is done.
Performance optimization
Log monitoring surfaces slow queries, high-latency requests, and repeated timeouts before they affect users at scale. Engineering teams can correlate performance trends with specific code changes or deployment events and act on them proactively.
Compliance and audit readiness
Regulations like SOC 2, PCI DSS, HIPAA, and GDPR require organizations to retain and produce logs for audits. Log monitoring ensures those logs are being collected, structured, and retained consistently, so compliance reviews are not a scramble.
Monitor your logs from 60+ sources in one platform, Parseable. Get Started
How does log monitoring work?
Log monitoring involves several stages, from the moment a log is written to the moment an alert fires or an engineer runs a search. Here is how the pipeline works.
1. Log generation
Every layer of your stack generates logs: applications, operating systems, containers, cloud services, databases, and network devices. These logs record events in real time: requests, errors, state changes, and system-level activity.
The format varies widely. Some logs are structured JSON. Others are plain-text lines. The consistency of what you emit here affects everything downstream.
2. Log collection
Log collection agents run on your hosts, containers, or as sidecars in Kubernetes pods. They read log output from files, stdout/stderr streams, or system journals and forward it to a central destination.
Common collectors include Fluent Bit, Fluentd, Vector, and the OpenTelemetry Collector. OpenTelemetry-based log collection is increasingly common in modern environments as teams standardize on a single telemetry pipeline.
3. Log aggregation and centralization
Once collected, logs are aggregated into a central system. This is the step that makes log monitoring possible at scale. Instead of connecting to 50 hosts individually, engineers query them one place using log aggregation tools.
Centralization also enables cross-service correlation: seeing logs from a frontend service alongside the backend and database within the same time window.
4. Parsing and normalization
Raw logs are messy. Parsing extracts structured fields from unstructured text: timestamps, severity levels, hostnames, request IDs, error codes. Normalization aligns logs from different services into a consistent schema.
This step is what allows you to write a clean query like SELECT * FROM logs WHERE severity = 'ERROR' AND service = 'checkout' instead of grepping through raw text.
5. Storage and indexing
Parsed logs are stored in a backend optimized for log workloads. Good storage design balances query speed, cost, and retention. Modern approaches increasingly use columnar formats like Parquet on object storage, which reduces cost while keeping queries fast. The S3-native approach to log analytics is gaining traction as a cost-effective alternative to expensive managed services.
6. Search, analysis, and visualization
This is where teams actively use the data: running queries, building dashboards, and exploring log streams during incidents or routine reviews.
Good tooling here means fast search, intuitive UI, and flexible query interfaces. SQL-based exploration is increasingly preferred because it does not require learning a proprietary query language.
7. Alerting and incident response
Alerts turn log monitoring from a passive data store into an active detection system. Teams configure alert rules based on patterns, thresholds, or anomaly signals. When a rule fires, it routes a notification to Slack, PagerDuty, or another incident management tool.
The quality of your alert configuration directly determines whether on-call is sustainable or draining.
Types of logs you should monitor
Not every log carries equal value. These are the main categories worth monitoring in most environments.
Application logs
Application logs capture what your code is doing: requests, responses, errors, business events, and debug traces. They are the most direct signal for debugging and reliability work.
System logs
System logs come from the operating system: kernel events, service start and stop events, resource exhaustion, and hardware errors. On Linux, these come from journald, syslog, or /var/log/*. On cloud infrastructure, they surface through platform-level log services.
Security logs
Security logs capture authentication events, authorization checks, access control changes, and network connection attempts. These are critical for both real-time threat detection and post-incident investigation.
Infrastructure and cloud logs
Cloud providers generate logs at the infrastructure layer: VPC flow logs, load balancer access logs, object storage access logs, and managed service events. These logs are essential for understanding how traffic flows through your environment and where failures originate.
Database logs
Database logs capture slow queries, connection pool behavior, replication lag, deadlocks, and schema changes. They are indispensable for diagnosing performance issues and data integrity problems. Teams working on proactive database monitoring rely on these logs heavily.
Audit logs
Audit logs record who did what, when, and from where. These exist at every layer: cloud IAM, Kubernetes RBAC, database access, and application-level user actions. They are the foundation of compliance and forensic investigation.
Common use cases for log monitoring
Application debugging
When an application throws errors or behaves unexpectedly, logs are the first place engineers look. Log monitoring makes this faster by surfacing recent errors automatically, allowing engineers to filter by request ID, user, or service, and trace the sequence of events that led to a failure.
Cloud infrastructure monitoring
Cloud-native infrastructure is dynamic. Services scale up and down, containers restart, and nodes are replaced. Log monitoring provides continuous visibility into this activity, catching configuration drift, network errors, or resource exhaustion before users notice.
Kubernetes troubleshooting
Kubernetes produces logs from multiple layers: pods, nodes, the control plane, and the kubelet. When a pod crashes or a deployment fails, you need to pull logs quickly from the right source. Log monitoring centralizes these streams and makes Kubernetes troubleshooting far less painful than running kubectl logs manually across namespaces.
Security investigation
When a security incident occurs, logs are the record. Log monitoring enables teams to run forensic searches across historical data, identify the scope of access, trace lateral movement, and reconstruct the timeline of an attack. Real-time alerting on security patterns can also catch incidents while they are still happening.
Performance monitoring
Log data tells you which endpoints are slow, which queries are expensive, and which users are hitting errors. Combined with request timing and error rates, logs help engineering teams identify performance regressions after deploys and tune bottlenecks systematically.
Compliance and audit trails
Regulated industries need to demonstrate that access to sensitive systems is logged, retained, and reviewable. Log monitoring ensures continuous collection and provides the search interface auditors need to verify compliance.
What does a log monitoring architecture look like?
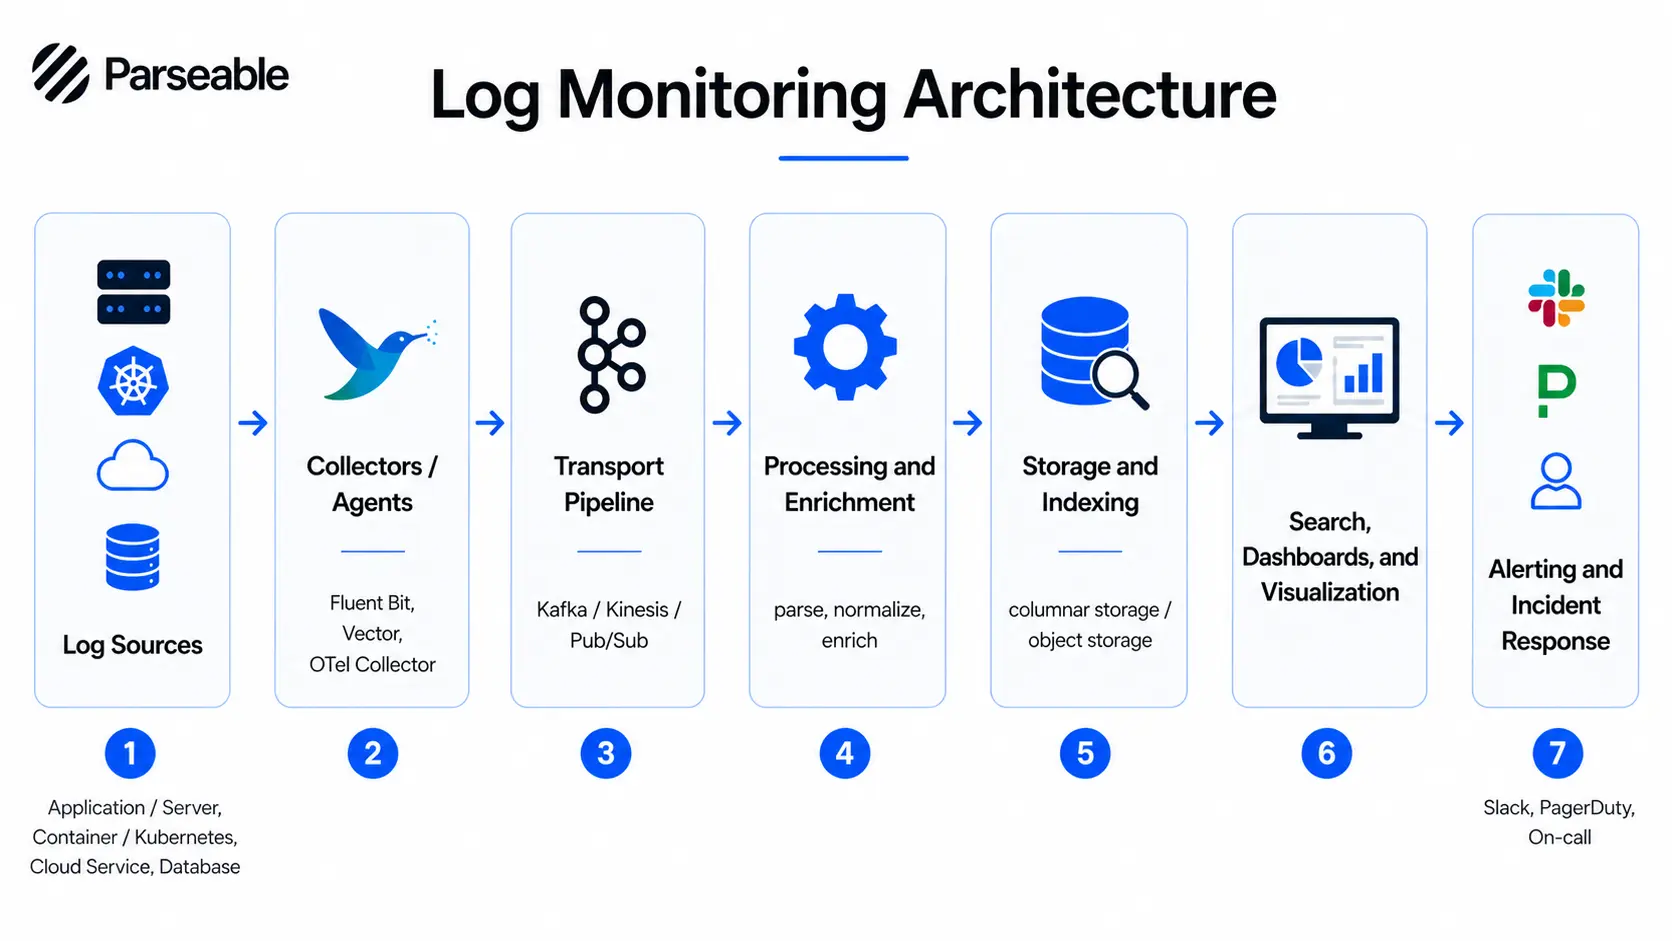
A well-designed log monitoring architecture has several distinct layers, each with a specific function.
Log sources are the starting point: applications, servers, containers, cloud services, databases, and network devices.
Log agents or collectors run close to the source. They read log output and forward it downstream. Lightweight agents like Fluent Bit, Vector, or the OpenTelemetry Collector work well here.
The transport pipeline moves log data from collectors to the central system. This is usually a message queue or streaming layer such as Kafka, Kinesis, or Pub/Sub that buffers data under high volume.
Processing and enrichment happens next. Logs are parsed, structured, normalized, and enriched with metadata like environment, region, and team ownership.
The storage backend retains the processed data. Design here involves trade-offs between query speed, cost, and retention period. Columnar storage on object storage is increasingly the right answer for cost-sensitive environments.
The dashboards and search layer is where engineers work. They run SQL or DSL queries, explore streams, and build dashboards for ongoing visibility.
The alerting and incident response layer monitors the incoming stream against defined rules, fires notifications, and routes them to the right channels.
The core value of this architecture is centralization. Instead of SSHing into individual hosts, engineers have one queryable interface across all log sources.
Log monitoring architecture with Parseable
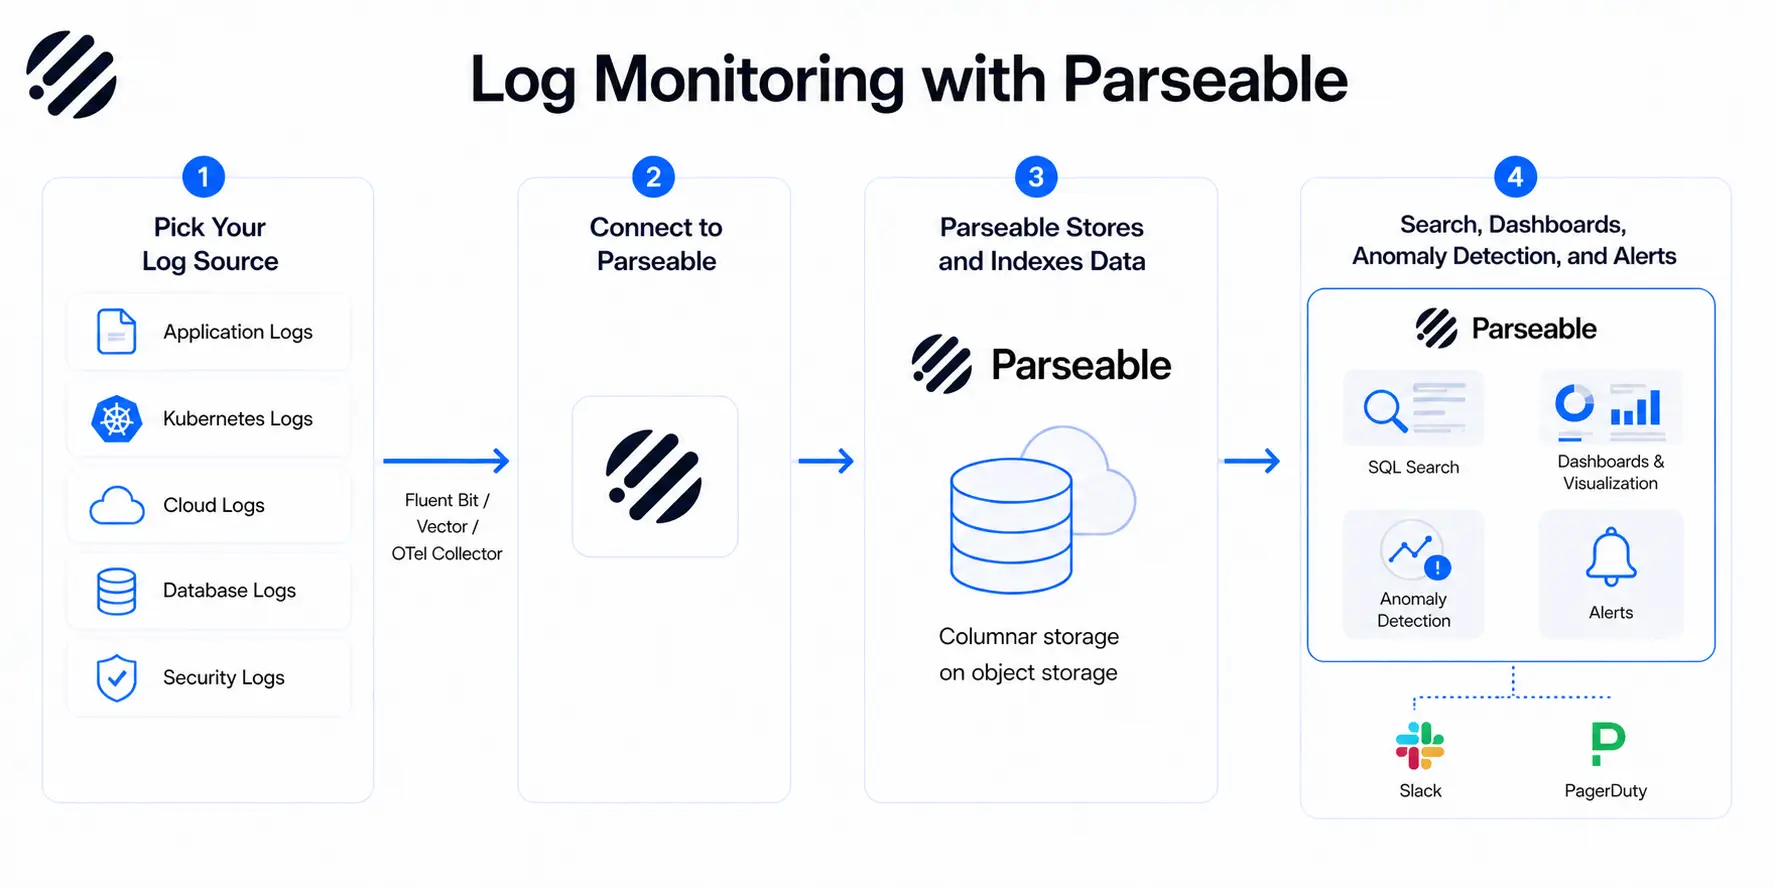
Parseable fits into this architecture as the storage, search, and monitoring layer. Here is how teams set it up in practice.
1. Pick your log source
Start by deciding which log sources matter most for your current monitoring goals. Common starting points include:
- Application logs from your core services
- Infrastructure logs from VMs, containers, or managed cloud services
- Kubernetes pod and node logs
- Cloud service logs from AWS, GCP, or Azure
- Database logs for slow query detection and connection monitoring
- Security or audit logs for access tracking and compliance
You do not need to connect everything at once. Start with the sources that generate the most operational value and expand from there.
2. Connect the source to Parseable
Teams send logs from their chosen source into Parseable through their existing collection pipeline. If you are using Fluent Bit, Fluentd, Vector, or the OpenTelemetry Collector, you configure a Parseable output destination. Parseable supports HTTP-based ingestion and works with standard telemetry workflows, so integration typically does not require rewriting your pipeline from scratch.
OpenTelemetry-based workflows are well supported, which keeps your setup aligned with open telemetry log collection patterns that are becoming the default in cloud-native environments.
3. Parseable stores, visualizes, and helps monitor the data
Once logs reach Parseable, the platform handles the rest:
- Stores log data efficiently using a columnar format on object storage
- Provides a SQL-based query interface for exploration and incident investigation
- Allows you to interact and make conclusions from your data by quering in plain english.
- Delivers dashboards for ongoing visibility
- Detects anomalies in your log streams
- Enables real-time alert configuration so teams can route notifications to Slack, PagerDuty, or other incident management tools
- Supports proactive monitoring workflows so teams are notified before issues escalate
Sign up for Parseable and connect your first log source in minutes.
Common challenges in log monitoring
Log monitoring at scale introduces real operational problems. Understanding them helps teams design for them rather than run into them.
High log volume and noise
Modern distributed systems can generate millions of log lines per minute. Without filtering and sampling strategies, this volume overwhelms storage, search performance, and human attention. Not every log line is worth retaining or alerting on.
Alert fatigue
Badly configured alerts erode on-call culture quickly. When alerts fire on every minor fluctuation, engineers stop treating them as meaningful signals. Alert design requires careful thinking about thresholds, grouping, and routing.
Storage and retention costs
Logs are large. Retaining them indefinitely is expensive. Teams need a retention policy that balances operational needs, compliance requirements, and cost. Observability pricing for log storage varies dramatically between platforms, so understanding total cost of ownership matters before committing to a tool.
Distributed system complexity
In a microservices architecture, a single user request might touch a dozen services. Correlating logs across those services requires consistent request IDs, shared metadata, and tooling that can join across streams. Without these, log monitoring becomes a guessing game.
Poor log structure and inconsistent formats
When some services emit JSON and others emit unstructured text, and when log schemas change between versions, parsing breaks. Teams end up spending engineering time writing and maintaining parsers instead of analyzing data. Structured logging at the source is the only reliable fix.
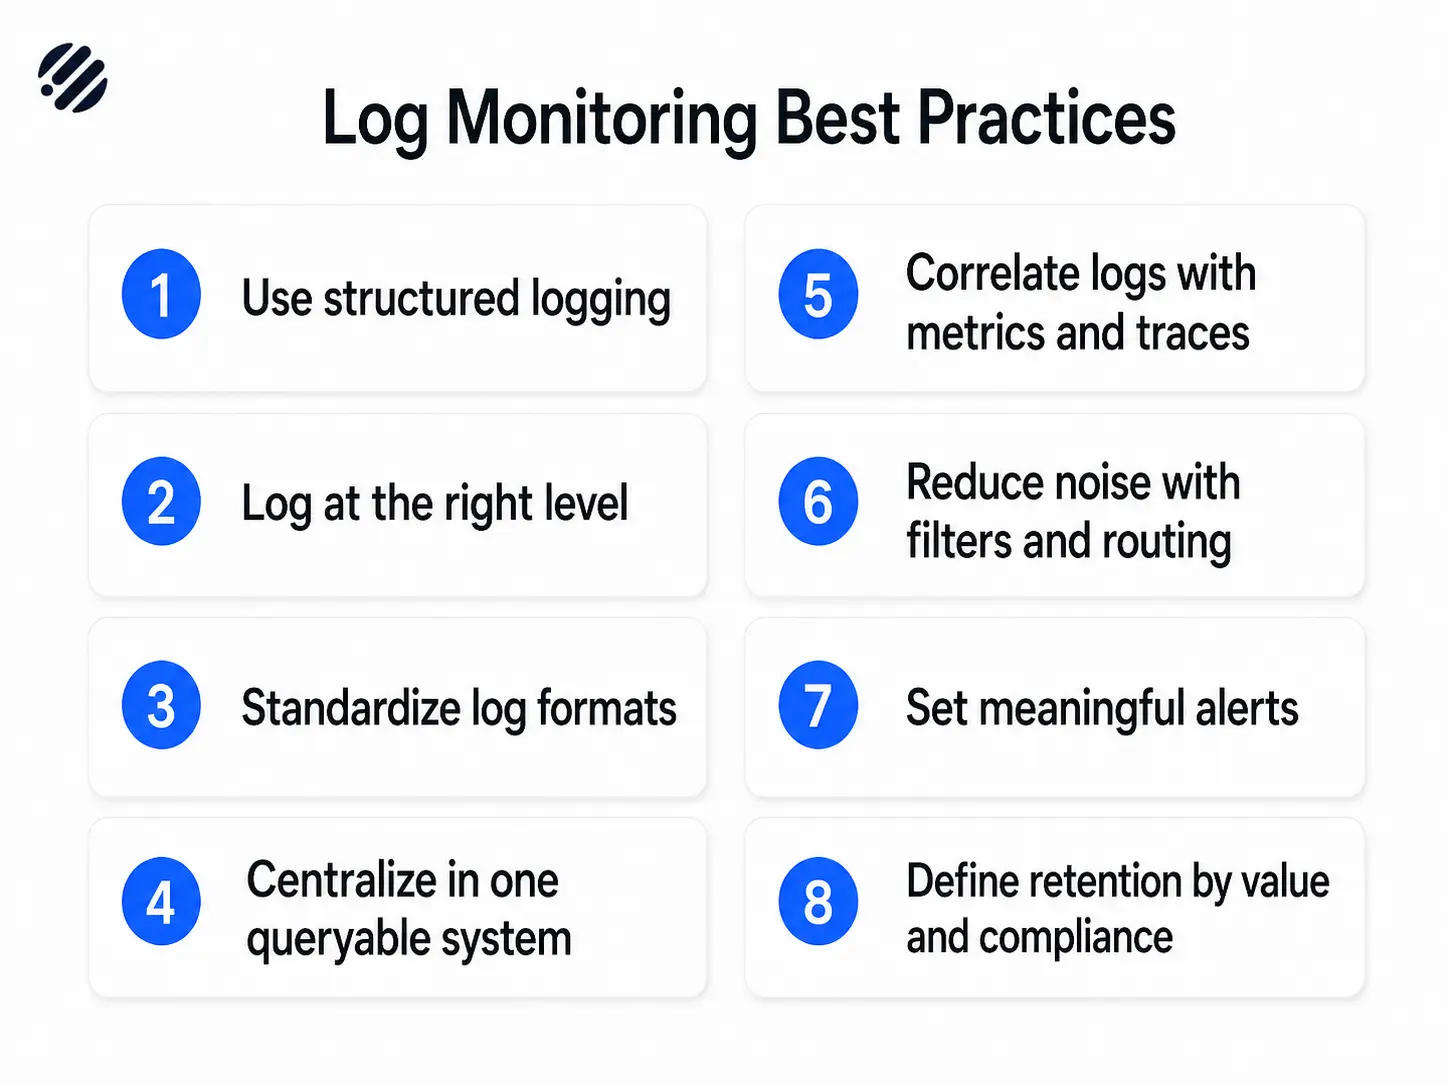
Log monitoring best practices
These log monitoring best practices apply regardless of which tool your team chooses.
Use structured logging
Emit logs as JSON or another structured format. Structured logs are easier to parse, index, and query. They eliminate the need for complex regex parsers and make your logs queryable from day one.
Log at the right level
Too many DEBUG logs in production creates noise and drives up storage costs. Too few ERROR logs means missing real failures. Use log levels deliberately: DEBUG for local development, INFO for significant operational events, WARN for recoverable issues, ERROR for failures that need attention.
Standardize log formats across services
Define a shared log schema: timestamp, severity, service name, trace ID, and request ID at a minimum. Apply it consistently across all services. Cross-service correlation only works if the fields exist and match.
Centralize logs in one queryable system
Scattered logs on individual hosts are not a log monitoring setup. They are a manual debugging workflow. Centralization is the prerequisite for everything else: search, dashboards, alerting, and cross-service correlation. A good starting point for evaluating centralized options is this comparison of log aggregation tools.
Correlate logs with metrics and traces
Logs answer "what happened." Metrics answer "how bad is it." Traces answer "where in the request path did it fail." Used together, they dramatically reduce time to resolution. OpenTelemetry-based observability makes correlating traces with logs more practical than it used to be.
Reduce noise with filters and routing
Not every log needs to go to central storage. Route high-volume, low-value logs to cheaper storage or drop them at the collection layer. Apply sampling to repetitive patterns. This keeps your queryable dataset focused on the signals that matter.
Set meaningful alerts, not noisy alerts
Alert on patterns that indicate real problems: sustained error rate increases, missing heartbeats, specific exception types. Avoid alerting on every individual error event. Group related alerts. Use thresholds that reflect actual failure conditions, not theoretical ones.
Define retention based on value and compliance
Recent logs (last 7 to 30 days) should be hot and fast to query. Older logs can move to cheaper cold storage. Define retention per log type based on how often you actually access them and what your compliance requirements mandate. Keeping everything forever in hot storage is expensive and usually unnecessary.
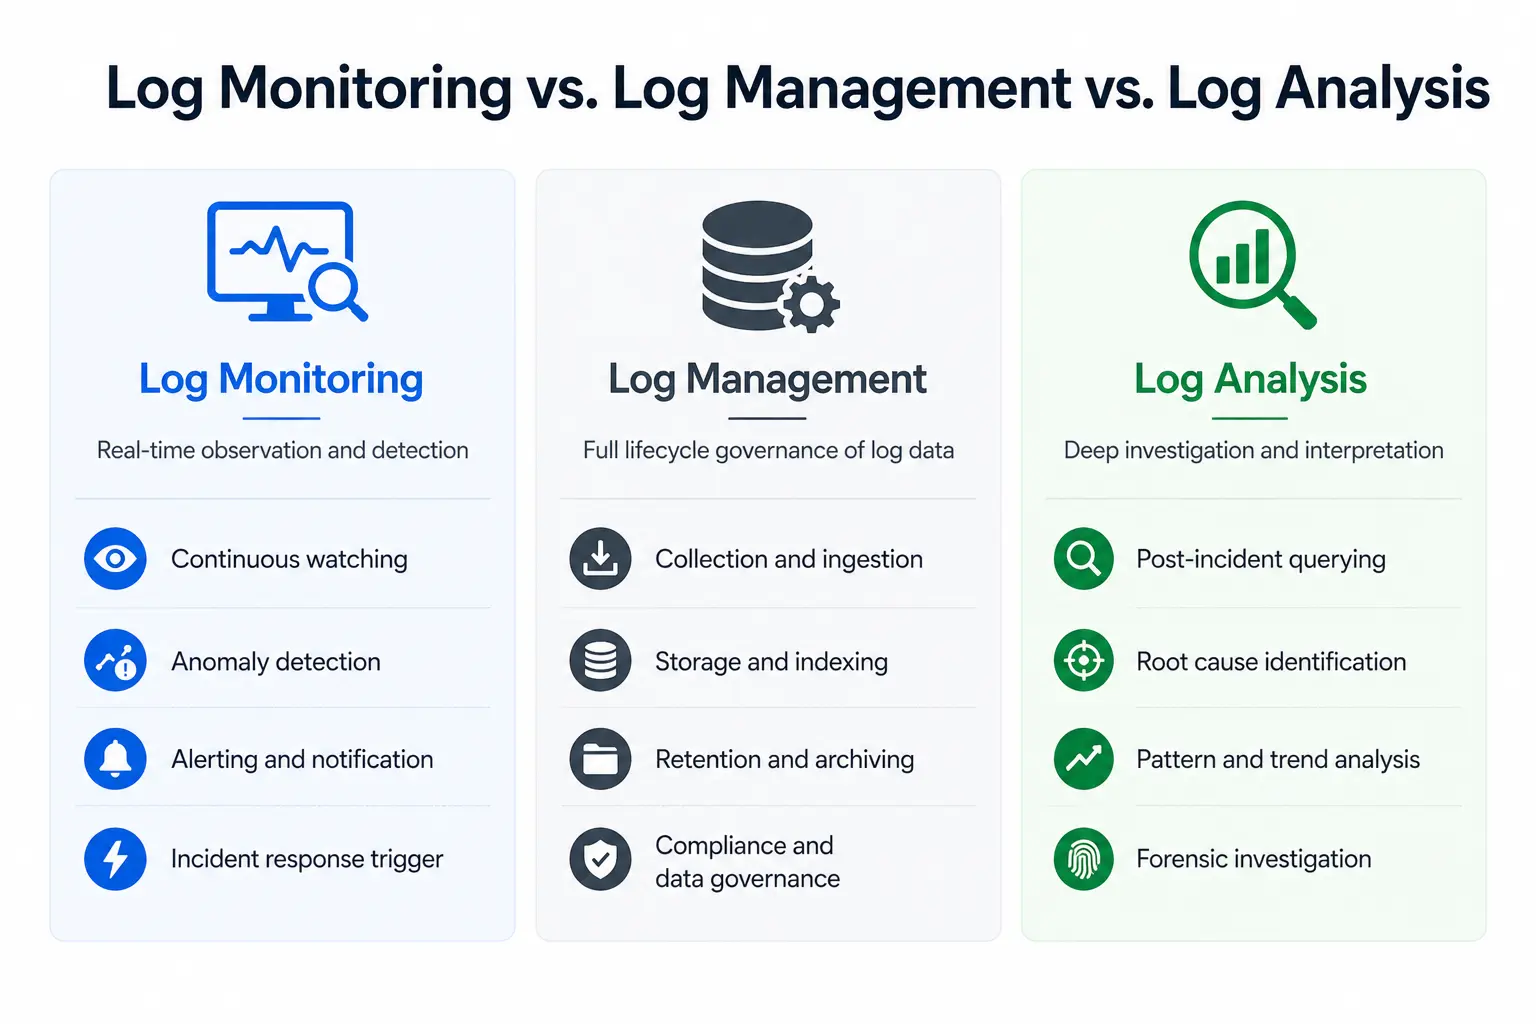
Log monitoring vs. Log management
These terms often get used interchangeably, but they describe different things.
Log management is the broader discipline. It covers collecting, storing, retaining, archiving, and governing logs over their full lifecycle. Log management is concerned with compliance, cost, data governance, and long-term accessibility.
Log monitoring is the real-time, action-oriented subset of log management. It focuses on analysis, alerting, and response. Log monitoring assumes the log management infrastructure is in place and builds operational workflows on top of it.
In practice, most teams need both: log management to ensure logs are collected and retained correctly, and log monitoring to turn that data into actionable signals.
Read also: Best log management tools
Log monitoring vs. Log analysis
These two concepts are related but serve different purposes.
Log monitoring is continuous observation and detection. It runs in the background, watching for patterns that deviate from normal behavior, and alerts teams when they appear. Log monitoring helps teams know something is wrong.
Log analysis is deeper investigation and interpretation. It is what engineers do after an alert fires or a bug is reported: querying, filtering, correlating, and reading log sequences to understand the cause. Log analysis helps explain why something went wrong.
Good tooling supports both: real-time monitoring with alerting, and an exploration interface fast enough for deep analysis during active incidents.
Log monitoring and observability
Logs are one of the three core observability signals, alongside metrics and traces. In isolation, each signal has blind spots. Together, they give engineering teams a complete picture of system behavior.
Metrics tell you when something changed in aggregate: error rate, latency, throughput. Traces show you the path a specific request took through your services. Logs give you the detailed, event-level context that neither metrics nor traces capture on their own.
Modern observability practice treats these three signals as correlated rather than separate. A trace ID linking a distributed trace to its corresponding log entries, combined with the metric that triggered the alert, is far more useful than any one signal alone.
Parseable supports OpenTelemetry-based log ingestion, which keeps your logs aligned with the same telemetry pipeline that carries your traces. You can read more about how OpenTelemetry trace data integrates with log workflows in this overview of OpenTelemetry and Parquet.
Sign up for Parseable for free and correlate your logs, metrics and traces. Get Started
How to set up log monitoring
Here is a practical setup flow for teams starting from scratch or replacing an existing system.
1. Identify your log sources
List everything that generates logs in your environment:
- Application logs from your services
- Infrastructure logs from VMs, bare metal, or cloud instances
- Kubernetes logs from pods, nodes, and the control plane
- Cloud service logs from managed services such as RDS, S3, or load balancers
- Database logs for query performance and connection events
- Security logs from WAFs, identity providers, and access control systems
Prioritize the sources with the most operational value. Not everything needs to be in scope on day one.
2. Define your monitoring goals
Before routing a single log line, define what success looks like:
- Incident detection: Do you need alerts on error spikes, service failures, or missing heartbeats?
- Troubleshooting: Do engineers need fast search during active incidents?
- Performance monitoring: Are you tracking slow queries or high-latency endpoints?
- Compliance: Do you need to retain specific log types for one year or more?
- Security visibility: Do you need real-time alerts on authentication failures or access anomalies?
Your goals determine which log sources matter, what your retention policy should be, and what your alert configuration should cover.
3. Connect your log source to Parseable Pro
Once you know what you are monitoring and why, route logs from your collection layer into Parseable Pro. Use your existing collector (Fluent Bit, Vector, or the OpenTelemetry Collector) and configure a Parseable destination.
Once data is in the platform, Parseable Pro provides:
- Dashboards for ongoing visibility without manual queries
- SQL-based log exploration for deep incident investigation
- Proactive monitoring to detect trends before they become incidents
- Real-time alerts with anomaly detection to route the right signal to the right team
4. Plan storage and retention if you are using an open-source model
This step is optional. It mainly applies to teams deploying a self-managed, open-source log monitoring setup. In that model, you are responsible for designing your storage layer: where logs land, how they are indexed, and when they roll off to cheaper storage or expire.
If you are using Parseable Pro, this step is handled for you. Parseable Pro includes 365 days of retention out of the box, so you do not need to design a retention architecture from scratch.
5. Configure alerts and routing
Set up alert rules based on meaningful signals: sustained error rates, specific exception types, missing heartbeats, or anomaly patterns in your log stream.
Route alerts to where your team actually works: Slack channels, PagerDuty rotations, or your incident management system. Keep alert volume low enough that on-call engineers treat each one seriously.
6. Test and validate your setup
Before you rely on your log monitoring setup during a real incident, verify it end to end:
- Confirm logs are arriving correctly and consistently from all sources
- Check that fields are parsed correctly across different log formats
- Review dashboards to ensure they reflect real system state
- Trigger test scenarios to confirm alerts fire as expected
- Run a simulated incident to validate that the workflow is usable under pressure
A setup that works in theory but breaks during a real incident is worse than no setup at all.
Sign up for Parseable and start routing logs into a platform built for this kind of work.
What should you look for in a log monitoring tool?
The right tool depends on your scale, team size, and infrastructure. But these capabilities matter regardless of context.
Ingestion from multiple sources. Your logs come from applications, infrastructure, Kubernetes, and cloud services. The tool needs to accept all of them without requiring a different pipeline for each source.
Fast search and query performance. During an incident, slow search is a liability. Look for a tool that returns results in seconds, not minutes, even across large data volumes.
Dashboards and visualization. Engineers need pre-built views for routine monitoring and the ability to build custom dashboards for their specific systems.
Alerting and anomaly detection. Rule-based alerting covers known failure patterns. Anomaly detection catches unexpected deviations you did not think to write a rule for.
Correlation with metrics and traces. A tool that treats logs in isolation limits your observability. Look for support for trace ID correlation and metrics-to-logs linking.
Scalability and retention. As log volume grows, the tool should scale without requiring a re-architecture. Retention flexibility matters too: some teams need 7 days, others need 365.
Deployment flexibility. Some teams need SaaS. Others need self-hosted for data residency or compliance reasons. The best tools support both. If you are evaluating options, read our guide on best logging tools which covers the current landscape.
Open standards and low lock-in. Tools that use proprietary ingestion formats or query languages create long-term switching costs. Prefer tools that support OpenTelemetry, SQL, and open data formats like Parquet.
Conclusion
Log monitoring turns raw, scattered log data into operational insight. In modern distributed systems, it is not optional: it is the foundation of reliable incident response, security visibility, and operational continuity.
The teams that get the most value from log monitoring are not the ones with the most log data. They are the ones with a clear pipeline, structured logs, meaningful alerts, and a central place to search and analyze what is happening across their systems.
If you are building or improving your log monitoring setup, the principles in this guide apply regardless of your stack. Start with your most valuable log sources, define your goals clearly, and invest in tooling that can grow with your system.
Sign up for Parseable and get visibility into your logs without the complexity of managing your own observability infrastructure.