
OpenAI Codex
Send Codex logs, traces and metrics directly to Parseable through OpenTelemetry
Codex exports OpenTelemetry logs, traces and metrics from local coding sessions. Configure its native [otel] exporter to send each signal to a separate Parseable dataset without an OpenTelemetry Collector.
Codex
  |-- logs ----> Parseable: codex-logs
  |-- traces ---> Parseable: codex-traces
  +-- metrics --> Parseable: codex-metrics
Prerequisites
- Codex CLI installed and authenticated
- A Parseable instance reachable from the developer machine
- A Parseable API key with ingest access
Configure telemetry
Open ~/.codex/config.toml and add:
[otel]
environment = "production"
log_user_prompt = false

exporter = { otlp-http = { endpoint = "https://<your-parseable-host>:8000/v1/logs", protocol = "json", headers = { Authorization = "Bearer <parseable-api-key>", X-P-Stream = "codex-logs", Content-Type = "application/json" } } }

trace_exporter = { otlp-http = { endpoint = "https://<your-parseable-host>:8000/v1/traces", protocol = "json", headers = { Authorization = "Bearer <parseable-api-key>", X-P-Stream = "codex-traces", Content-Type = "application/json" } } }

metrics_exporter = { otlp-http = { endpoint = "https://<your-parseable-host>:8000/v1/metrics", protocol = "json", headers = { Authorization = "Bearer <parseable-api-key>", X-P-Stream = "codex-metrics", Content-Type = "application/json" } } }
Set environment to a value such as development, staging, or production. Parseable stores it with the telemetry so you can separate environments in queries and dashboards.
For a self-hosted deployment that uses basic authentication, replace Authorization = "Bearer <parseable-api-key>" in each exporter with:
Authorization = "Basic <base64-encoded-username-and-password>"Restart Codex after changing config.toml. Existing processes do not reload telemetry settings.
Verify ingestion
Start a new Codex session, submit a prompt and let Codex run one tool. Then check:
codex-logscontains events from the session.codex-tracescontains spans for the agent run and its operations.codex-metricscontains Codex measurements.
If no data arrives, run Codex with strict configuration validation:
codex --strict-configCodex reports fields that the installed version does not support or recognize.
Import the dashboard
Download the Codex Observability dashboard and import its JSON file in Parseable. Map:
- Logs Dataset to
codex-logs - Traces Dataset to
codex-traces - Metrics Dataset to
codex-metrics
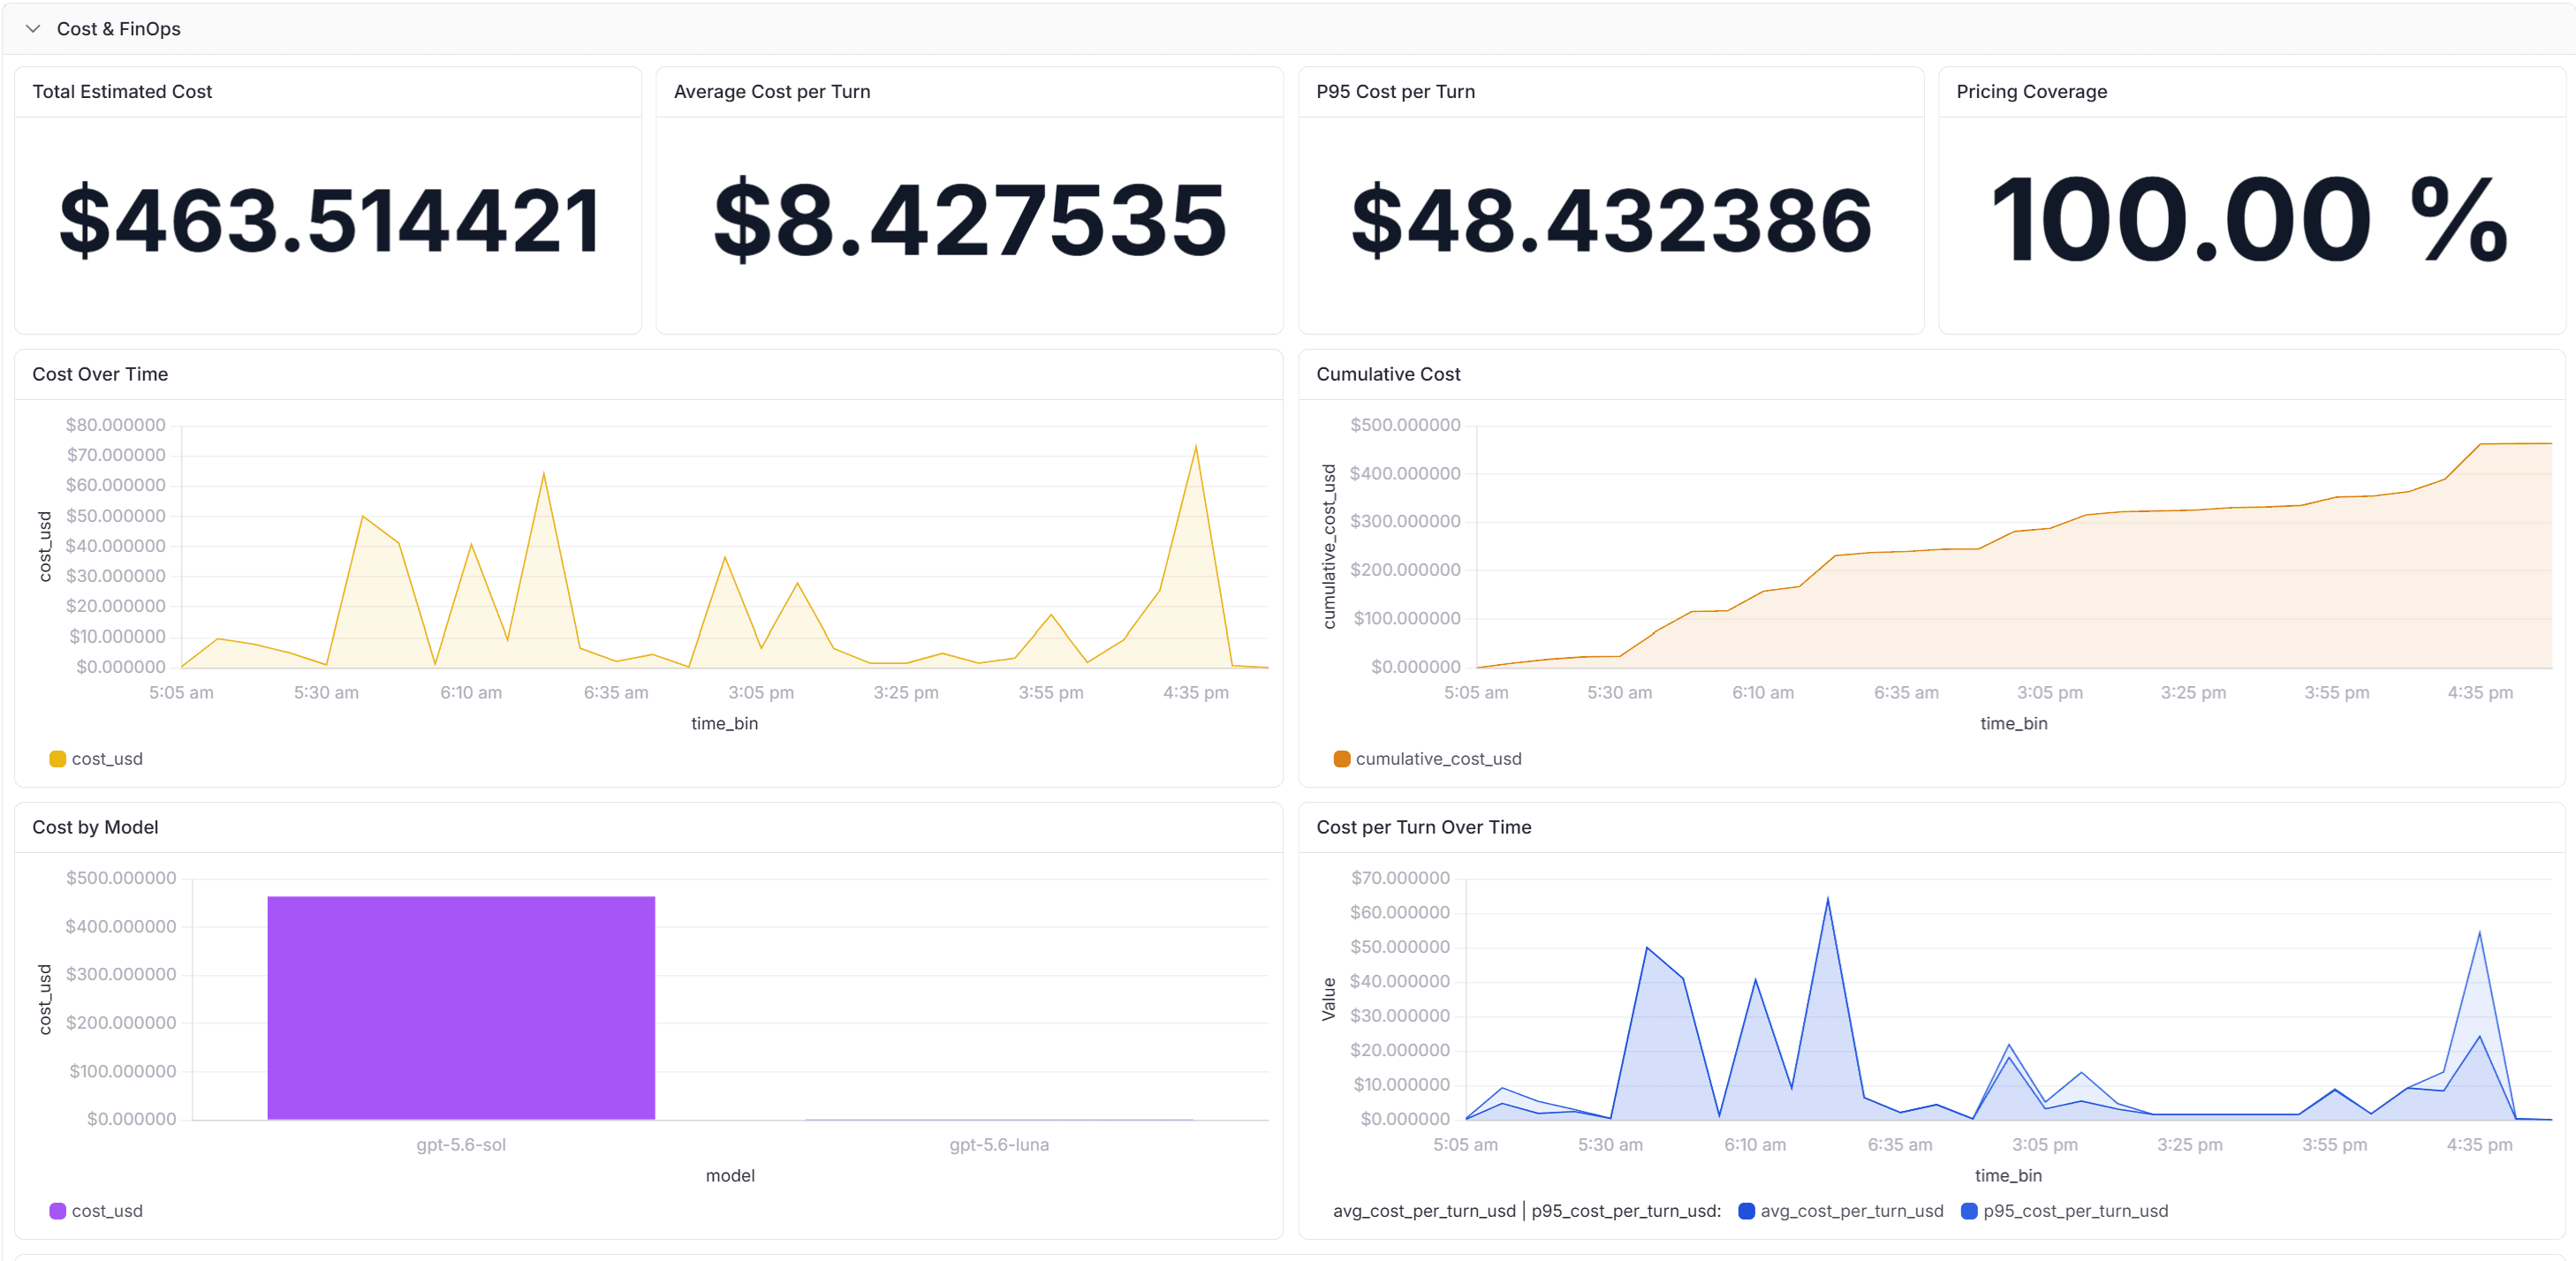
Use the dashboard to inspect sessions, turns, models, tokens, cache use, cost, latency, tools, MCP activity, approvals, errors, logs and traces.
Protect prompt content
Keep prompt logging disabled unless your data policy permits it:
[otel]
log_user_prompt = false
Setting log_user_prompt = true can send source code, file paths, secrets, personal data and other prompt content to the logs dataset. Restrict dataset access and retention before enabling it.
Troubleshooting
- No datasets appear: confirm Codex can reach the Parseable ingestor and verify each endpoint, API key, and
X-P-Streamvalue. - Only one signal arrives: check that
exporter,trace_exporterandmetrics_exportereach use the matching/v1/logs,/v1/traces, or/v1/metricsendpoint. - Parseable rejects exports: confirm
protocol = "json", includeContent-Type = "application/json"and use the ingestor URL and port. - Configuration fails: run
codex --strict-configand compare the reported field with the configuration supported by your installed Codex version.
Was this page helpful?