
GitHub Copilot
Send GitHub Copilot agent traces directly to Parseable through OpenTelemetry
GitHub Copilot CLI exports OpenTelemetry traces for agent sessions. Each trace connects an invoke_agent root span to model calls and tool executions. Disable metric export and send the traces to Parseable.
GitHub Copilot CLI
  | OTLP/HTTP
  v
Parseable: copilot-traces
GitHub documents the emitted spans, attributes and supported environment variables in the Copilot CLI command reference.
Prerequisites
- GitHub Copilot CLI installed and authenticated
- A Parseable instance reachable from the developer machine
- A Parseable API key with ingest access
Enable Copilot traces
Set the Parseable OTLP endpoint and headers before starting Copilot CLI:
export PARSEABLE_URL="https://<your-parseable-host>:8000"
export PARSEABLE_API_KEY="<parseable-api-key>"

export COPILOT_OTEL_ENABLED=true
export OTEL_METRICS_EXPORTER=none
export OTEL_EXPORTER_OTLP_ENDPOINT="${PARSEABLE_URL}"
export OTEL_EXPORTER_OTLP_PROTOCOL=http/json
export OTEL_EXPORTER_OTLP_HEADERS="Authorization=Bearer ${PARSEABLE_API_KEY},X-P-Stream=copilot-traces"
export OTEL_SERVICE_NAME=github-copilot

copilot
Copilot appends /v1/traces to OTEL_EXPORTER_OTLP_ENDPOINT, so use the Parseable base URL. OTEL_METRICS_EXPORTER=none prevents metrics from using the trace dataset headers.
For a self-hosted deployment that uses basic authentication, replace Authorization=Bearer ${PARSEABLE_API_KEY} with Authorization=Basic <base64-encoded-username-and-password> in OTEL_EXPORTER_OTLP_HEADERS.
Copilot CLI supports http/json and http/protobuf. Parseable accepts the http/json configuration above.
Verify ingestion
Start Copilot CLI and submit a request that causes one model call and one tool call. In Parseable:
- Open
copilot-tracesin the Traces view. - Find an
invoke_agent GitHub Copilot Chatroot span. - Open the trace and confirm it contains
chatandexecute_toolchild spans.
Useful trace fields include:
span_trace_id,span_span_idandspan_parent_span_idspan_name,span_duration_nsandspan_status_codegen_ai.request.modelandgen_ai.response.modelgen_ai.usage.input_tokensandgen_ai.usage.output_tokensgen_ai.tool.namegithub.copilot.git.repositoryandgithub.copilot.git.branch
Import the dashboard
Download the GitHub Copilot Observability dashboard and import its JSON file in Parseable. Map Traces Dataset to copilot-traces.
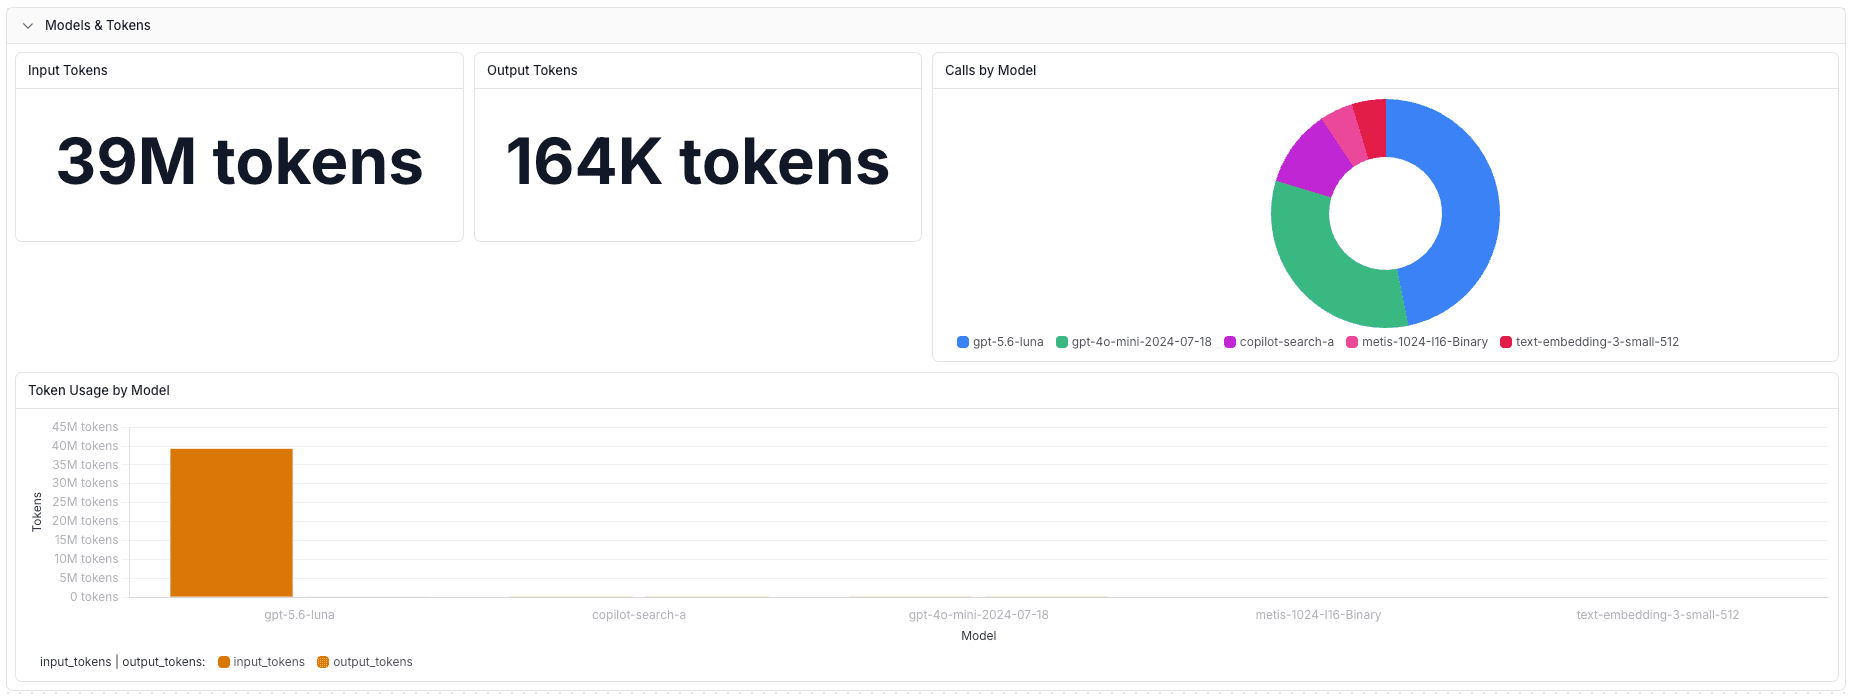
Use the dashboard to track trace volume, sessions, model and token usage, tools, latency, errors, repositories and recent traces.
Configure the Copilot SDK
If you use the Copilot SDK, pass the Parseable base URL to TelemetryConfig. For TypeScript:
import { CopilotClient } from "@github/copilot-sdk";

const client = new CopilotClient({
  telemetry: {
    otlpEndpoint: "https://<your-parseable-host>:8000",
    otlpProtocol: "http/json",
    captureContent: false,
  },
});
Set OTEL_METRICS_EXPORTER=none and OTEL_EXPORTER_OTLP_HEADERS in the SDK process environment. GitHub provides equivalent options for Python, Go, .NET, Java and Rust in OpenTelemetry instrumentation for Copilot SDK.
Protect sensitive content
Copilot excludes prompts, responses and tool arguments by default. Keep content capture disabled for shared or production environments.
Enable full message capture with:
export OTEL_INSTRUMENTATION_GENAI_CAPTURE_MESSAGE_CONTENT=trueContent capture can include source code, file contents, user prompts, model responses and tool arguments. Apply Parseable access controls before enabling it. GitHub's OpenTelemetry agent monitoring guide describes the privacy behavior.
Troubleshooting
- No spans arrive: confirm Copilot CLI can reach Parseable, verify the API key and set
OTEL_LOG_LEVEL=DEBUGto inspect exporter diagnostics. - The trace has no child spans: generate a new session after setting the environment variables. Existing Copilot processes do not inherit later shell changes.
- Metrics appear in the trace dataset: set
OTEL_METRICS_EXPORTER=nonein the Copilot process environment. - Parseable rejects exports: use the Parseable ingestor base URL and verify
X-P-Stream=copilot-traces. - The dashboard is empty: map Traces Dataset to
copilot-tracesand choose a time range that includes the test session.
Was this page helpful?