
Windows Server
Send Windows Event Logs, windows_exporter metrics, and application traces to Parseable
Windows Server gives you Event Logs, host metrics, and application traces, but those signals are useful only when they are easy to inspect together. This guide sends them to Parseable using a Windows Server VM on Google Compute Engine, windows_exporter, an OpenTelemetry Collector running as LocalSystem, and a scheduled PowerShell workload.
What the integration collects
| Signal | Source | Parseable dataset |
|---|---|---|
| Logs | Windows Application, System, and Security Event Logs | windows-logs |
| Metrics | Prometheus metrics from windows_exporter | windows-metrics |
| Traces | Instrumented IIS/.NET applications or a synthetic workload | windows-traces |
Windows Server produces Event Logs and performance metrics, but not distributed application traces. Instrument IIS/.NET applications or use the test workload below to validate the trace pipeline.
Prerequisites
- Windows Server 2016 or later
- Administrator access
- Outbound access to the Parseable ingestor
- OpenTelemetry Collector Contrib for Windows
windows_exporter
Run the Collector on the Windows server. The Windows Event Log receiver uses Windows APIs and is not supported on Linux.
Optional: create a GCP Windows VM
The following example creates Windows Server 2025 on an existing VPC and subnet:
gcloud compute instances create "$VM_NAME" \
  --project="$PROJECT_ID" \
  --zone="$ZONE" \
  --machine-type=e2-standard-4 \
  --network="$NETWORK" \
  --subnet="$SUBNET" \
  --image-project=windows-cloud \
  --image-family=windows-2025 \
  --boot-disk-size=100GB \
  --boot-disk-type=pd-balanced \
  --tags=windows-iap-rdp,windows-telemetry \
  --shielded-secure-boot \
  --shielded-vtpm \
  --shielded-integrity-monitoring \
  --no-service-account \
  --no-scopes
Create credentials with gcloud compute reset-windows-password. Prefer IAP TCP forwarding or restrict direct RDP on port 3389 to your public IP. Do not expose exporter or OTLP ports publicly.
Install windows_exporter
Run PowerShell as Administrator:
New-Item C:\Telemetry -ItemType Directory -Force

$url = "https://github.com/prometheus-community/windows_exporter/" +
  "releases/download/v0.31.7/windows_exporter-0.31.7-amd64.msi"
$msi = "C:\Telemetry\windows_exporter.msi"

Invoke-WebRequest $url -OutFile $msi

$args = @(
  "/i", $msi, "/qn", "/norestart",
  "ENABLED_COLLECTORS=cpu,cpu_info,logical_disk,memory,net,os," +
    "physical_disk,process,scheduled_task,service,system,tcp",
  "LISTEN_ADDR=127.0.0.1"
)

$process = Start-Process msiexec.exe -ArgumentList $args -Wait -PassThru
$process.ExitCode
An exit code of 0 means success; 3010 means success with a required reboot.
Get-Service windows_exporter
curl.exe -s http://127.0.0.1:9182/health
Install the OpenTelemetry Collector
Download a current Windows otelcol-contrib release from the OpenTelemetry Collector releases. This example uses a validated release:
$dir = "C:\otelcol-contrib"
New-Item $dir -ItemType Directory -Force

$url = "https://github.com/open-telemetry/" +
  "opentelemetry-collector-releases/releases/download/v0.153.0/" +
  "otelcol-contrib_0.153.0_windows_amd64.tar.gz"

Invoke-WebRequest $url -OutFile "$dir\otelcol.tar.gz"
tar -xzf "$dir\otelcol.tar.gz" -C $dir

New-Item "C:\ProgramData\otelcol-contrib\storage" \
  -ItemType Directory -Force
Collector configuration
Create C:\otelcol-contrib\config.yaml:
extensions:
  health_check:
    endpoint: 127.0.0.1:13133
  file_storage:
    directory: C:\ProgramData\otelcol-contrib\storage
    create_directory: true

receivers:
  prometheus/windows:
    config:
      scrape_configs:
        - job_name: windows
          scrape_interval: 15s
          scrape_timeout: 10s
          static_configs:
            - targets: ["127.0.0.1:9182"]

  windows_event_log/application:
    channel: Application
    start_at: end
    raw: true
    event_driven_scraping: true
    storage: file_storage

  windows_event_log/system:
    channel: System
    start_at: end
    raw: true
    event_driven_scraping: true
    storage: file_storage

  windows_event_log/security:
    channel: Security
    start_at: end
    raw: true
    event_driven_scraping: true
    storage: file_storage

  otlp:
    protocols:
      grpc:
        endpoint: 127.0.0.1:4317
      http:
        endpoint: 127.0.0.1:4318

processors:
  memory_limiter:
    check_interval: 1s
    limit_mib: 512
    spike_limit_mib: 128
  resourcedetection/gcp:
    detectors: [env, system, gcp]
    timeout: 5s
    override: false
  resource/windows:
    attributes:
      - key: service.name
        value: windows-server
        action: upsert
      - key: service.instance.id
        value: ${env:COMPUTERNAME}
        action: upsert
      - key: deployment.environment.name
        value: production
        action: upsert
  batch:
    timeout: 1s

exporters:
  otlphttp/parseable_logs:
    endpoint: ${env:PARSEABLE_ENDPOINT}
    encoding: json
    headers:
      Authorization: "Bearer ${env:PARSEABLE_API_KEY}"
      X-P-Stream: windows-logs
      Content-Type: application/json
    retry_on_failure:
      enabled: true
      max_elapsed_time: 0s

  otlphttp/parseable_metrics:
    endpoint: ${env:PARSEABLE_ENDPOINT}
    encoding: json
    headers:
      Authorization: "Bearer ${env:PARSEABLE_API_KEY}"
      X-P-Stream: windows-metrics
      Content-Type: application/json
    retry_on_failure:
      enabled: true
      max_elapsed_time: 0s

  otlphttp/parseable_traces:
    endpoint: ${env:PARSEABLE_ENDPOINT}
    encoding: json
    headers:
      Authorization: "Bearer ${env:PARSEABLE_API_KEY}"
      X-P-Stream: windows-traces
      Content-Type: application/json
    retry_on_failure:
      enabled: true
      max_elapsed_time: 0s

service:
  extensions: [health_check, file_storage]
  pipelines:
    logs:
      receivers:
        - windows_event_log/application
        - windows_event_log/system
        - windows_event_log/security
      processors:
        - memory_limiter
        - resourcedetection/gcp
        - resource/windows
        - batch
      exporters: [otlphttp/parseable_logs]
    metrics:
      receivers: [prometheus/windows]
      processors:
        - memory_limiter
        - resourcedetection/gcp
        - resource/windows
        - batch
      exporters: [otlphttp/parseable_metrics]
    traces:
      receivers: [otlp]
      processors: [memory_limiter, resourcedetection/gcp, batch]
      exporters: [otlphttp/parseable_traces]
PARSEABLE_ENDPOINT must be the ingestor endpoint, not the query or UI endpoint. Use HTTPS in production so the API key is protected in transit.
Validate and register the Collector as LocalSystem so it can access the Security Event Log:
cd C:\otelcol-contrib
.\otelcol-contrib.exe validate --config=.\config.yaml

$binary = '"C:\otelcol-contrib\otelcol-contrib.exe" ' +
  '--config="C:\otelcol-contrib\config.yaml"'

New-Service -Name "otelcol-contrib" `
  -DisplayName "OpenTelemetry Collector Contrib" `
  -BinaryPathName $binary `
  -StartupType Automatic

Start-Service otelcol-contrib
Generate test logs and traces
For real traces, use OpenTelemetry auto-instrumentation for IIS or .NET. To validate a new installation, create C:\otelcol-contrib\run.ps1 that writes an Event Log entry and posts one OTLP span:
if (-not [Diagnostics.EventLog]::SourceExists("WindowsTelemetryDemo")) {
  New-EventLog -LogName Application -Source WindowsTelemetryDemo
}

Write-EventLog -LogName Application `
  -Source WindowsTelemetryDemo `
  -EventId 1001 `
  -EntryType Information `
  -Message "Windows telemetry workload completed"

$now = ([long][DateTimeOffset]::UtcNow.ToUnixTimeMilliseconds() * 1000000L)
$trace = ([guid]::NewGuid().ToString("N") + [guid]::NewGuid().ToString("N")).Substring(0,32)
$span = [guid]::NewGuid().ToString("N").Substring(0,16)

$payload = @{
  resourceSpans = @(@{
    resource = @{ attributes = @(
      @{ key="service.name"; value=@{ stringValue="windows-workload" } }
    ) }
    scopeSpans = @(@{
      scope = @{ name="windows-telemetry-workload" }
      spans = @(@{
        traceId=$trace
        spanId=$span
        name="windows.synthetic.workload"
        kind=1
        startTimeUnixNano=$now.ToString()
        endTimeUnixNano=($now + 1000000L).ToString()
        status=@{ code=1 }
      })
    })
  })
} | ConvertTo-Json -Depth 20 -Compress

Invoke-RestMethod -Method Post `
  -Uri http://127.0.0.1:4318/v1/traces `
  -ContentType application/json `
  -Body $payload | Out-Null
Run it every minute as SYSTEM:
$action = New-ScheduledTaskAction `
  -Execute "powershell.exe" `
  -Argument '-ExecutionPolicy Bypass -File .\run.ps1' `
  -WorkingDirectory "C:\otelcol-contrib"

$trigger = New-ScheduledTaskTrigger `
  -Once -At (Get-Date).AddMinutes(1) `
  -RepetitionInterval (New-TimeSpan -Minutes 1) `
  -RepetitionDuration (New-TimeSpan -Days 3650)

$principal = New-ScheduledTaskPrincipal `
  -UserId SYSTEM -LogonType ServiceAccount -RunLevel Highest

Register-ScheduledTask -TaskName WindowsTelemetryWorkload `
  -Action $action -Trigger $trigger -Principal $principal -Force
Verify ingestion
SELECT count(*) FROM "windows-logs"
WHERE p_timestamp > NOW() - INTERVAL '10 minutes';
SELECT metric_name, count(*)
FROM "windows-metrics"
WHERE p_timestamp > NOW() - INTERVAL '10 minutes'
GROUP BY metric_name
ORDER BY metric_name;SELECT span_name, count(*)
FROM "windows-traces"
WHERE p_timestamp > NOW() - INTERVAL '10 minutes'
GROUP BY span_name;Expected metrics include windows_cpu_time_total, windows_logical_disk_free_bytes, windows_memory_physical_free_bytes, windows_net_bytes_received_total, windows_os_info, and windows_service_state.
View in Parseable
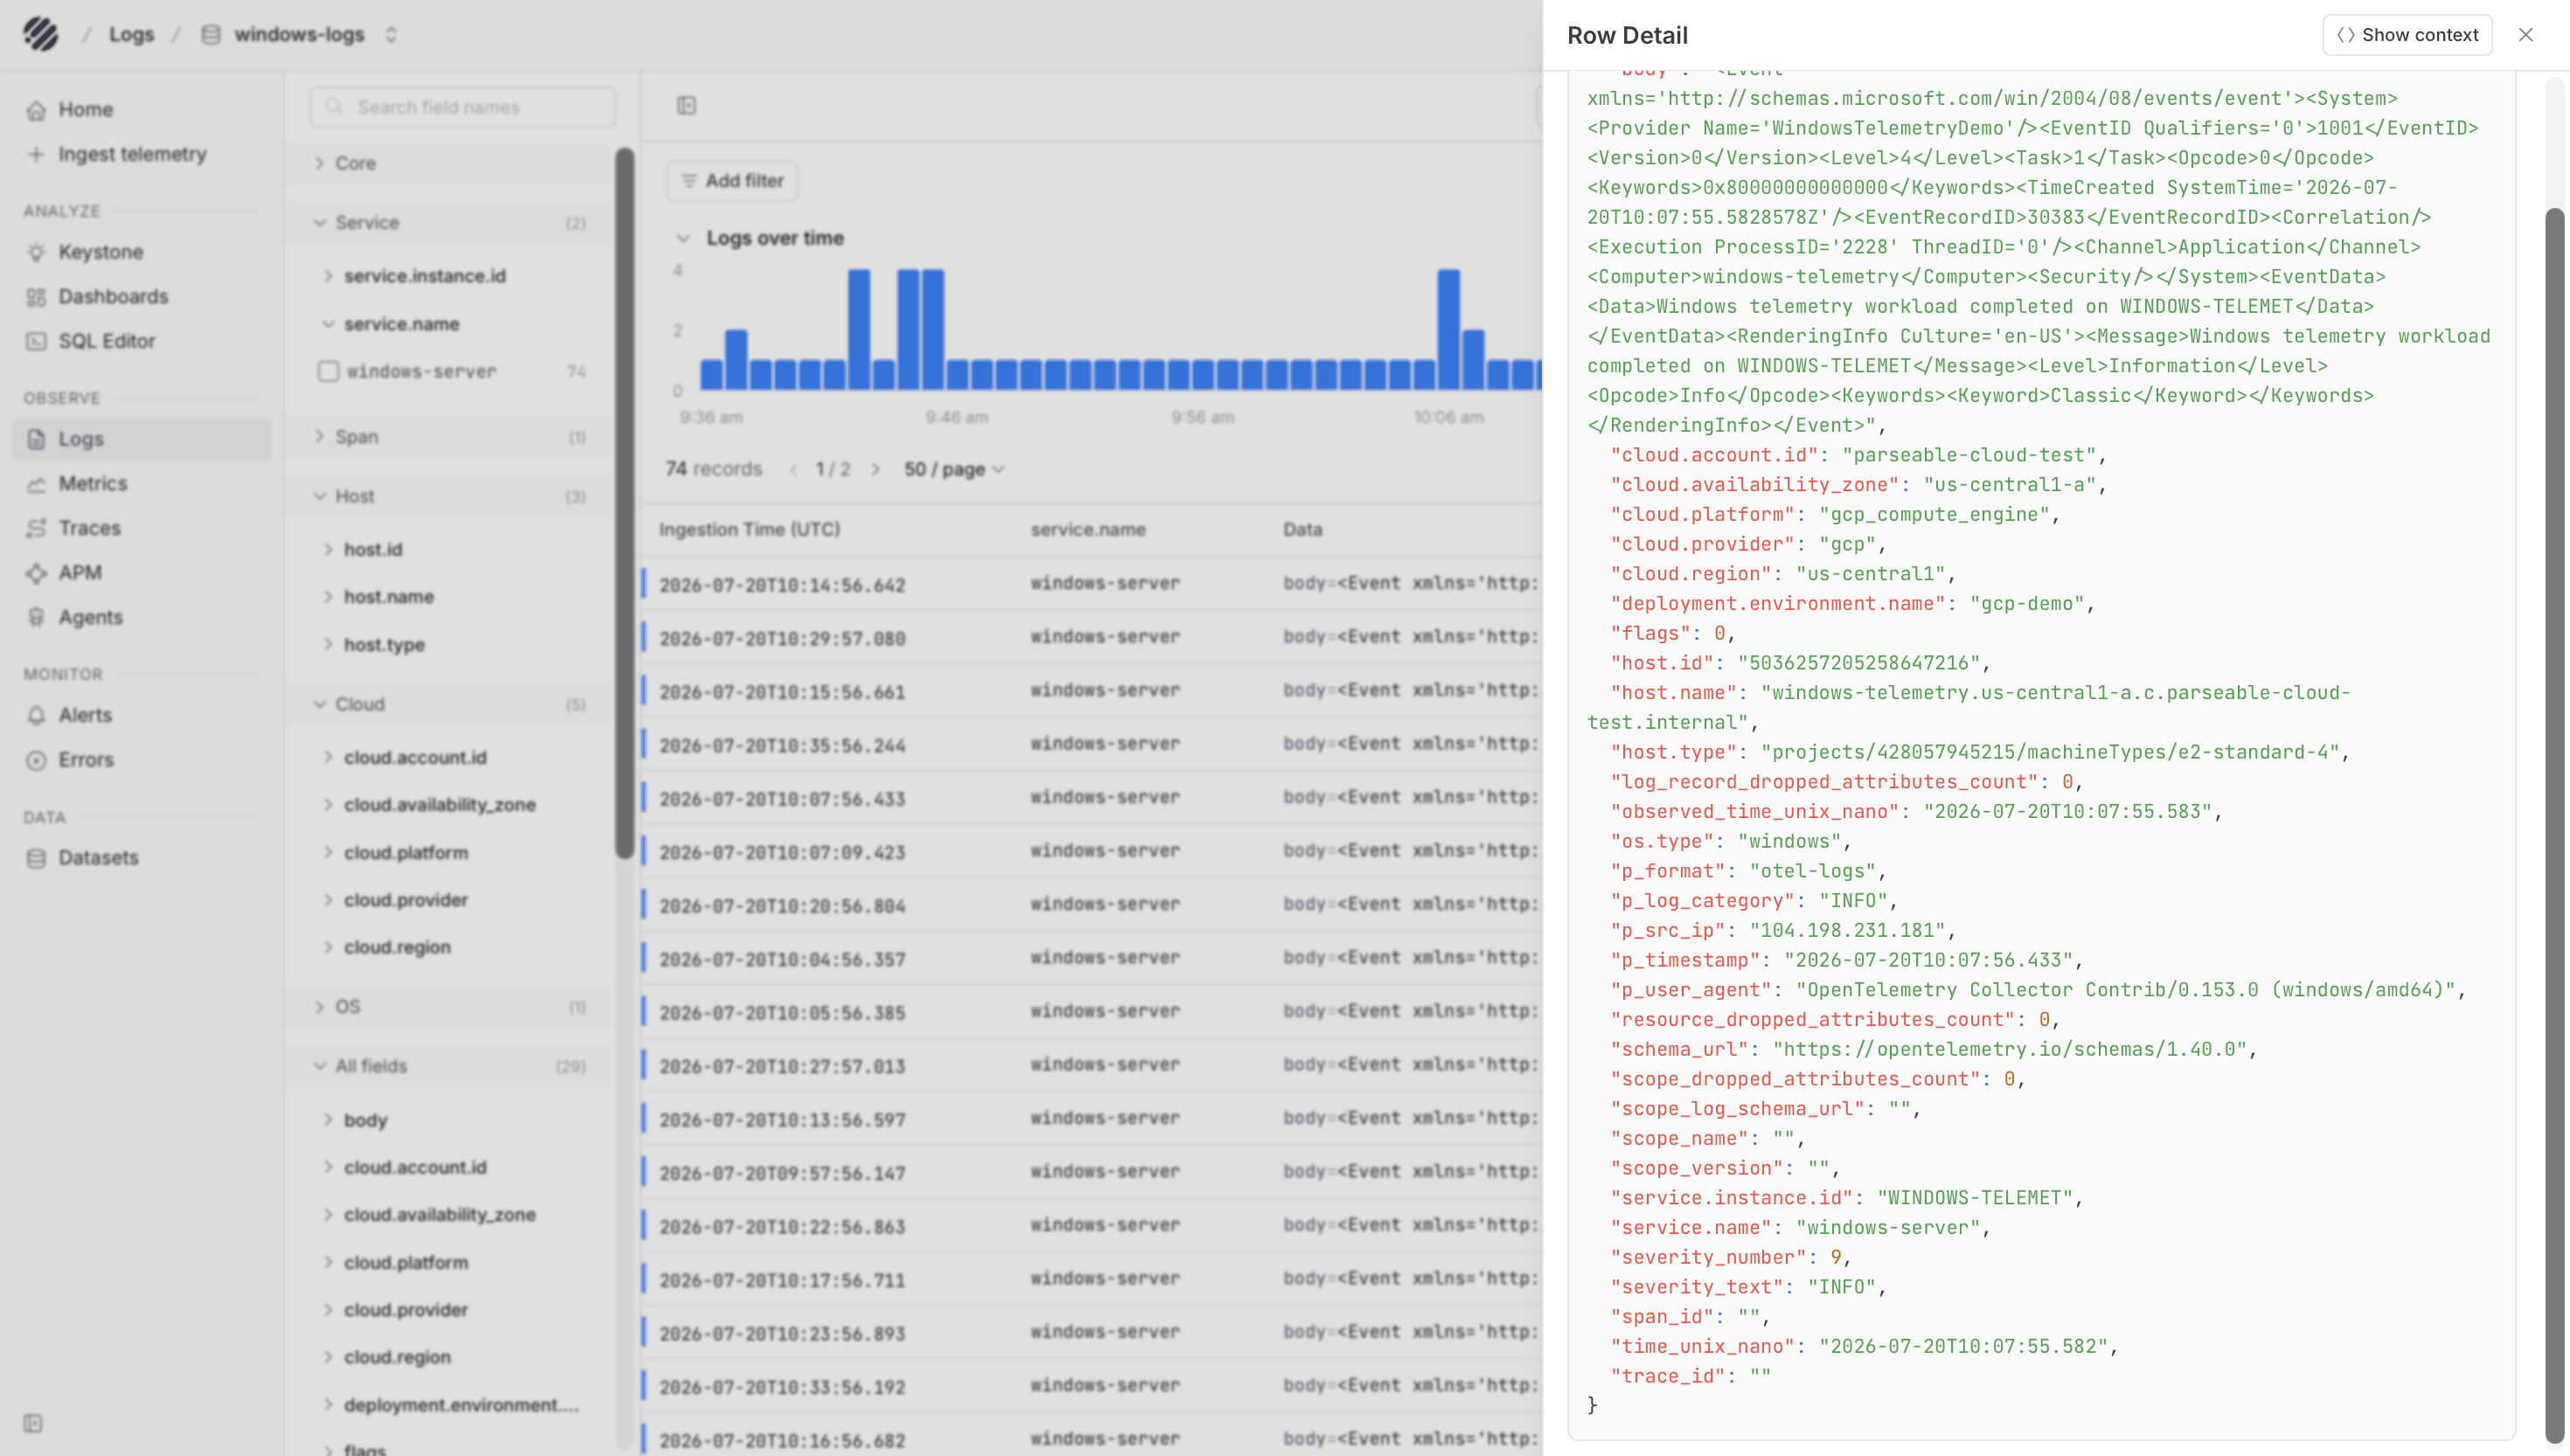
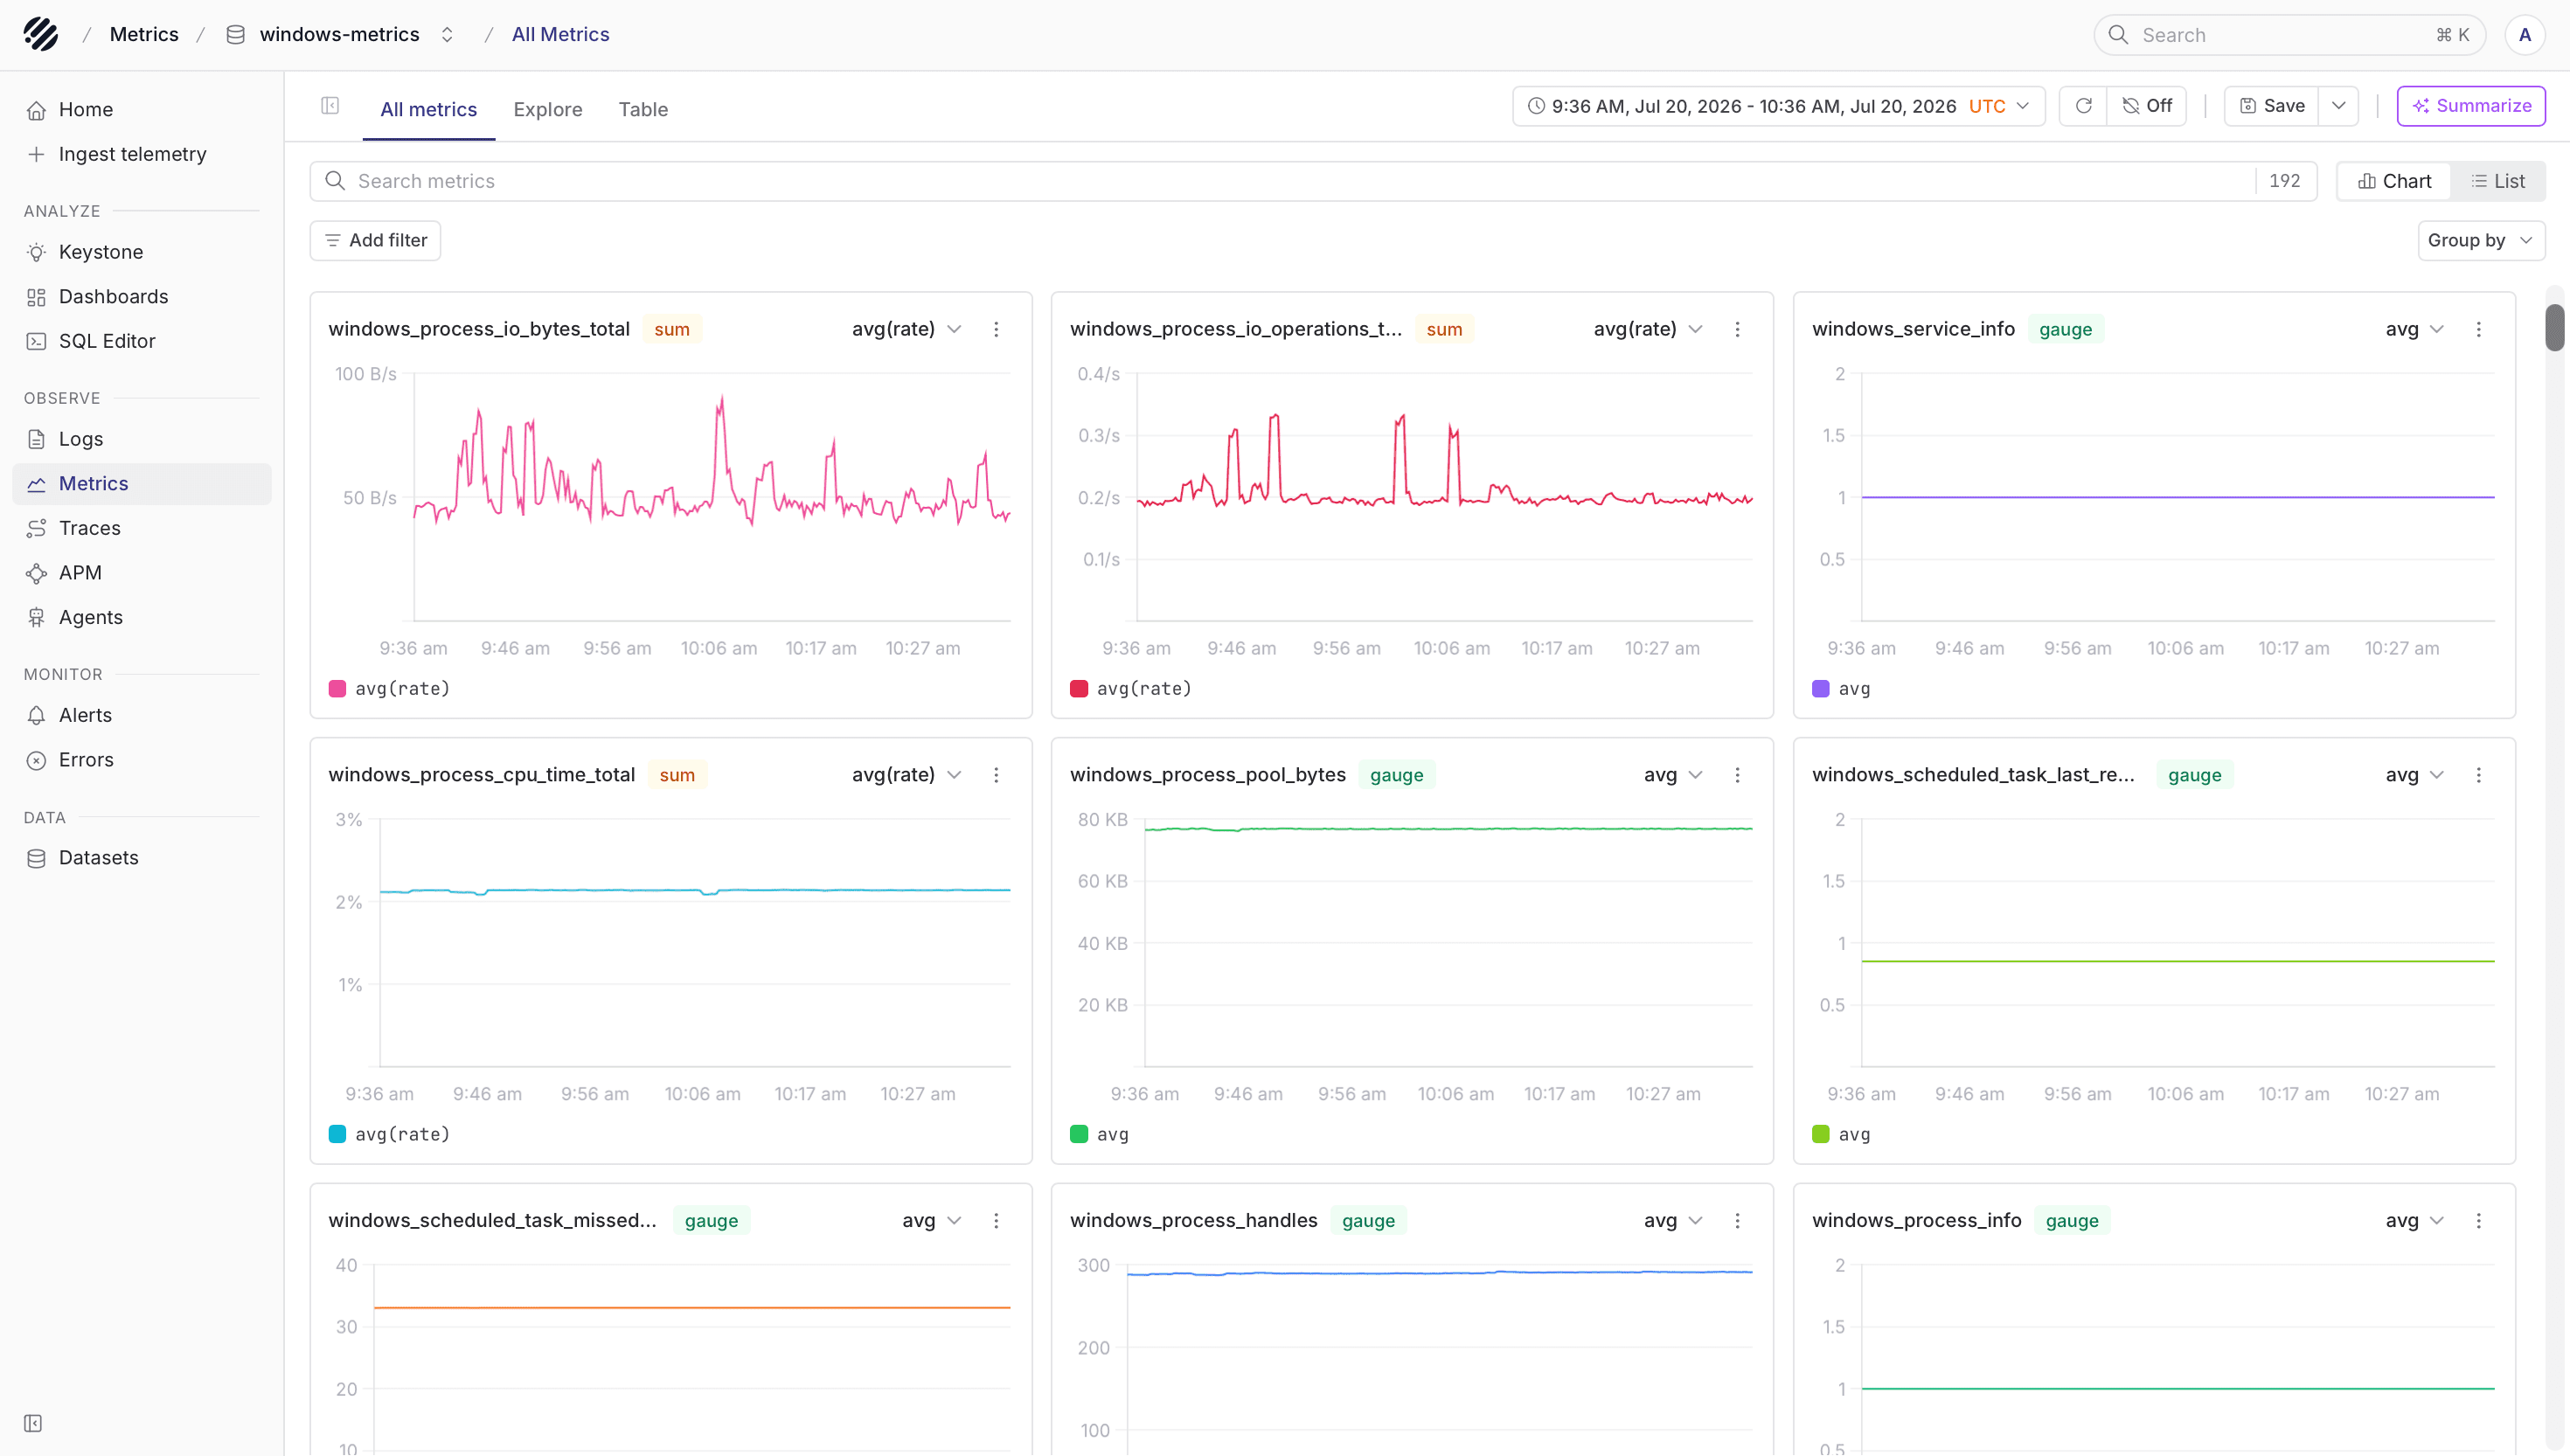
Once the Windows Server Collector is running, Event Logs and host metrics appear as separate datasets in Parseable. Use the logs view to inspect Application, System, and Security events, and use the metrics view to follow CPU, memory, disk, network, service, and process-level signals.
Dashboards
Public Windows Server dashboard templates are available in parseablehq/dashboards. Current templates use windows_* metrics from windows_exporter. Older dashboards that use wmi_* names require query translation.
Troubleshooting
Get-Service windows_exporter,otelcol-contribshould show both services as running.- Check exporter health at
http://127.0.0.1:9182/healthand Collector health athttp://127.0.0.1:13133. - Validate the Collector with
otelcol-contrib.exe validate --config=config.yamlbefore restarting the service. - An HTTP
405from Parseable indicates that the exporter is pointed at a query/UI endpoint instead of the ingestor. - Run the Collector interactively to expose authentication, TLS, network, and schema errors.
- A scheduled task result of
0means success. Use a short script path such asrun.ps1to avoid accidental line breaks in task arguments.
Was this page helpful?