
CloudWatch is one of the easiest observability tools to start using on AWS. You enable a few default metrics, point your logs at a log group, and you have visibility without writing much code. The problem is that cloudwatch pricing rarely stays simple once teams add custom metrics, retain logs for longer, build dashboards, configure alarms, and adopt newer observability features like Application Signals or Container Insights.
This guide breaks CloudWatch pricing down by category, shows what tends to get expensive, and explains how to model spend more realistically. The goal is to give DevOps engineers, SREs, and platform teams a working mental model of where costs accumulate and why they tend to surprise teams later.
One important note before we go further. CloudWatch pricing varies by AWS Region. For writing this article, we have refferenced US East (Ohio) region. Every example in this article should be treated as a framework for thinking about cost, not a universal quote. Validate numbers against the official AWS CloudWatch pricing page before final budgeting or planning, since AWS updates rates and example scenarios over time.
How CloudWatch pricing works
CloudWatch follows a pay-as-you-go model with no upfront commitment. There are no licenses, no seats, and no minimum spend. You only pay for what you use.
What makes cloudwatch pricing feel complicated is that "what you use" is split across many separate SKUs. Logs ingestion, log archive storage, queries, custom metrics, API requests, dashboards, alarms, Synthetics, RUM, X-Ray traces, Application Signals, Container Insights, and Database Insights all bill independently.
Charges accumulate across services and accounts. A single workload can touch four or five CloudWatch SKUs at the same time. Some features are free by default. Others are usage-based and grow with telemetry volume, query patterns, or resource counts.
The result is a model that looks cheap in isolation and gets harder to forecast as the observability footprint expands.
What is free in CloudWatch
CloudWatch has a meaningful free tier that covers light usage. AWS default service metrics are included, and the free tier provides:
- 5 GB of logs usage spread across ingestion, archive storage, and Logs Insights scanned data
- 10 custom or detailed monitoring metrics
- 1 million API requests, excluding some chargeable operations
- 3 custom dashboards with up to 50 metrics each
- 10 standard alarm metrics
- Limited trial access to newer observability features such as traces and Application Signals
This is enough to cover small projects, sandboxes, or early-stage production workloads. It is not enough for any team running multiple services at scale.
The main CloudWatch pricing categories
CloudWatch pricing is easier to understand when you treat it as a set of categories rather than a single bill. Here is the map for the rest of this article.
- Logs: Ingestion, archive storage, Logs Insights queries, Live Tail, data protection, and vended logs.
- Metrics: AWS default metrics, custom metrics, detailed monitoring, API requests, and Metric Streams.
- Dashboards and alarms: Custom dashboards, standard and high-resolution alarms, composite alarms, and Metrics Insights query alarms.
- Application observability: Application Signals, transaction search, X-Ray traces, Synthetics, and RUM.
- Infrastructure observability: Container Insights, Database Insights, Network Monitoring, and EKS or ECS enhanced observability.
Each of these has its own pricing logic. The next sections break them down.
CloudWatch Logs pricing
Logs are where teams most often see cloudwatch pricing climb faster than expected. It is the deepest pricing category in CloudWatch and the most sensitive to telemetry volume.
Log ingestion
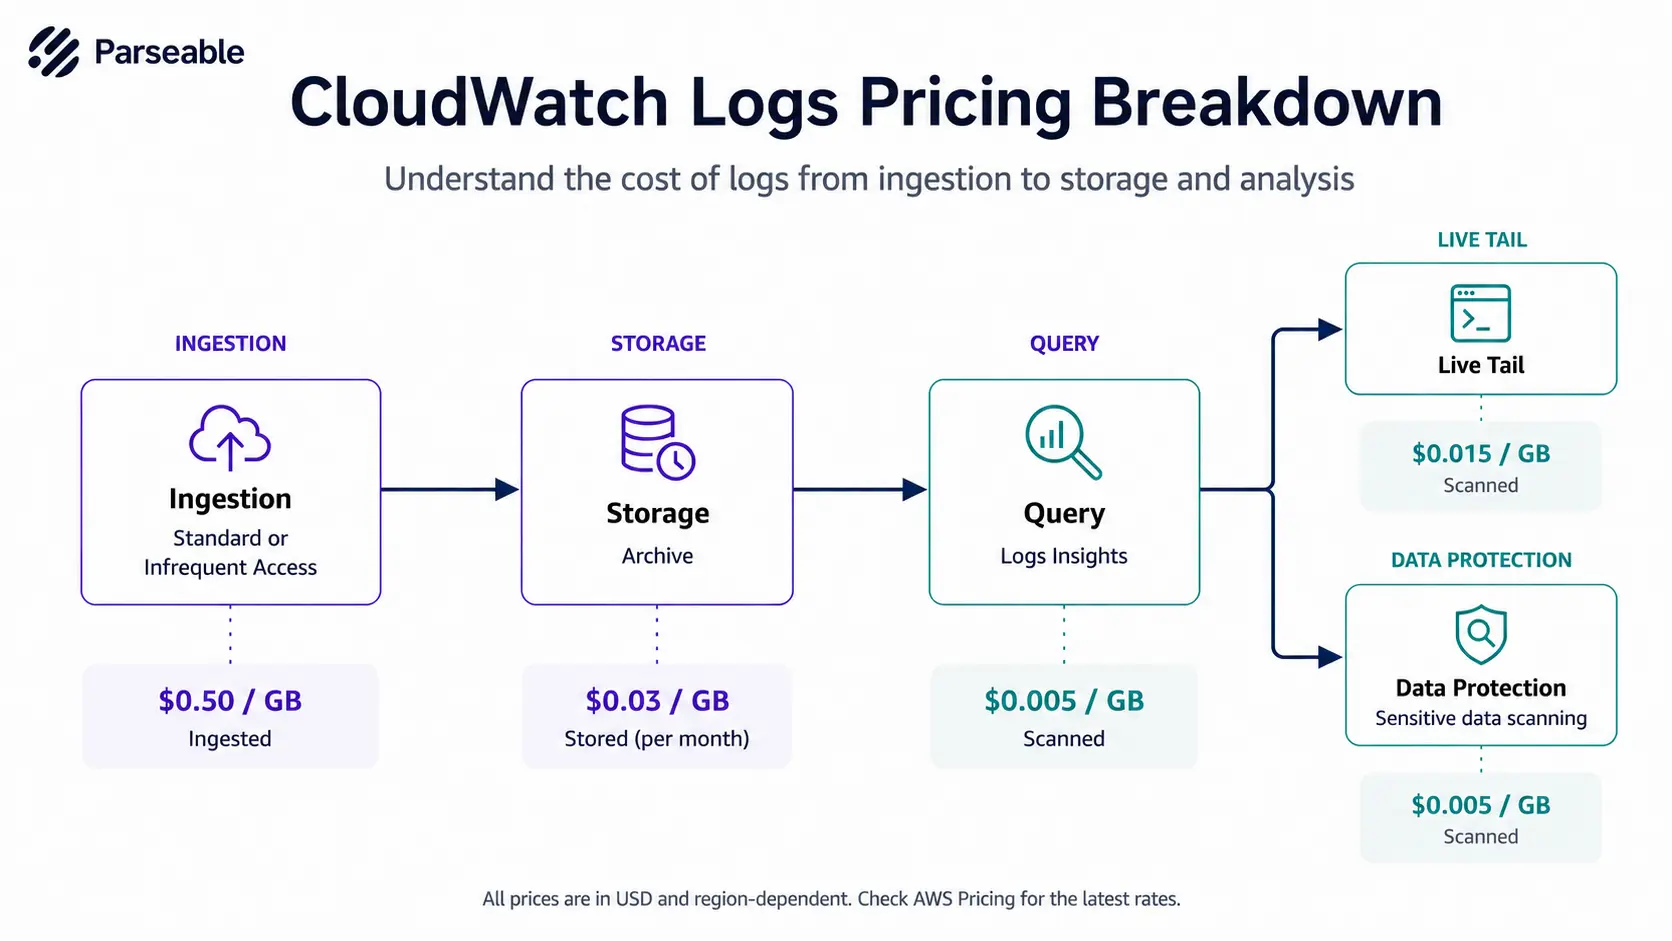
Standard log ingestion is charged at $0.50 per GB if you're in the US region. This is the line item that grows most directly with application volume. Higher throughput, more verbose logging, and more services all feed it.
Infrequent Access log ingestion is charged at $0.25 per GB. This tier is designed for logs that you still want to keep queryable but do not need at the lowest query latency. Logs in this class have reduced features and reduced query speeds.
If you run heavy log volumes, the difference between standard and Infrequent Access classes can shift bills materially.
Archive storage
Once logs are ingested, they sit in CloudWatch Logs storage. Archive storage is charged at $0.03 per GB. The unit cost looks low, but at high volume with long retention it stacks up. A team ingesting hundreds of gigabytes per day with year-long retention pays storage every month, indefinitely.
Retention is a knob. Many teams default to "never expire" without realizing how that compounds over time.
Logs Insights query charges
Logs Insights is the CloudWatch query engine. It is charged at $0.005 per GB scanned. The cost looks small per query, but it scales with how much data each query touches.
A loose query pattern that scans a wide time range or unfiltered log groups can scan hundreds of gigabytes in a single run. Multiply that by a team of engineers debugging incidents, building dashboards, or backing alarms with queries, and the number grows quickly.
Live Tail
Live Tail provides a streaming view of log events as they arrive. It is priced at $0.01 per minute. This is cheap for short debugging sessions and expensive if it stays open across multiple users for long periods.
Stop paying separately for ingestion, storage, and queries. Switch to Parseable and pay only for ingested data, starting at $0.39/GB.
Data protection and masking
CloudWatch Logs can scan for sensitive data such as credentials or PII and mask it. Data protection scanning is referenced at $0.12 per GB scanned. This is a per-volume charge applied separately from ingestion.
For teams with strict compliance requirements, it can be valuable. For teams that turn it on broadly without scoping it tightly, it becomes a significant added cost on top of ingestion.
Vended logs
Some AWS services emit "vended logs" such as VPC Flow Logs, Route 53 logs, and CloudFront logs. These have separate pricing and are typically billed at lower rates than standard ingestion, but volumes can be enormous.
VPC Flow Logs in particular can produce more data than application logs in a busy environment. Treat them as a separate cost center when modeling spend.
CloudWatch Metrics pricing
Metrics pricing is more straightforward than logs but has its own cost multipliers.
AWS default metrics
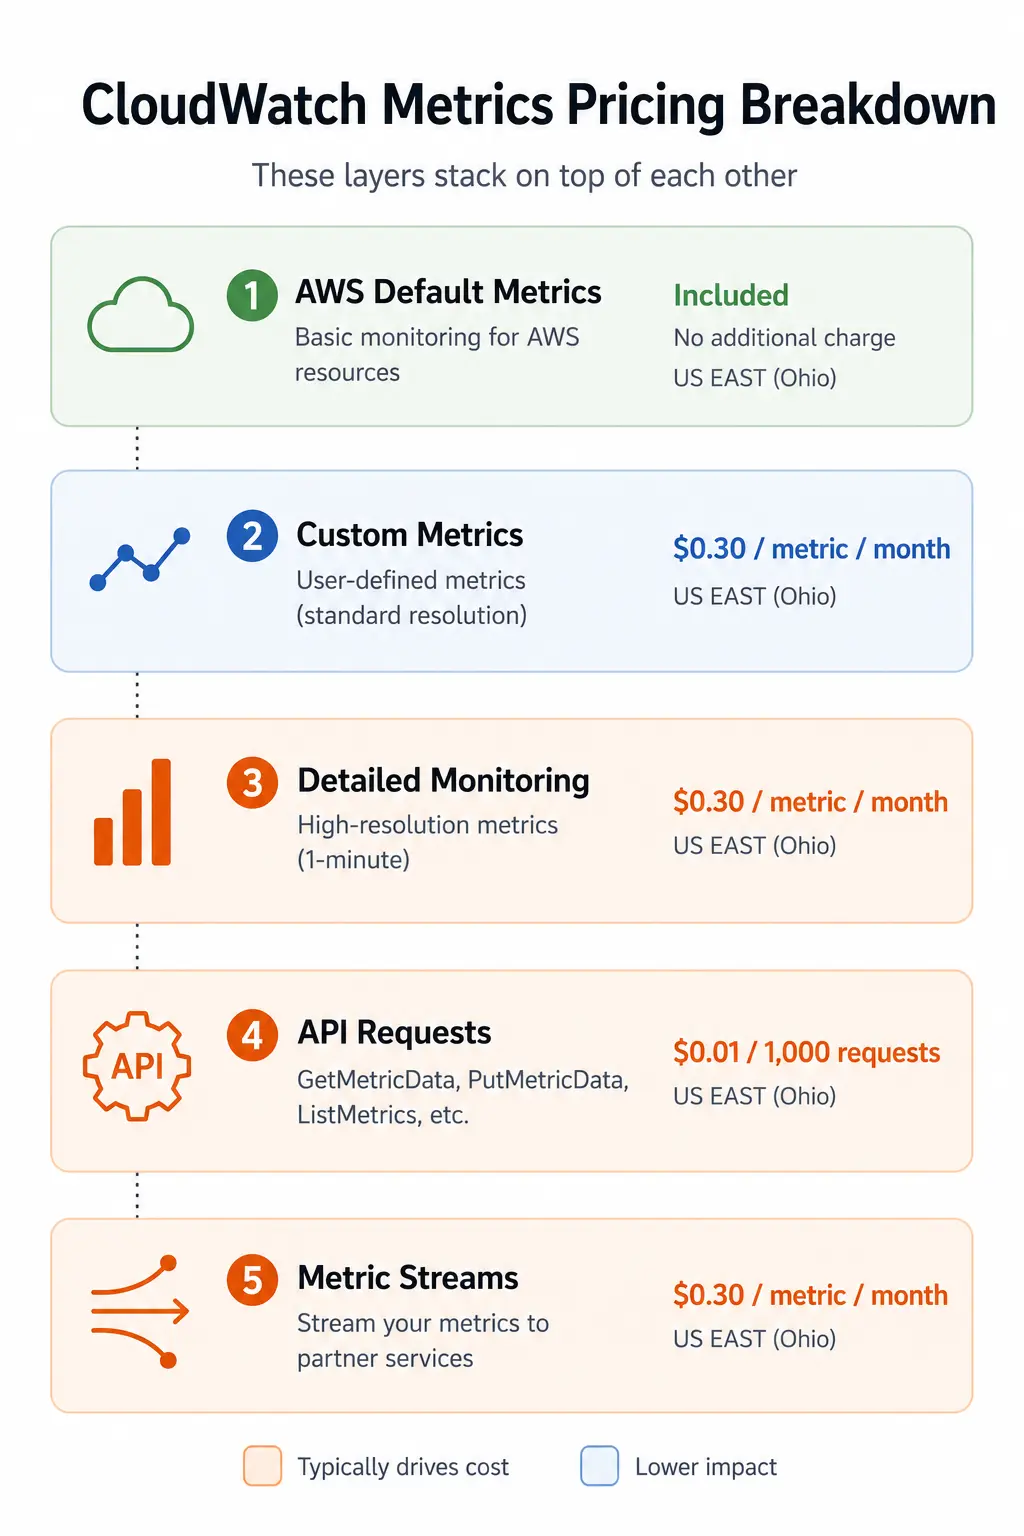
Basic service metrics emitted by AWS services are generally included with no per-metric charge. EC2, RDS, Lambda, and most managed services publish these by default at standard resolution.
Custom metrics
Custom metrics that you publish through the PutMetricData API are billed separately. AWS pcharges then at $0.30 per metric per month in the first tier. Tier discounts apply at higher volumes.
A "metric" here is a unique combination of metric name and dimensions. This is the part that catches teams off guard. A single metric name with many dimensions like service, region, environment, and customer ID can multiply into thousands of billable metrics.
Detailed monitoring
Detailed monitoring publishes service metrics at 1-minute resolution instead of the default 5 minutes. It is billed the same way as custom metrics. Enabling it broadly across many EC2 instances or other resources is a common reason cloudwatch pricing climbs unexpectedly.
API request charges
CloudWatch API calls themselves are billed beyond the free tier. PutMetricData, GetMetricData, GetMetricStatistics, and similar calls add up at high request rates, particularly for teams running custom dashboards or external integrations that poll metrics frequently.
Metric Streams
Metric Streams continuously push CloudWatch metrics to a destination such as Kinesis Data Firehose or a third-party tool. AWS ricing it at $0.003 per 1,000 metric updates. Volume here is driven by how many metrics you stream and how often. Streaming a large catalog at high resolution can become its own meaningful line item.
What multiplies cost on the metrics side:
- Large numbers of custom metrics
- High-cardinality dimensions
- Detailed monitoring enabled across many resources
- Frequent metric polling
- Streaming wide metric sets to external systems
Dashboards and alarms pricing
Dashboards and alarms look cheap in isolation. They tend to sprawl.
Custom dashboards
The free tier includes 3 custom dashboards with up to 50 metrics each. Beyond that, custom dashboards are billed per dashboard per month. In organizations with team-by-team dashboards, this adds up quietly.
Standard alarms
Standard alarm metrics are referenced at $0.10 per alarm metric. This is a flat charge per alarm metric, not per evaluation.
Ten alarms feel free. A hundred alarms per service across dozens of services is a different story.
Beyond the standard alarm, CloudWatch also offers:
- High-resolution alarms that evaluate metrics at higher frequencies.
- Composite alarms that combine multiple alarms into a single logical alarm.
- Metrics Insights query alarms that bills on query usage in addition to the alarm itself.
Individually these charges feel small. Across a large org with multiple teams, alarms and dashboards become a recurring monthly cost that quietly grows.
Application observability pricing
CloudWatch pricing is no longer just about logs and metrics. AWS has steadily added application observability features that bill separately and can change total cost meaningfully. AWS now charges you seprately for:
- Application Signals billed per signal and per request volume.
- Transaction search that bills on indexed and scanned trace volume.
- X-Ray traces, that records distributed traces are billed on traces recorded and traces retrieved or scanned.
- Synthetics billed per canary run.
- RUM charged on event-based.
These features expand what CloudWatch can do. They also expand the surface area teams need to track when forecasting spend.
Infrastructure observability pricing
These features are not always part of the "basic CloudWatch" mental model. They become meaningful cost drivers in real AWS environments.
Container Insights
Container Insights provides EKS, ECS, and Fargate observability. It is billed on observed resource counts and on the log and metric volume generated by the integration. In clusters with many pods, it grows quickly.
Database Insights
Database Insights covers RDS, Aurora, and related services with deeper telemetry than the default metrics. Pricing scales with monitored instances and signal volume.
Network Monitoring
CloudWatch Network Monitoring includes Internet Monitor and Network Flow Monitor. Each has its own per-monitor and per-volume charges.
EKS or ECS enhanced observability
Enhanced container observability adds more granular metrics, logs, and traces. The trade-off is straightforward. More visibility costs more.
The point is not that these features are wasteful. The point is that they are not free, and the total cloudwatch pricing picture often includes more than logs and metrics.
Which CloudWatch costs are hardest to predict
CloudWatch feels manageable at first and harder to forecast later. Here is where the unpredictability tends to live.
1. Logs that keep growing quietly
Application logs grow with traffic, feature releases, and added services. Most teams do not actively prune verbosity. Retention defaults stretch out. Six months later, ingestion volume looks nothing like the original estimate.
2. Custom metrics that multiply across dimensions
Adding a new dimension to a metric feels harmless. In practice, it can multiply unique metric count significantly. Teams discover this only when they audit the metrics inventory.
3. Alarms and dashboards spread across teams
Alarms and dashboards rarely have central ownership. Every team adds their own. The count grows linearly with org size.
4. Query and scan costs that rise with usage
Logs Insights, X-Ray scans, and Metrics Insights queries all bill on volume scanned. Heavy debugging weeks, large incidents, and unfiltered queries push these line items up.
5. Feature sprawl across observability add-ons
A team that enables Application Signals, Synthetics, RUM, Container Insights, and Database Insights together can find that the bill no longer maps to anyone's intuitive understanding of what CloudWatch costs.
Where flat pricing becomes easier to reason about: Strategic comparison
After breaking down CloudWatch's layered model, the question many teams reach is structural rather than tactical. They are not asking "how do we cut logs by 10%." They are asking "is there a simpler pricing model that fits how we actually use observability?"
This is where it is worth contrasting CloudWatch's layered usage pricing against a simpler ingestion-based pricing model.
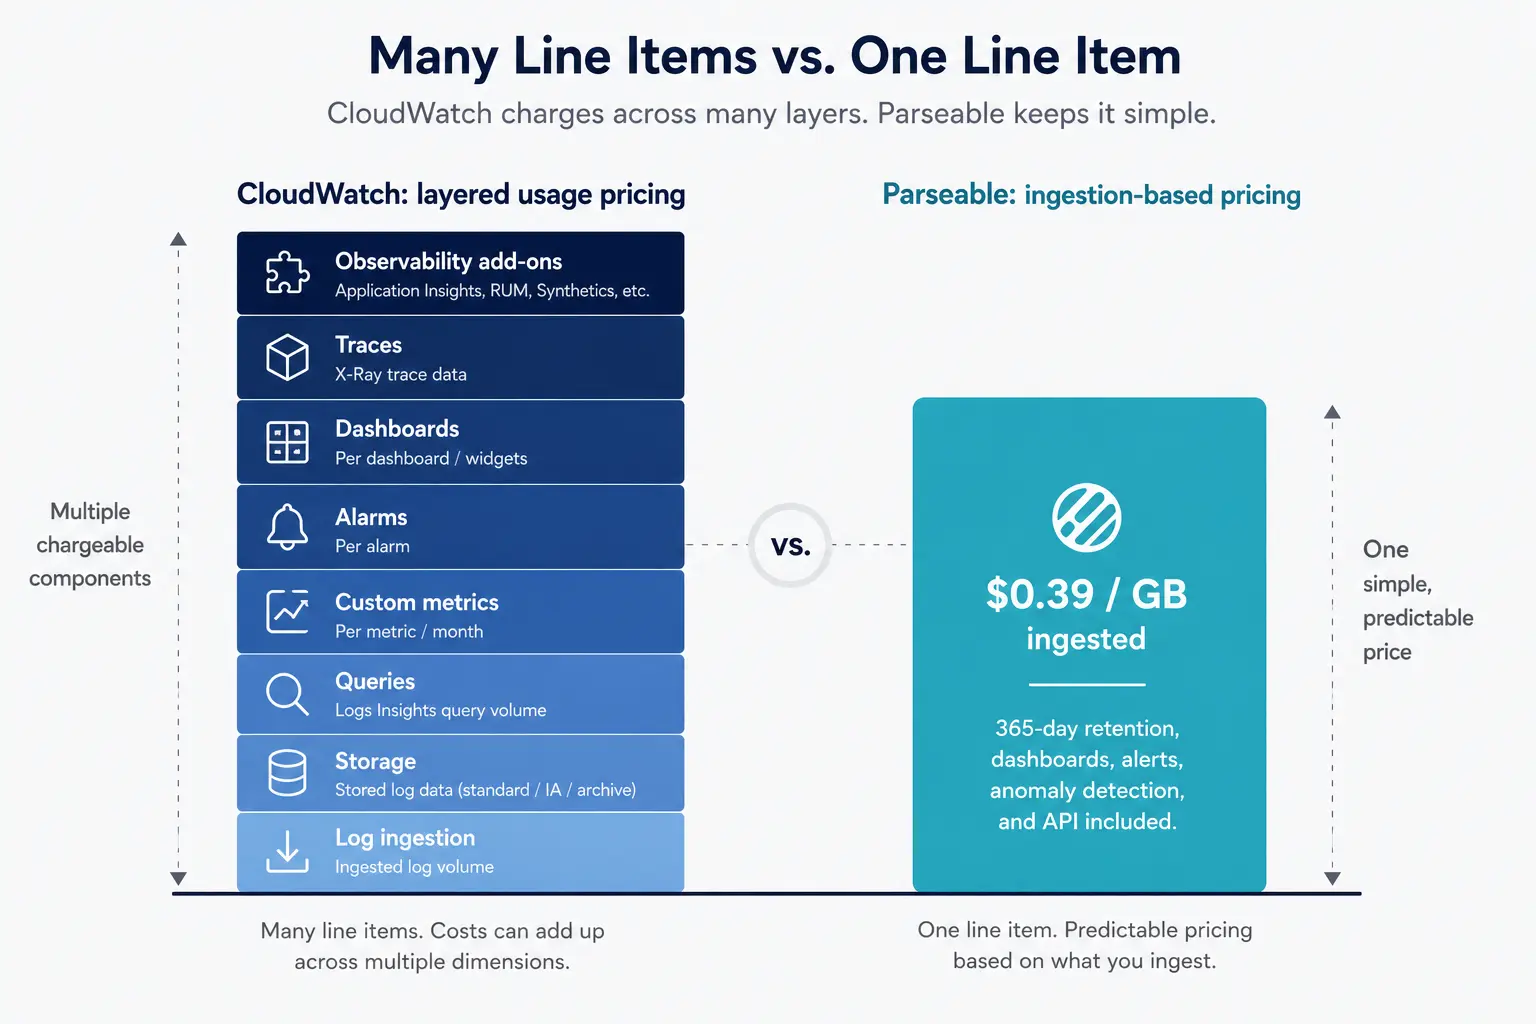
Parseable is built around a different model. Pricing on Pro is $0.39 per GB ingested, with 365 days of retention included. Dashboards, alerts, anomaly detection, and API access are included rather than billed as separate SKUs. Storage is S3-native, which decouples retention cost from ingestion cost in a way the CloudWatch model does not.
The point is not that CloudWatch is bad. The point is that the model is different. CloudWatch separates logs, metrics, alarms, dashboards, queries, and observability features into individually-billed line items. Parseable bills on volume ingested and includes the rest. Both can be the right fit depending on workload mix, team size, and AWS-native commitment level.
For teams that want a pricing model that is easier to reason about as telemetry grows, sign up for Parseable and try the ingestion-based approach against your current observability footprint.
How to estimate CloudWatch spend more accurately
Here's how you can estimate your CloudWatch spend. As mentioned, treat this example as a framework rather then a standard ballpark:
Start with telemetry volume, not service names
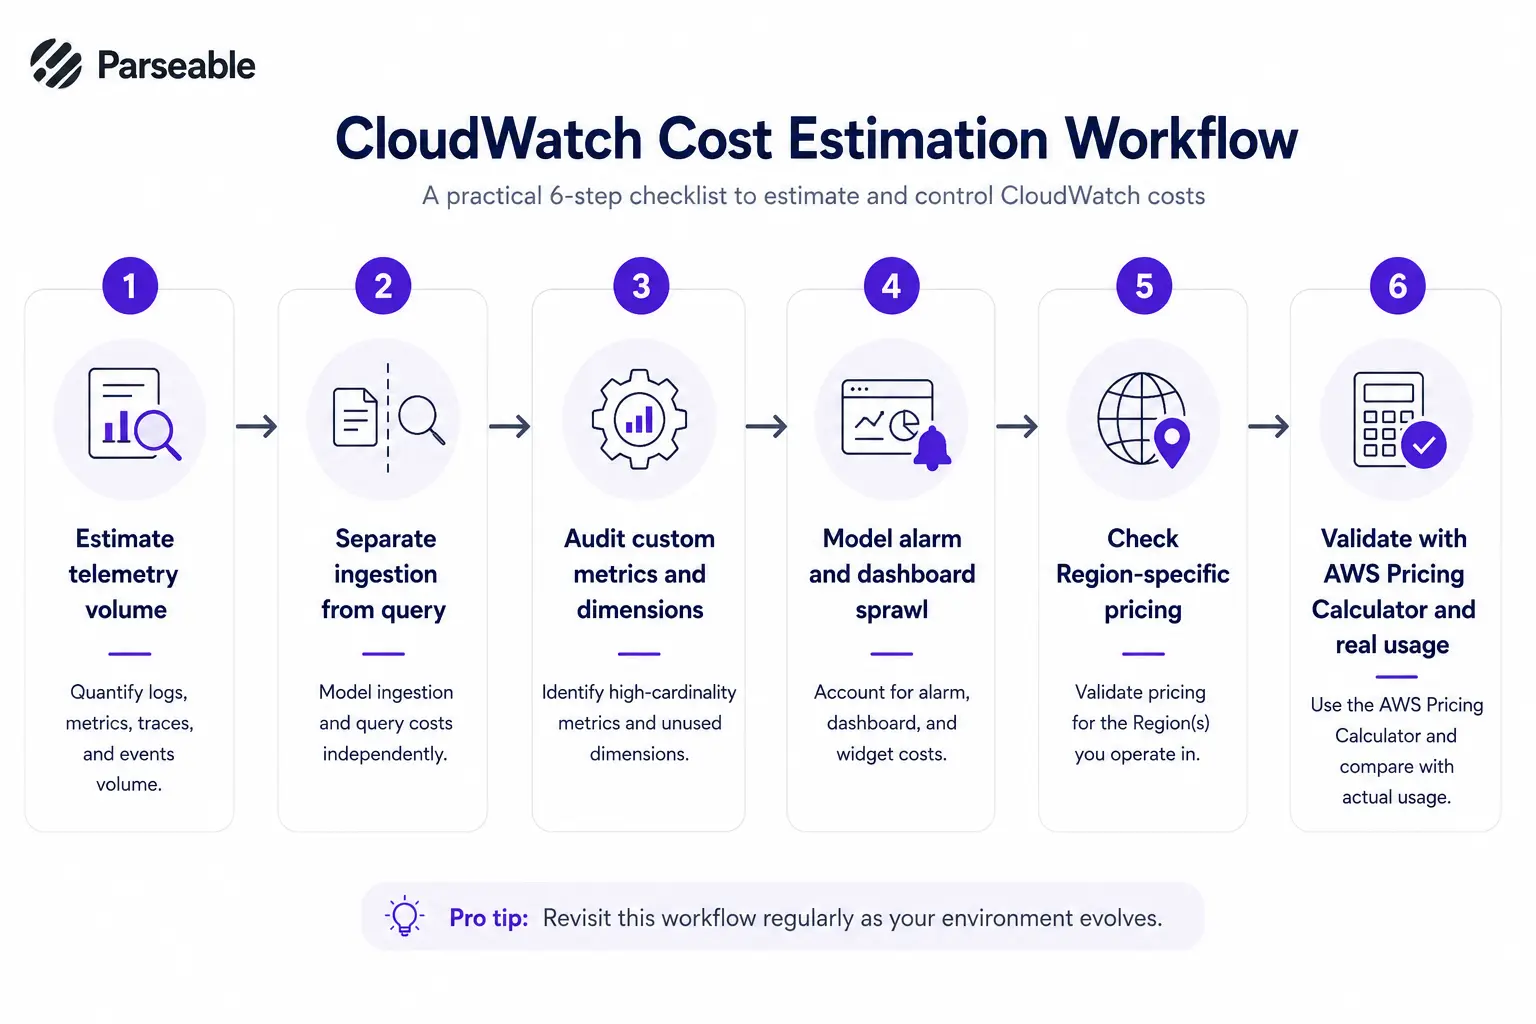
Most CloudWatch surprises come from volume, not from the list of AWS services you use. Start by estimating logs ingested per day, custom metric counts, and trace and event volumes. Tie these to the SKUs they map to.
Track log ingestion separately from query volume
These are different bills. A workload can have low ingestion and high scan cost if teams query heavily. Model them as two separate line items.
Audit custom metrics and dimensions
Use the metrics console or the API to list custom metrics and their dimensions. Identify which metric names have high cardinality. This is often the biggest hidden multiplier.
Model alarm and dashboard sprawl
Estimate alarms per service multiplied by services. Include composite alarms. Add dashboards per team. The numbers add up faster than expected.
Check Region-specific pricing
CloudWatch pricing is not the same across Regions. Always verify current per-Region rates on the official AWS CloudWatch pricing page when budgeting.
Use the AWS Pricing Calculator, but validate with real usage
The AWS Pricing Calculator is useful for an initial estimate. It is not a substitute for measuring actual ingestion, scan volume, and metric counts in production accounts. Validate forecasts against the Cost and Usage Report once workloads run for a few weeks.
How to reduce CloudWatch costs
Cost optimization is not just "log less." Here is where the real levers are.
Reduce noisy log ingestion
Audit log volume by log group. Identify the top contributors. Lower verbosity, drop debug-level logs in production, and filter at the source rather than at ingestion.
Shorten retention where it makes sense
Many teams keep all logs forever by default. Define retention per log group based on actual use. Operational logs may need 30 days. Compliance logs may need years. Mixing the two at the longest retention is wasteful.
Archive intelligently
For logs that you must retain but rarely query, consider exporting older data to S3 or moving them to the Infrequent Access class. This is one of the larger structural levers on log spend.
Cut unnecessary custom metrics
Review your custom metrics inventory. Remove metrics no one uses. Reduce dimension cardinality where it does not serve a real query pattern.
Review alarm counts and high-resolution usage
Audit alarms for duplicates and stale ones. Downgrade high-resolution alarms to standard where the workload tolerates it.
Watch scan-heavy Logs Insights habits
Set query time ranges tightly. Avoid scanning all log groups when one or two will do. Cache common queries through dashboards rather than rerunning ad-hoc queries during incidents.
Reassess whether every observability workflow belongs in CloudWatch
Some workloads are a natural fit for CloudWatch. Others may be better served by a tool with a different pricing model. The right answer depends on workload profile, team size, and how much of the observability footprint is high-volume logging versus AWS-native metrics. This comparison of log aggregation tools is a useful starting point for understanding how different approaches handle ingestion, query, and retention.
When CloudWatch pricing is still a good fit
CloudWatch is the right answer for plenty of teams.
-
AWS-native teams with modest telemetry volumes: If you run a handful of services with low log volume and rely on default metrics, the free tier and pay-as-you-go pricing rarely become a problem.
-
Teams mostly using default metrics and basic alarms: If your observability needs are met by AWS-emitted metrics, a few dashboards, and standard alarms, the layered model stays manageable.
-
Organizations that want to stay fully inside AWS workflows: CloudWatch is deeply integrated with IAM, EventBridge, Lambda, and the rest of the AWS surface area. For teams that prioritize staying inside AWS-native tooling, that integration value can outweigh pricing complexity.
When should teams start looking for a CloudWatch alternative
Here are some of the reasons when it teams start looking for CloudWatch alternatives:
-
High-volume log retention: If logs are the dominant cost driver and you need long retention, the combination of ingestion and storage charges starts to feel disproportionate.
-
Growing custom metrics and alert complexity: When custom metrics balloon and alarms spread across teams, per-metric and per-alarm SKUs accumulate.
-
Cross-signal visibility across logs, metrics, and traces: If your team wants logs, metrics, traces, and dashboards in a single tool rather than across separate CloudWatch SKUs, the unified mental model is harder to build inside CloudWatch.
-
Difficulty forecasting total observability spend: If finance keeps asking why the bill changed and engineering cannot answer cleanly, the pricing model is no longer serving anyone.
When CloudWatch costs start adding up across ingestion, storage, retention, and queries, teams often move to Parseable for simpler pricing and an easier migration path.
Conclusion
CloudWatch pricing is not one price. It is a collection of usage-based charges across logs, metrics, alarms, dashboards, traces, and a growing set of observability features. Each category has its own logic, its own multipliers, and its own way of surprising teams that did not model it carefully.
The practical takeaway is straightforward. Understand the categories. Model the biggest drivers first. Then decide whether the pricing model still fits the team's observability needs as telemetry volume and team count grow.
For teams whose observability footprint is increasingly dominated by logs and who want a pricing structure that is easier to reason about, sign up for Parseable and compare ingestion-based pricing against the current CloudWatch bill.