

Grafana vs Datadog are often compared because both help teams monitor production systems, build dashboards, create alerts, and investigate performance issues.
But they are not built around the same operating model. Grafana is more open and composable, giving teams a flexible way to visualize data from many sources. Datadog is more integrated, giving teams a managed observability platform for infrastructure, logs, metrics, traces, APM, dashboards, and alerts.
The Grafana vs Datadog decision usually comes down to control versus convenience. Grafana gives teams more freedom to choose their own backends, such as Prometheus, Loki, Tempo, Elasticsearch, CloudWatch, and SQL databases.
Datadog gives teams more out-of-the-box workflows, where telemetry is collected, stored, visualized, and alerted on inside one vendor platform.
This guide compares Grafana and Datadog across metrics, logs, traces, dashboards, alerting, pricing, and architecture. It also covers where Parseable fits when teams want a more unified telemetry layer for logs, metrics, and traces, with SQL, PromQL, dashboards, alerts, and AI-assisted investigation.
Grafana vs Datadog: quick comparison
The simplest way to compare Grafana vs Datadog is to look at the operating model.
Grafana is best when teams want a flexible dashboarding and visualization layer across different data sources. Datadog is best when teams want a managed observability platform where infrastructure monitoring, logs, traces, APM, dashboards, and alerts are already part of the same product suite.
| Category | Grafana | Datadog |
|---|---|---|
| Primary role | Visualization, dashboards, alerting, and exploration across data sources | Managed full-stack observability and monitoring platform |
| Operating model | Flexible and composable | Integrated and vendor-managed |
| Main strength | Dashboards, data-source flexibility, and open ecosystem | Built-in infrastructure monitoring, logs, traces, APM, monitors, dashboards, and integrations |
| Data source model | Connects to Prometheus, Loki, Tempo, Elasticsearch, CloudWatch, SQL databases, and other sources | Collects telemetry through agents, integrations, APIs, and Datadog product workflows |
| Query language | Depends on the connected data source, such as PromQL, LogQL, SQL, or Elasticsearch syntax | Datadog-native query and analytics workflows across metrics, logs, traces, dashboards, and monitors |
| Dashboards | Strong for custom dashboards across many sources | Strong for dashboards inside Datadog workflows |
| Metrics | Strong with Prometheus and time-series backends | Built-in infrastructure, cloud, container, and custom metrics monitoring |
| Logs | Depends on the connected log backend, such as Loki, Elasticsearch, or Grafana Cloud Logs | Built-in log collection, processing, analytics, and correlation |
| Traces and APM | Depends on connected tracing backends such as Tempo, Jaeger, Zipkin, or other sources | Built-in APM and distributed tracing |
| Alerting | Strong across connected data sources | Strong built-in monitors and notification workflows |
| Pricing model | Depends on Grafana OSS, Grafana Cloud, and connected backends | Modular pricing across infrastructure, logs, APM, RUM, synthetics, security, and other products |
| Best fit | Teams that want flexibility, backend choice, and customizable dashboards | Teams that want a managed, integrated observability suite |
Grafana and Datadog are not direct replacements for each other. Grafana is usually the better fit when the team wants control over the observability backend and a flexible dashboard layer on top. Datadog is usually the better fit when the team wants a managed platform with many monitoring workflows already built in.
Comparing Grafana and Datadog because your observability stack is getting harder to manage? Parseable gives teams one platform for logs, metrics, and traces, with SQL, PromQL, dashboards, alerts, anomaly detection, and AI-assisted investigation. Sign up for Parseable.
What is Grafana?
Grafana is an open-source platform for visualization, dashboards, alerting, and data exploration. In a Grafana vs Datadog comparison, Grafana is best understood as the flexible visual layer that connects to different data sources instead of keeping every workflow inside one backend.
Teams use Grafana to build dashboards, monitor infrastructure, explore incidents, and create alerts across systems like Prometheus, Loki, Tempo, Elasticsearch, CloudWatch, SQL databases, and other connected sources.
Where Grafana works best
Grafana works best when teams want dashboard flexibility and backend choice. It is a strong fit for teams using Prometheus for metrics, Loki for logs, Tempo for traces, CloudWatch for cloud data, or Elasticsearch for search data.
This is where Grafana differs from Datadog. Grafana gives teams more control over how telemetry is stored, queried, retained, and visualized. Datadog gives teams more managed workflows inside one platform.
For teams comparing Grafana and Datadog for monitoring, Grafana is usually the better fit when customizable dashboards, Prometheus-style metrics, and data-source flexibility matter most.
What is Datadog?
Datadog is a managed observability and monitoring platform for cloud infrastructure, applications, logs, metrics, traces, dashboards, alerts, APM, and security workflows. In a Grafana vs Datadog comparison, Datadog is best understood as the more integrated platform, where many observability workflows are available inside one vendor-managed product.
Teams use Datadog to collect telemetry from hosts, containers, Kubernetes clusters, cloud services, databases, APIs, and applications. They can then monitor system health, create dashboards, configure alerts, analyze logs, trace requests, and investigate performance issues from the Datadog platform.
Where Datadog works best
Datadog works best when teams want a managed observability suite instead of assembling several separate tools. It is a strong fit when infrastructure monitoring, logs, APM, dashboards, monitors, and integrations need to work together quickly. Teams evaluating this model often compare it with Datadog alternatives when cost, control, or telemetry ownership becomes a concern.
This is where Datadog differs from Grafana. Datadog gives teams more out-of-the-box workflows inside one platform. Grafana gives teams more flexibility to choose and connect their own backends.
For teams comparing Datadog and Grafana for monitoring, Datadog is usually the better fit when speed, managed setup, built-in APM, log management, and integrated alerting matter more than backend control.
Grafana vs Datadog: key differences
The main difference between Grafana and Datadog is the operating model.
Grafana is composable. Teams choose the data sources, storage backends, query languages, and retention model, then use Grafana to visualize and explore that data.
Datadog is integrated. Teams send telemetry into Datadog and use Datadog’s built-in products for infrastructure monitoring, logs, traces, APM, dashboards, monitors, and analytics.
Grafana is flexible, Datadog is managed
Grafana gives teams more flexibility over the observability stack. It can connect to many systems, including Prometheus for metrics, Loki for logs, Tempo for traces, Elasticsearch for search data, CloudWatch for cloud monitoring, and SQL databases for operational data.
That makes Grafana useful when teams want control over where data is stored, how it is queried, and how dashboards are built.
Datadog takes a more managed approach. It gives teams a broad observability platform where infrastructure monitoring, logs, APM, dashboards, monitors, and integrations are available inside one product suite.
This makes Datadog useful when teams want faster setup and fewer separate systems to operate.
Grafana depends on connected data sources
Grafana does not act as the main backend for every telemetry signal by default. It queries connected data sources and visualizes the results in dashboards, panels, Explore, and alerts.
This is powerful, but it also means the quality of the Grafana experience depends on the backend behind it. Metrics may come from Prometheus. Logs may come from Loki or Elasticsearch. Traces may come from Tempo, Jaeger, or another tracing backend.
Grafana gives teams one visual layer, but the storage, retention, cost, query behavior, and scaling model still depend on the connected systems.
Datadog gives more built-in workflows
Datadog is stronger when teams want more observability workflows built in from the start. Instead of connecting and managing several backends, teams can use Datadog for infrastructure visibility, log management, APM, dashboards, monitors, integrations, and related platform workflows.
This reduces the amount of setup needed to get started. Teams can collect telemetry through agents, integrations, APIs, and Datadog product workflows, then use Datadog to investigate performance issues across services and infrastructure.
The tradeoff is platform dependency. The more workflows a team moves into Datadog, the more the monitoring architecture depends on Datadog’s data model, pricing model, and product ecosystem.
Grafana query workflows depend on the backend
Grafana does not have one query language for every workflow. The query language changes based on the connected data source.
For example:
- Prometheus uses PromQL.
- Loki uses LogQL.
- SQL databases use SQL.
- Elasticsearch uses Elasticsearch query workflows.
- Tracing backends may use their own query models.
This flexibility is useful for teams with an open observability stack. But as more backends are added, teams may also deal with query-language sprawl.
Datadog query workflows are platform-centered
Datadog keeps more workflows inside its own platform. Metrics, logs, traces, dashboards, monitors, and analytics use Datadog-native workflows instead of requiring teams to stitch together multiple external query systems.
This can make the experience more consistent for teams already committed to Datadog. But it can also make the stack less portable for teams that want more control over storage, query layers, or long-term telemetry architecture.
The practical difference
A simple way to think about Grafana vs Datadog is this:
- Choose Grafana when you want flexibility, backend choice, and custom dashboards across multiple sources.
- Choose Datadog when you want a managed observability suite with more workflows available out of the box.
But there is a third question teams should ask: do they need another dashboard layer, a managed vendor suite, or a more unified telemetry backend?
That question becomes important once logs, metrics, and traces start spreading across too many systems. This is where Parseable becomes relevant later in the comparison.
If Grafana feels flexible but fragmented, and Datadog feels convenient but costly, Parseable gives teams one telemetry backend for logs, metrics, and traces. Sign up for Parseable.
A better long-term observability layer: Parseable
Grafana and Datadog solve observability from two different directions.
Grafana gives teams flexibility. It works well when teams want to connect multiple data sources, keep control over their backend choices, and build custom dashboards across metrics, logs, traces, cloud data, and databases.
Datadog gives teams convenience. It works well when teams want a managed observability suite with infrastructure monitoring, logs, APM, traces, dashboards, monitors, and integrations already built into one vendor platform.
Parseable fits when the team wants a third path: unified telemetry without the backend sprawl of a fully composable stack or the cost and lock-in concerns of a closed observability suite.
Bring logs, metrics, and traces into one platform
A common Grafana setup may include Prometheus for metrics, Loki for logs, Tempo or Jaeger for traces, and Grafana for dashboards. A Datadog setup brings many of those workflows into one managed platform, but the data and workflows stay inside Datadog’s ecosystem.
Parseable gives teams a unified telemetry layer for logs, metrics, and traces. Instead of maintaining a separate backend for every signal, teams can send telemetry into Parseable and use one platform for storage, querying, dashboards, alerts, anomaly detection, and AI-assisted investigation.
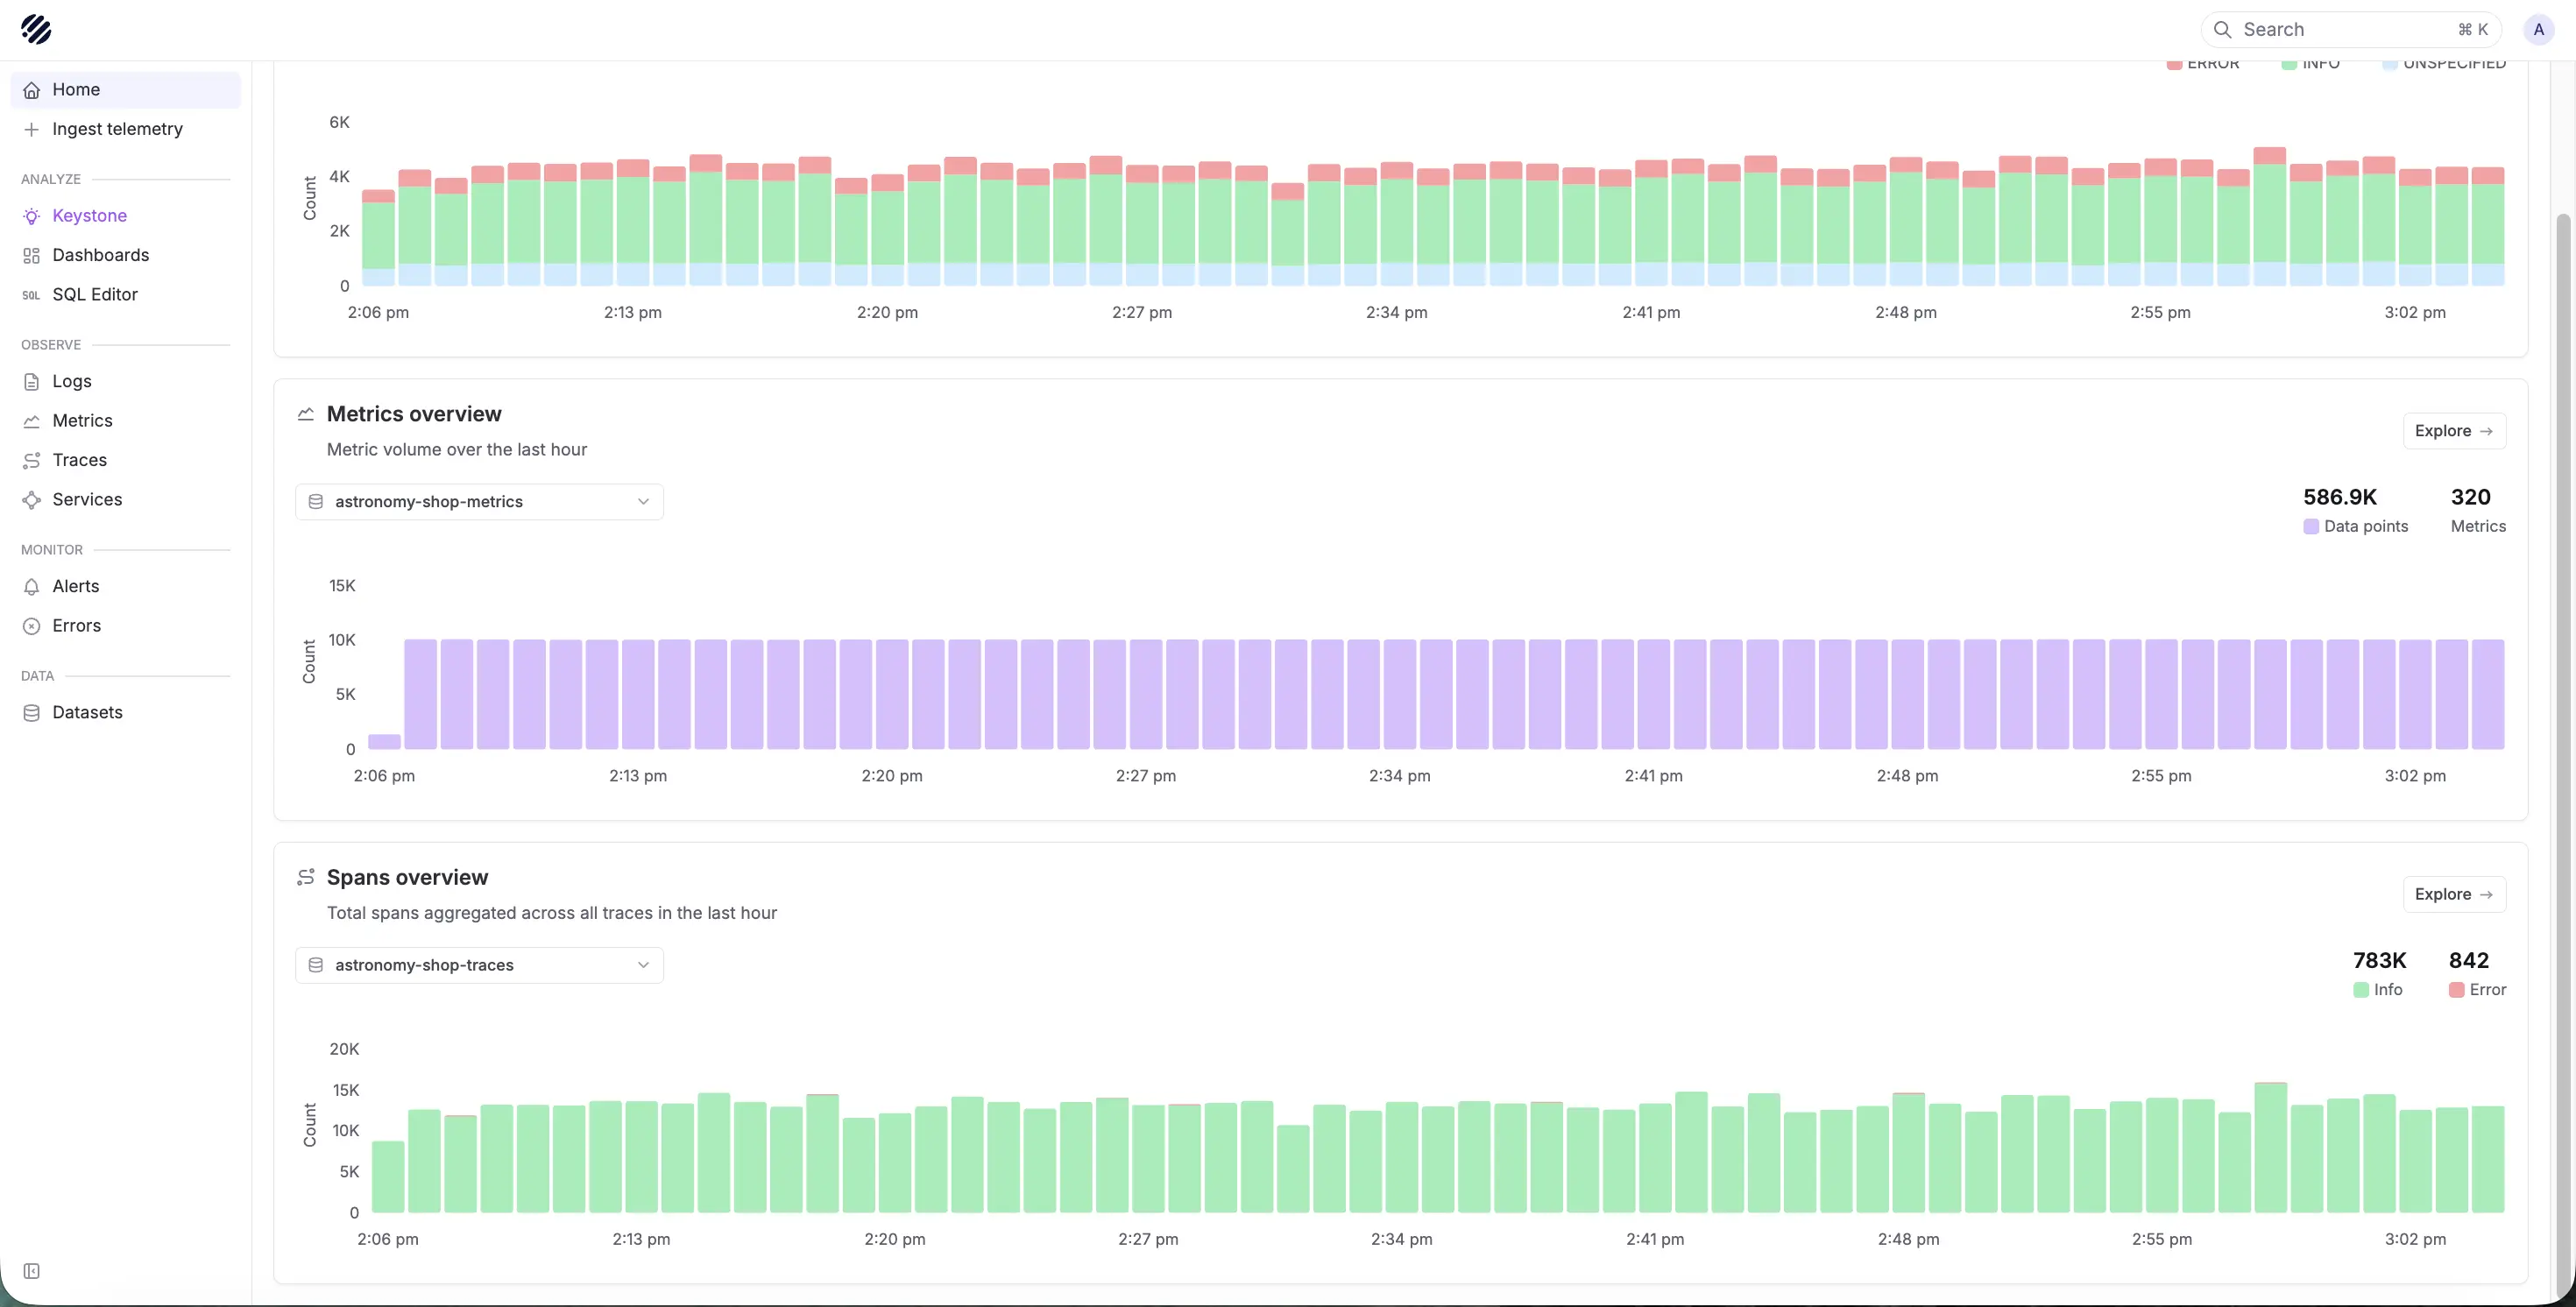
This makes Parseable useful when the real problem is not dashboarding alone. The bigger problem is keeping telemetry connected after the dashboard shows something is wrong.
Query telemetry with SQL and PromQL
Grafana query workflows depend on the connected backend. Teams may use PromQL for Prometheus, LogQL for Loki, SQL for databases, and separate query models for traces or Elasticsearch.
Datadog keeps more query workflows inside its own platform, which can be convenient, but also makes teams more dependent on Datadog’s query model and ecosystem.
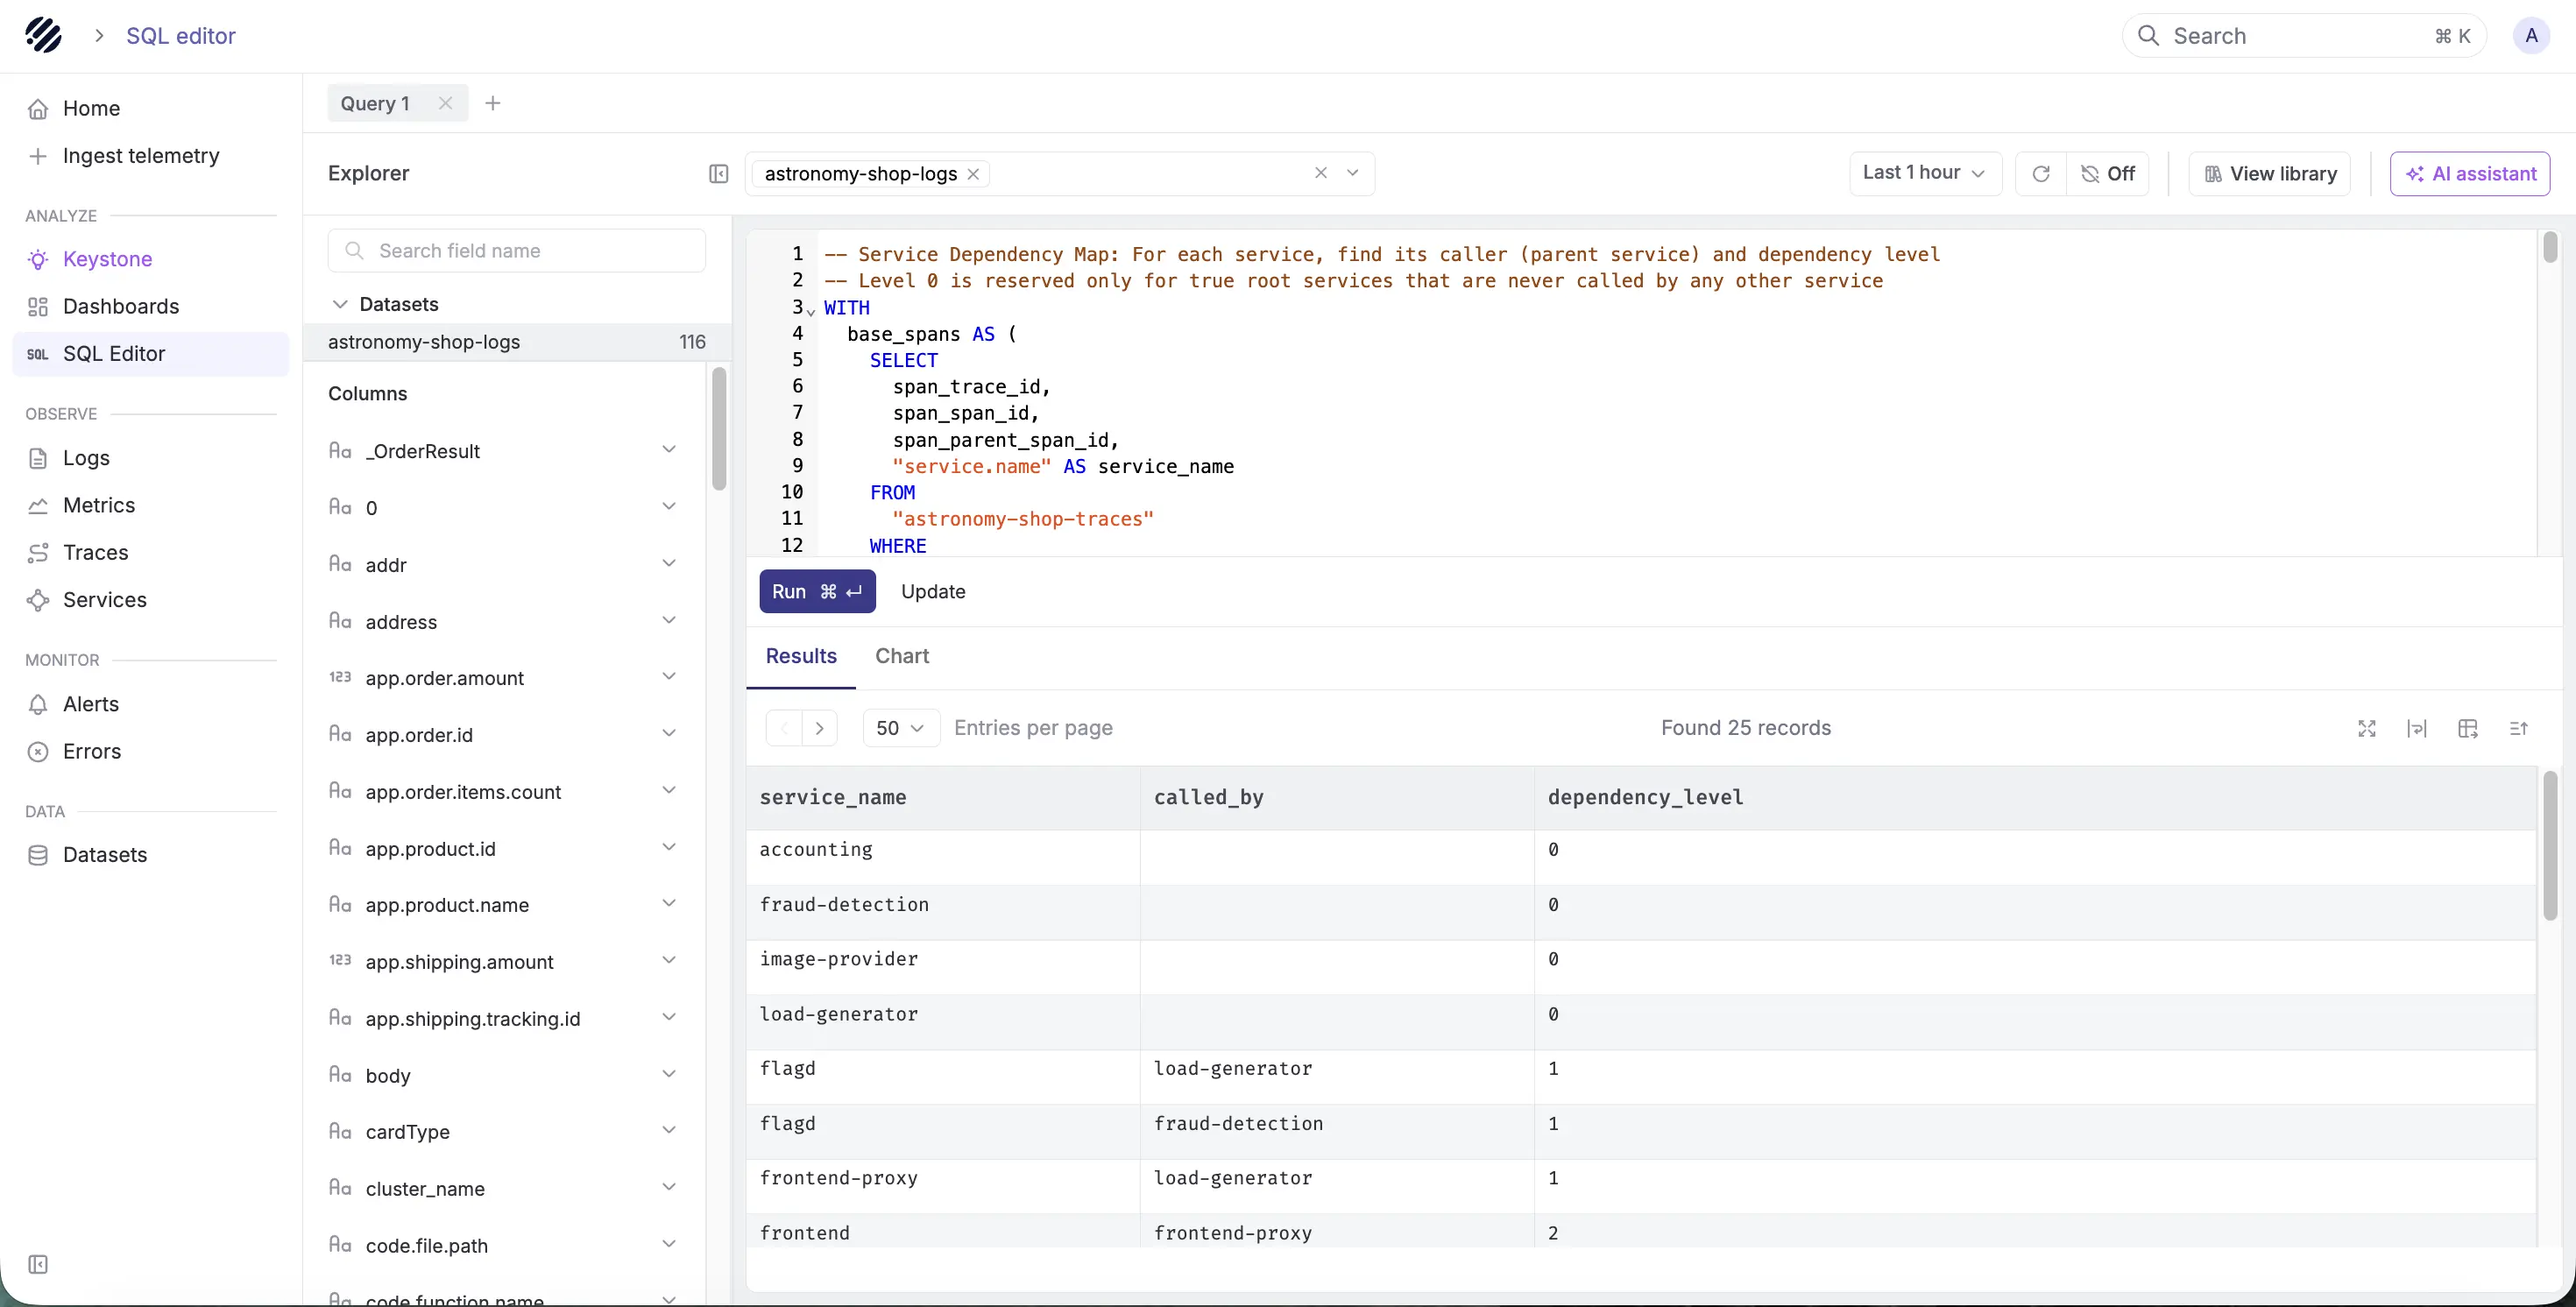
Parseable supports both SQL and PromQL. Teams can use PromQL for metrics workflows and SQL for logs, traces, events, and deeper telemetry analysis. That gives engineers familiar query models without forcing every investigation into a single proprietary workflow.
This is especially useful during incidents. A metric can show the symptom, but the root cause may live in logs, traces, deployment events, or high-cardinality fields. Parseable keeps those signals closer together.
Use AI-assisted investigation when speed matters
During an incident, engineers often know the question they want to ask, but not always the exact query syntax they need.
Parseable’s AI-assisted workflows help teams move from a natural language question to a query or dashboard faster. For example
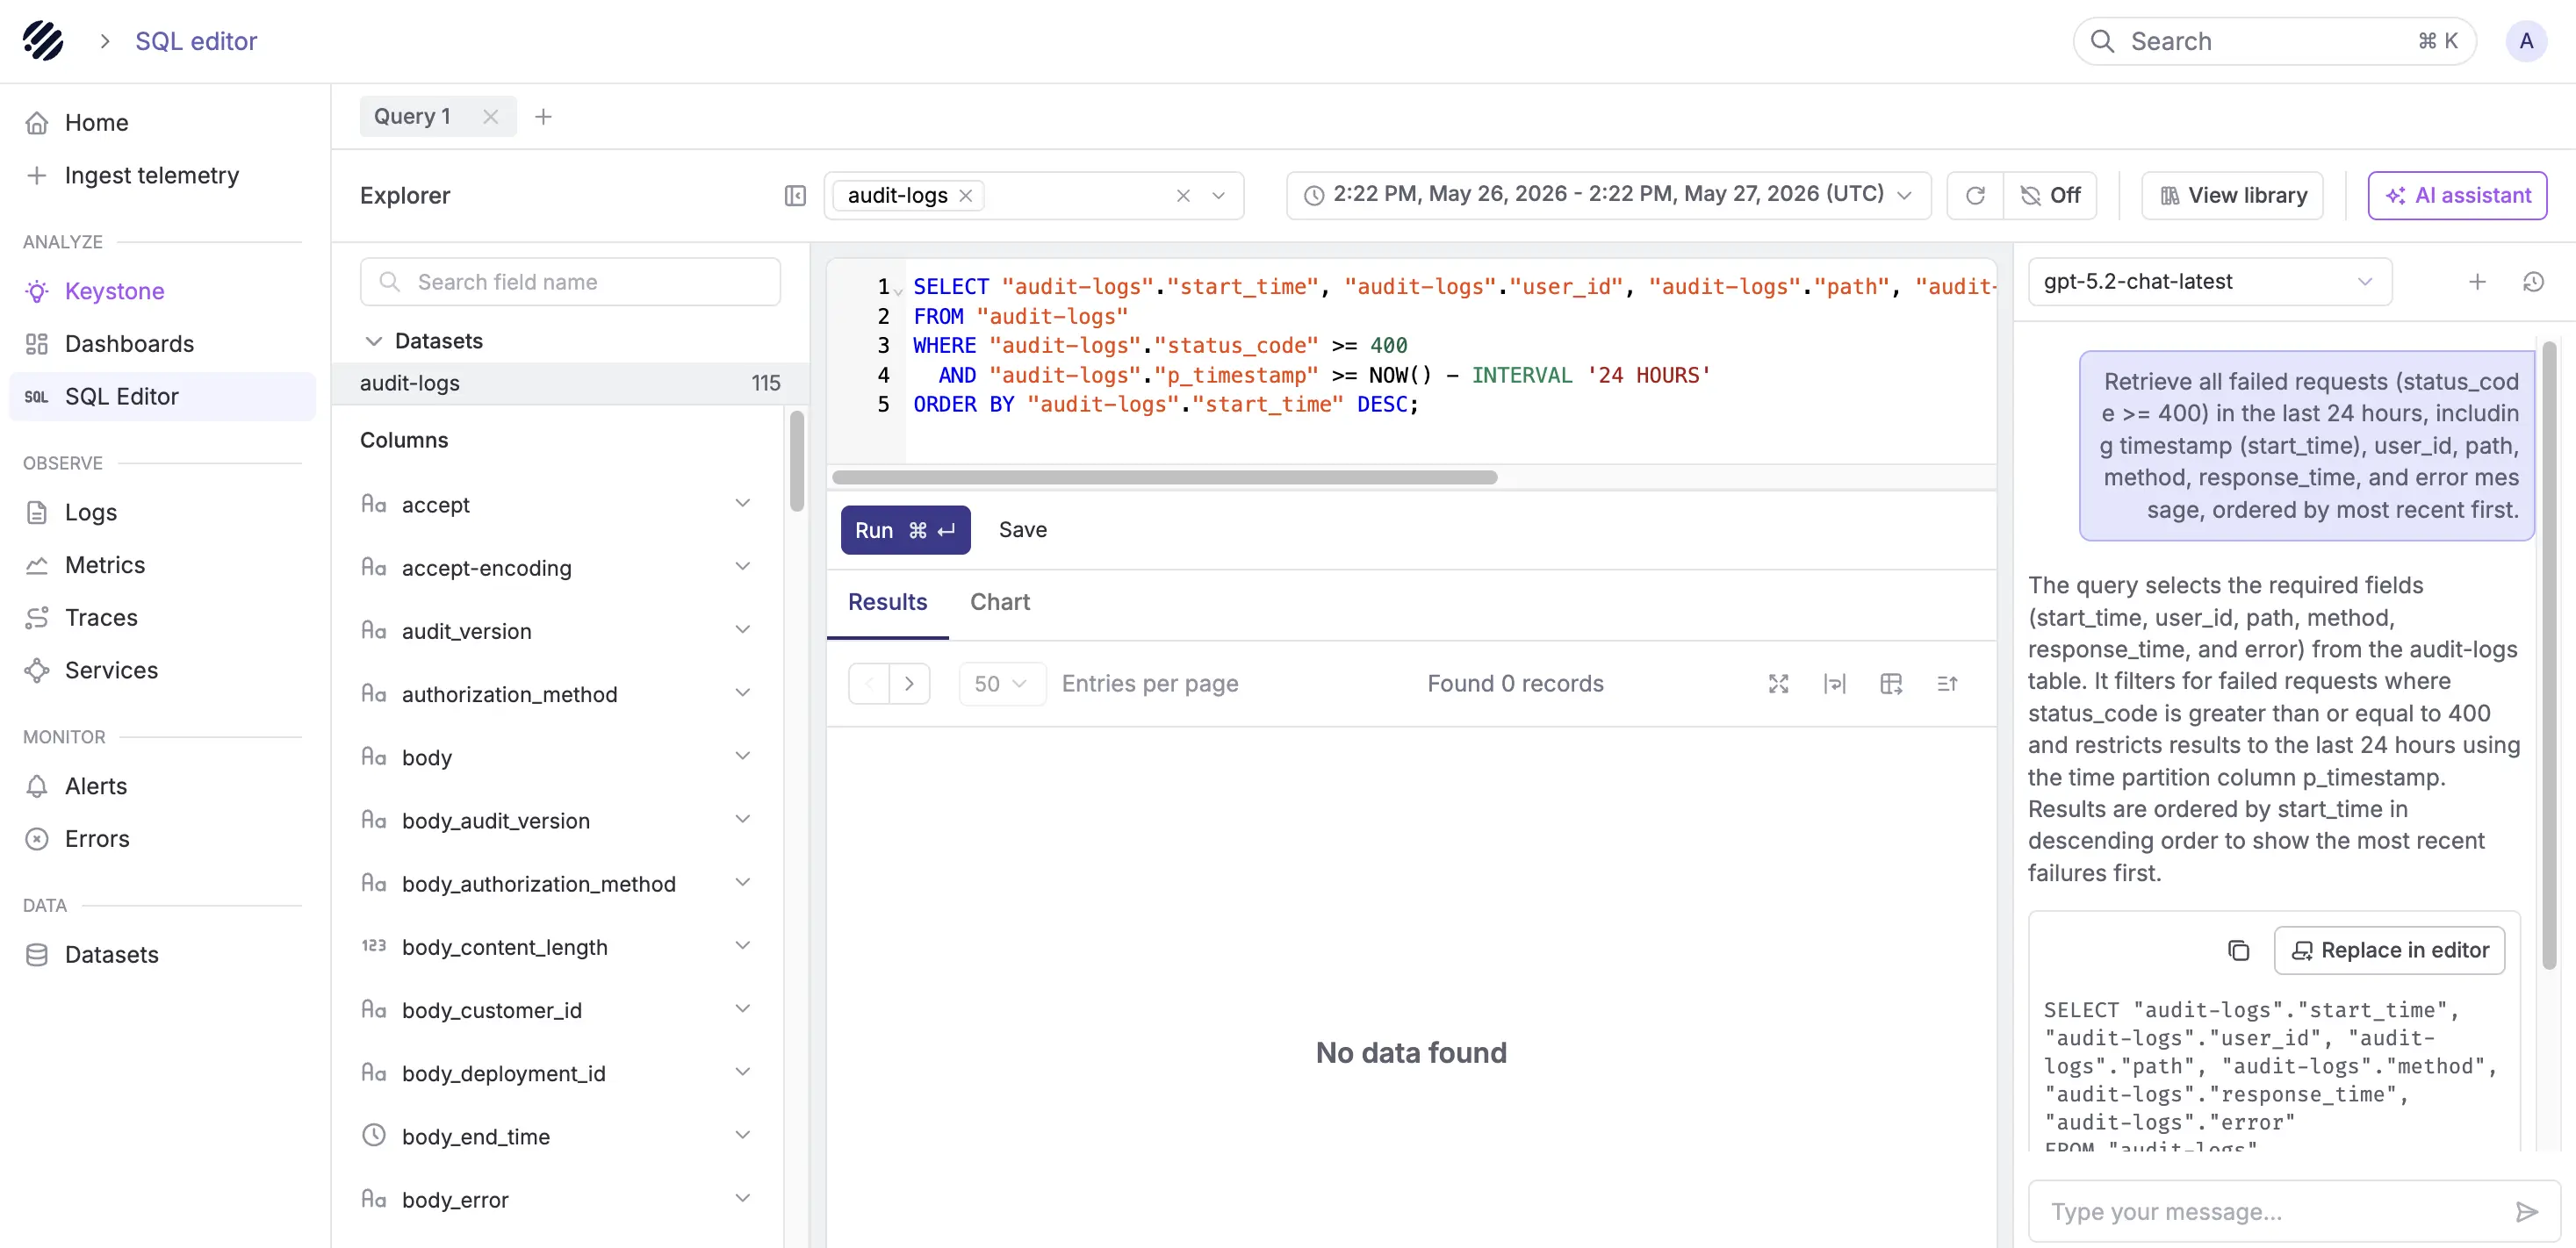
This matters when teams are under pressure. Instead of switching between dashboards, query languages, and disconnected tools, engineers can move faster from question to evidence.
Keep Grafana where it already works
Parseable does not need to replace Grafana in every workflow.
If a team already has mature Grafana dashboards, they can keep them. Grafana can remain the visualization layer where it already works, while Parseable becomes the telemetry backend underneath for logs, metrics, traces, SQL, PromQL, alerts, and investigation workflows through its Grafana integration.
That is a cleaner way to think about the Grafana vs Datadog decision. Teams do not always need to choose between a flexible dashboarding layer and a managed vendor suite. They can keep the dashboard workflows that work and simplify the telemetry layer behind them.
Use Parseable when Datadog cost or lock-in becomes a concern
Datadog is strong when teams want managed observability with less setup. But as teams ingest more logs, add more hosts, expand APM usage, retain more telemetry, and enable more product modules, the cost model can become harder to predict. This is why teams often evaluate Datadog log management cost before expanding usage.
Parseable is a better fit when teams want more control over telemetry storage, retention, and query flexibility. It stores telemetry in Apache Parquet on object storage, which gives teams a more open foundation for long-term observability data.
This does not mean Datadog is the wrong choice. It means Parseable makes more sense when teams want unified observability without making every telemetry workflow dependent on one vendor’s data model and pricing structure.
When Parseable makes more sense
Use Parseable when:
- Logs, metrics, and traces need to stay connected.
- The team wants SQL and PromQL on the same platform.
- Engineers need faster investigation with AI-assisted querying.
- Long-term telemetry retention matters.
- The organization wants fewer separate observability backends.
- Grafana dashboards are useful, but the backend underneath is becoming fragmented.
- Datadog is convenient, but pricing or vendor lock-in is becoming a concern.
Grafana is strong for flexible dashboards. Datadog is strong for managed full-stack observability. Parseable is stronger when teams want a unified telemetry layer that keeps logs, metrics, and traces queryable, connected, and easier to operate over time.
Keep the dashboards that work, but simplify the telemetry layer underneath. Parseable gives teams unified logs, metrics, traces, SQL, PromQL, dashboards, alerts, anomaly detection, and AI-assisted investigation in one platform. Sign up for Parseable.
Grafana vs Datadog vs Parseable
Grafana, Datadog, and Parseable solve different parts of the observability problem.
Grafana is strongest when teams want flexible dashboards across many data sources.
Datadog is strongest when teams want a managed observability suite with built-in monitoring workflows.
Parseable is strongest when teams want logs, metrics, and traces in one telemetry layer with SQL, PromQL, dashboards, alerts, and AI-assisted investigation.
| Category | Grafana | Datadog | Parseable |
|---|---|---|---|
| Primary role | Visualization, dashboards, alerting, and exploration | Managed full-stack observability platform | Unified telemetry backend and observability platform |
| Operating model | Flexible and composable | Integrated and vendor-managed | Unified and object-storage-first |
| Main signals | Depends on connected data sources | Metrics, logs, traces, APM, RUM, synthetics, infrastructure, and security workflows | Logs, metrics, and traces |
| Data source model | Connects to external backends such as Prometheus, Loki, Tempo, Elasticsearch, CloudWatch, and SQL databases | Collects telemetry into Datadog through agents, integrations, APIs, and product workflows | Ingests telemetry into one platform for storage, querying, dashboards, and alerts |
| Query model | Depends on the connected data source | Datadog-native query and analytics workflows | SQL, PromQL, and plain-English querying |
| Dashboards | Strong and highly customizable | Strong inside Datadog workflows | Built in, and can also work with Grafana |
| Metrics | Strong with Prometheus and time-series sources | Built-in infrastructure and custom metrics workflows | PromQL-based metrics with logs and traces connected |
| Logs | Depends on the connected log backend | Built-in log management and analytics | SQL-based log analysis on unified telemetry |
| Traces and APM | Depends on tracing backends such as Tempo, Jaeger, Zipkin, or other sources | Built-in APM and distributed tracing | Traces connected with logs and metrics |
| Alerting | Strong across connected data sources | Built-in monitors and notification workflows | Built-in alerts and anomaly detection |
| Cost model | Depends on OSS, Grafana Cloud, and connected backends | Modular pricing across Datadog products | Unified telemetry platform with object-storage-first retention |
| Best fit | Teams that want dashboard flexibility and backend choice | Teams that want managed observability with less setup | Teams that want unified telemetry, SQL, PromQL, and fewer backends |
Choose Parseable when the team wants to simplify the telemetry layer itself, especially when logs, metrics, and traces need to stay connected for long-term investigation.
Conclusion
Grafana and Datadog are both strong observability tools, but they solve the problem in different ways.
Grafana is the better fit when teams want flexibility, backend choice, and customizable dashboards across multiple data sources.
Datadog is the better fit when teams want a managed observability suite with infrastructure monitoring, logs, traces, APM, dashboards, monitors, and integrations available inside one platform.
The real Grafana vs Datadog decision comes down to what your team values more: control or convenience. Grafana gives teams more control over the backend stack. Datadog gives teams more out-of-the-box workflows.
But if the bigger problem is fragmented telemetry, rising observability costs, or disconnected logs, metrics, and traces, Parseable gives teams a cleaner long-term path. It brings logs, metrics, and traces into one telemetry layer with SQL, PromQL, dashboards, alerts, anomaly detection, and AI-assisted investigation.
If your team is comparing Grafana and Datadog because your observability stack is becoming harder to operate or harder to predict, Parseable gives you a more unified backend for production telemetry. Sign up for Parseable to keep logs, metrics, and traces connected in one platform.

