
There is a small moment most teams hit after they start sending traces. The traces are useful. You can open one request, follow it across services, and see exactly where time was spent. But when someone asks a much simpler question like "is checkout slower than usual" or "are errors increasing on this route", opening traces one by one is the wrong shape of work.
For that, you want metrics. The interesting thing is that the information needed for those metrics is already present in the spans. A server span already knows when it started, when it ended, which service created it, what the operation was called, and whether it ended in an error.
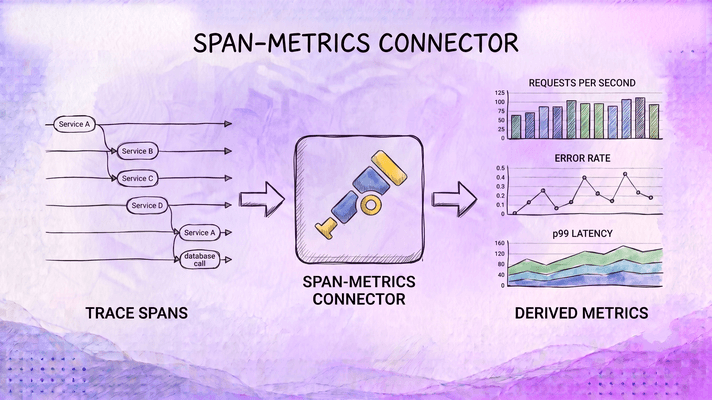
The OpenTelemetry span_metrics connector exists for this exact middle ground. It lets you keep traces as traces, but also derive service-level metrics from those spans inside the Collector. So the workflow becomes simple. Use metrics to notice that something is off. Use traces to explain the actual request path behind it.
For the pipeline model behind this connector, start with the OpenTelemetry Collector guide. This article stays focused on turning spans into metrics.
Why traces alone are not enough
Traces are built for detail. A single trace can show a request moving from frontend to checkout, then to payment, then to a database call, then back again. When something fails, that detail is exactly what you want. But dashboards and alerts usually need something more compact. They need stable time series.
For example:
request count by service and route
error count by service and route
p95 latency by service and route
You can instrument these metrics directly in every service, and sometimes that is still the right answer. Business metrics like orders_created, payments_authorized, or tokens_generated should usually be emitted as real application metrics. But RED metrics are often already implied by your spans. If every service is already producing OpenTelemetry traces, it feels wasteful to maintain a second layer of custom instrumentation just to count the same request activity again.
That is where span-derived metrics are useful. They do not replace traces. They give you a metric view over trace activity.
What span_metrics actually creates
The upstream OpenTelemetry Collector component is called span_metrics. The older spanmetrics name still works today, but it is deprecated. New configs should use span_metrics.
The connector sits between a traces pipeline and a metrics pipeline.
traces pipeline
  -> span_metrics
  -> metrics pipeline
In Collector language, it behaves like an exporter for traces and a receiver for metrics. That sounds a little odd the first time you see it, but it is the right mental model. The traces pipeline exports spans into the connector. The metrics pipeline receives the metrics produced by the connector.
By default, the connector generates metrics like:
traces.span.metrics.calls
traces.span.metrics.duration
calls is a count of spans grouped by dimensions. Errors are represented through the status dimension, so an error span contributes to the same call metric shape with an error status. duration is a histogram built from the span start and end time.
The generated metrics include common dimensions such as service.name, span.name, span.kind, and status.code. Recent versions also add collector.instance.id by default to help avoid single-writer problems when more than one Collector instance is producing the same metric stream.
This is important because span metrics are not just "free metrics". They are real metrics with real dimensions. If those dimensions are stable, the result is clean. If those dimensions contain user IDs, raw URLs, or random values, the result can get noisy very quickly.
The Collector pipeline shape
The clean setup is to send two things out of the Collector. The original spans should still go to your traces backend. The generated span metrics should go to your metrics backend. They describe the same traffic, but they are not the same signal.
application services
  -> OpenTelemetry Collector
      -> traces backend
      -> span_metrics connector
      -> metrics backend
This keeps the data easy to reason about. Traces stay useful for request-level debugging. Metrics become the place where you graph request volume, errors, and latency. Here is the Collector shape without tying it to any backend yet:
receivers:
  otlp:
    protocols:
      grpc:
        endpoint: 0.0.0.0:4317
      http:
        endpoint: 0.0.0.0:4318

processors:
  batch:
    timeout: 5s
    send_batch_size: 1000

connectors:
  span_metrics:
    namespace: traces.span.metrics
    histogram:
      unit: ms
      explicit:
        buckets: [5ms, 10ms, 25ms, 50ms, 100ms, 250ms, 500ms, 1s, 2s, 5s]
    dimensions:
      - name: http.request.method
      - name: http.route
      - name: rpc.service
      - name: db.system.name
    aggregation_cardinality_limit: 10000
    metrics_flush_interval: 30s
    series_expiration: 10m

exporters:
  debug/traces:
    verbosity: basic

  debug/spanmetrics:
    verbosity: basic

service:
  pipelines:
    traces:
      receivers: [otlp]
      processors: [batch]
      exporters: [debug/traces, span_metrics]

    metrics/spanmetrics:
      receivers: [span_metrics]
      processors: [batch]
      exporters: [debug/spanmetrics]
There are two details worth calling out. First, the traces pipeline exports to both a trace exporter and span_metrics. That means the original traces continue down the normal trace path, and the connector also receives a copy of the spans to aggregate. Second, the metrics/spanmetrics pipeline starts with span_metrics as a receiver. That is how the generated metrics leave the connector and move toward your metrics backend.
If you are running your own Collector build, make sure the distribution includes the contrib connector. The component lives in opentelemetry-collector-contrib, so a minimal core Collector build may not include it.
Reading the generated metrics
Once the pipeline is running, look at the metrics emitted by the connector. You should see metrics such as:
traces.span.metrics.calls
traces.span.metrics.duration
The useful view is usually not the raw metric name alone. It is the metric grouped by a small set of dimensions like service.name, span.name, http.route, span.kind, and status.code.
For example, you can use the generated metrics to answer questions like:
Which service is receiving the most requests
Which route has the highest error count
Which operation has the slowest p95 duration
Then, when a metric points to a problem, move to your traces backend. If checkout has a rising p95 duration, open traces for the same service and route. If one endpoint starts producing more errors, inspect the failing spans behind that endpoint. That is the main value of this pattern. Metrics give you the shape of the problem. Traces give you the request-level explanation.
Cardinality is the real tradeoff
The connector helps with high-cardinality trace data, but it does not make high cardinality disappear. It helps because you can choose which span attributes become metric dimensions. Instead of trying to query every span directly for every dashboard, you can aggregate the useful parts into a smaller metric shape. But if you choose bad dimensions, the connector will faithfully create bad metrics.
Good dimensions usually describe a class of work:
service.name
span.name
span.kind
status.code
http.request.method
http.route
rpc.service
db.system.name
Risky dimensions usually describe one request, one user, or one payload:
http.url
url.full
user.id
session.id
trace_id
request_id
db.statement
The difference is easy to see. http.route should look like /users/{id}. url.full may look like /users/891723?token=.... The first one is a route pattern. The second one is a new time series waiting to happen.
aggregation_cardinality_limit is useful as a safety rail. When the limit is reached, additional unique dimension combinations are dropped into an overflow series with otel.metric.overflow="true". That protects the Collector from unbounded growth, but it is not the real fix. The real fix is to keep dimensions boring and normalize span names before aggregation.
When these generated metrics are sent to Prometheus, the Prometheus cardinality runbook shows how to identify which metric and dimension combinations are creating the most series.
Normalize before the connector
High-cardinality span names are a common source of bad span metrics. This is not a good span name for aggregation:
GET /orders/83910291This is better:
GET /orders/{orderId}Ideally, this should be fixed in application instrumentation. The service knows its routes better than the Collector does. But in real systems, instrumentation is often mixed. Some services use mature framework instrumentation. Some use custom middleware. Some emit whatever was convenient during the first rollout.
In that case, the Collector can help as an intermediate layer. You can use the transform processor before span_metrics to set route attributes and then ask the Collector to build semantic-convention span names.
processors:
  transform/normalize_span_names:
    error_mode: ignore
    trace_statements:
      - context: span
        statements:
          - set(span.attributes["http.route"], "/orders/{orderId}") where span.attributes["http.route"] == nil and span.attributes["url.path"] != nil and IsMatch(span.attributes["url.path"], "^/orders/[^/]+$")
          - set_semconv_span_name("1.37.0", "original.span.name")
Then put that processor before the connector:
service:
  pipelines:
    traces:
      receivers: [otlp]
      processors: [transform/normalize_span_names, batch]
      exporters: [otlp/traces_backend, span_metrics]
This is not something to apply blindly. If a span does not have enough route information, aggressive normalization can collapse useful operations into names like GET and POST. Start with the routes that matter most, check the generated metric labels, and then expand.
Sampling changes the answer
There is one production detail that is easy to miss. The connector can only count the spans it sees. If traces are sampled before they reach span_metrics, the generated RED metrics are based on sampled spans. That might be acceptable for some exploratory dashboards, but it is usually not what you want for request and error counts.
If you want span metrics to represent all traffic, run the connector before sampling or before any processor that drops spans.
The usual shape is:
receive spans
  -> normalize span names
  -> span_metrics connector
  -> sampling for trace storage
  -> trace exporter
The exact pipeline depends on your Collector design. The principle is simple enough: aggregate before dropping data if you want the aggregate to represent the full stream.
What to check before production
Before you ship this into a real environment, check a few things. Use span_metrics, not the deprecated spanmetrics component name. Set the duration unit intentionally. Current configs often use ms, while the upstream connector is moving toward seconds as the default for semantic convention alignment. If your dashboards expect milliseconds, set unit: ms. If your team wants seconds, set unit: s. The worst option is not knowing which one your charts assume.
Keep the dimension list small at first. Start with service, span name, span kind, status, method, and route. Add more only when a dashboard or alert really needs it. Check for otel.metric.overflow="true" after enabling aggregation_cardinality_limit. If it appears often, you still have a cardinality problem upstream. Keep traces and span metrics separate. This makes it much easier to explore raw spans and derived metrics without mixing two different shapes of data.
Sending traces and span metrics to Parseable
Once the connector pipeline is clear, sending the data to Parseable is mostly an exporter change. The original traces can go to a traces dataset such as app-traces. The generated span metrics can go to a metrics dataset such as app-spanmetrics.
exporters:
  otlphttp/parseable_traces:
    traces_endpoint: "${env:PARSEABLE_URL}/v1/traces"
    encoding: json
    headers:
      X-API-Key: "${env:PARSEABLE_API_KEY}"
      X-P-Stream: "app-traces"
      X-P-Log-Source: "otel-traces"
      Content-Type: "application/json"

  otlphttp/parseable_spanmetrics:
    metrics_endpoint: "${env:PARSEABLE_URL}/v1/metrics"
    encoding: json
    headers:
      X-API-Key: "${env:PARSEABLE_API_KEY}"
      X-P-Stream: "app-spanmetrics"
      X-P-Log-Source: "otel-metrics"
      Content-Type: "application/json"

service:
  pipelines:
    traces:
      receivers: [otlp]
      processors: [batch]
      exporters: [otlphttp/parseable_traces, span_metrics]

    metrics/spanmetrics:
      receivers: [span_metrics]
      processors: [batch]
      exporters: [otlphttp/parseable_spanmetrics]
After this, use the traces dataset when you want to inspect individual requests. Use the span metrics dataset when you want charts, PromQL queries, or alerts over request volume, errors, and duration.
Conclusion
The span_metrics connector is useful because it turns trace activity into a metric view without asking every service team to write the same request, error, and duration metrics by hand. It is not a shortcut around good instrumentation. Span names still need to be low-cardinality. Route attributes still need to be clean. Sampling still changes what the connector can count. But with those basics in place, it becomes a very practical bridge between tracing and metrics.
The backend is only the last step. The important part is getting the pipeline shape right: keep the traces, derive the metrics, control the dimensions, and understand where sampling happens.
