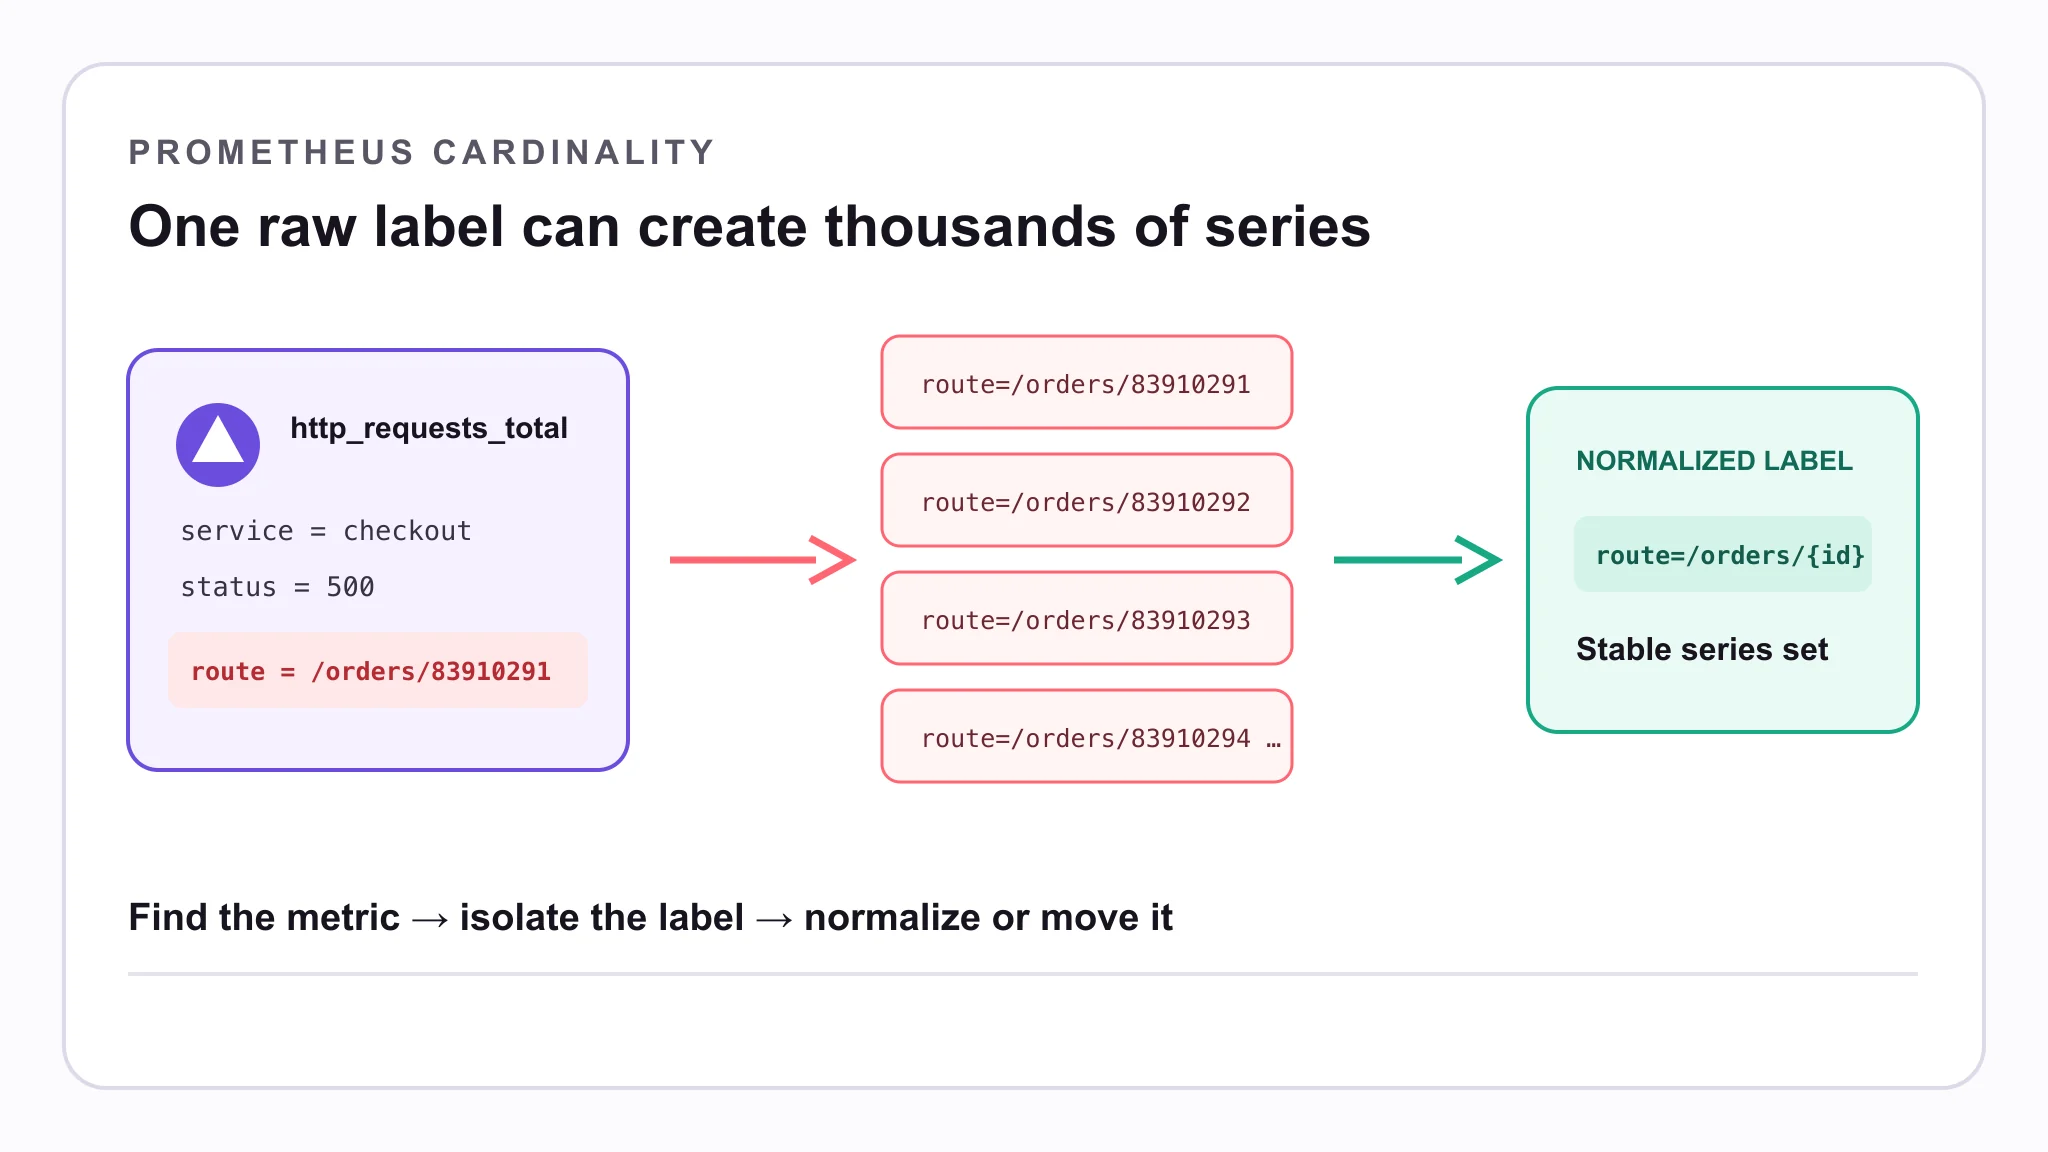
The first sign of a Prometheus cardinality problem often appears after an ordinary deployment. Traffic stays flat, but prometheus_tsdb_head_series climbs. Dashboards become slower, memory use rises and a scrape that used to be harmless starts producing far more series.
The cause may be one new label. A raw route, pod name, customer ID or build SHA can multiply a metric into thousands of distinct label sets. Finding that label is more useful than guessing at a universal series limit.
Follow the investigation from the Prometheus head series count to the offending metric and label, then fix the source and verify the result.
In this guide
- What Prometheus cardinality means
- How to check whether cardinality is the problem
- How to find high-cardinality metrics
- How to find the label causing growth
- How to reduce Prometheus cardinality
- How to verify a cardinality change
- What Prometheus cardinality limit to use
- How to measure cardinality in Parseable
What is Prometheus cardinality?
In Prometheus, every unique combination of a metric name and its label values is a separate time series.
These samples belong to different series because the pod value changes:
http_requests_total{service="checkout",route="/orders/{id}",pod="checkout-7d9bc6-zk8wl"}
http_requests_total{service="checkout",route="/orders/{id}",pod="checkout-86bd74-n2r7p"}
If the metric has 10 services, 50 routes, 5 status classes and 4,000 observed pods, its theoretical upper bound is:
10 × 50 × 5 × 4,000 = 10,000,000 label combinationsPrometheus creates only the combinations that occur, so this multiplication is an upper bound rather than a prediction. It still explains why one unbounded label can produce sudden series growth.
Cardinality can refer to two related measurements:
- Series cardinality: the number of unique complete label sets for a metric.
- Label cardinality: the number of distinct values observed for one label, such as
podoruser_id.
The distinction matters during diagnosis. A label with many values is a suspect, but the complete label combinations determine the number of time series. The broader guide to what high cardinality means covers this distinction across metrics, logs and traces.
Cardinality, churn and sample volume are different
| Measurement | What increases it | What it affects |
|---|---|---|
| Active-series cardinality | More unique metric-name and label-value combinations | Head memory, indexes and query matching |
| Series churn | Labels such as pod names or build IDs changing over time | Ingestion, indexes, compaction and cache efficiency |
| Sample volume | More series or a shorter scrape interval | Ingest throughput, storage and scan work |
Changing the scrape interval reduces sample volume but does not reduce the number of active label sets. Reducing histogram buckets can reduce both series and samples because each classic histogram bucket is a separate series. Diagnose the measurement that is growing before choosing a fix.
Check whether cardinality is the problem
Start with the current number of series in the Prometheus head block:
prometheus_tsdb_head_seriesGraph it beside request traffic, scrape targets and process memory. If active series rise while the workload stays roughly stable, investigate labels introduced by recent deployments or instrumentation changes.
The number needs context. Stopped series can remain in the head block for a while, and a rollout can create new pod or version labels before the old series disappear. Look at the trend across a comparable traffic window rather than treating one reading as a verdict.
Use the TSDB status API
Prometheus exposes built-in cardinality statistics through its TSDB status endpoint:
curl -s 'http://localhost:9090/api/v1/status/tsdb?limit=20' | jq '.data'The response includes:
headStats.numSeriesfor the current head series countseriesCountByMetricNamefor metrics producing the most serieslabelValueCountByLabelNamefor labels with many distinct valuesseriesCountByLabelValuePairfor expensive label-value pairsmemoryInBytesByLabelNamefor estimated memory grouped by label name
Use this endpoint before running unrestricted PromQL across the entire index. It identifies where to look without making a server under pressure aggregate every series.
Analyze a local TSDB block with promtool
For an offline block or a local Prometheus data directory, use promtool tsdb analyze:
promtool tsdb analyze --limit=20 /path/to/prometheus/dataAdd --extended for more detail or --match='{job="checkout"}' to narrow the analysis. The command helps inspect label-pair cardinality, churn and block compaction without placing another broad query on the running server.
Find the metrics creating the most series
If the TSDB status endpoint is unavailable or you want the result in a dashboard, rank metric names by the series they currently match:
topk(20, count by (__name__) ({__name__!=""}))This query is useful, but it is broad. On a large Prometheus server, scope it to a job, namespace or metric prefix:
topk(
  20,
  count by (__name__) (
    {job="kubernetes-pods", namespace="payments", __name__=~"http_.*"}
  )
)
The result counts series matched at evaluation time. It does not count every series ever observed. Run the same query over comparable deployments when you want to measure change.
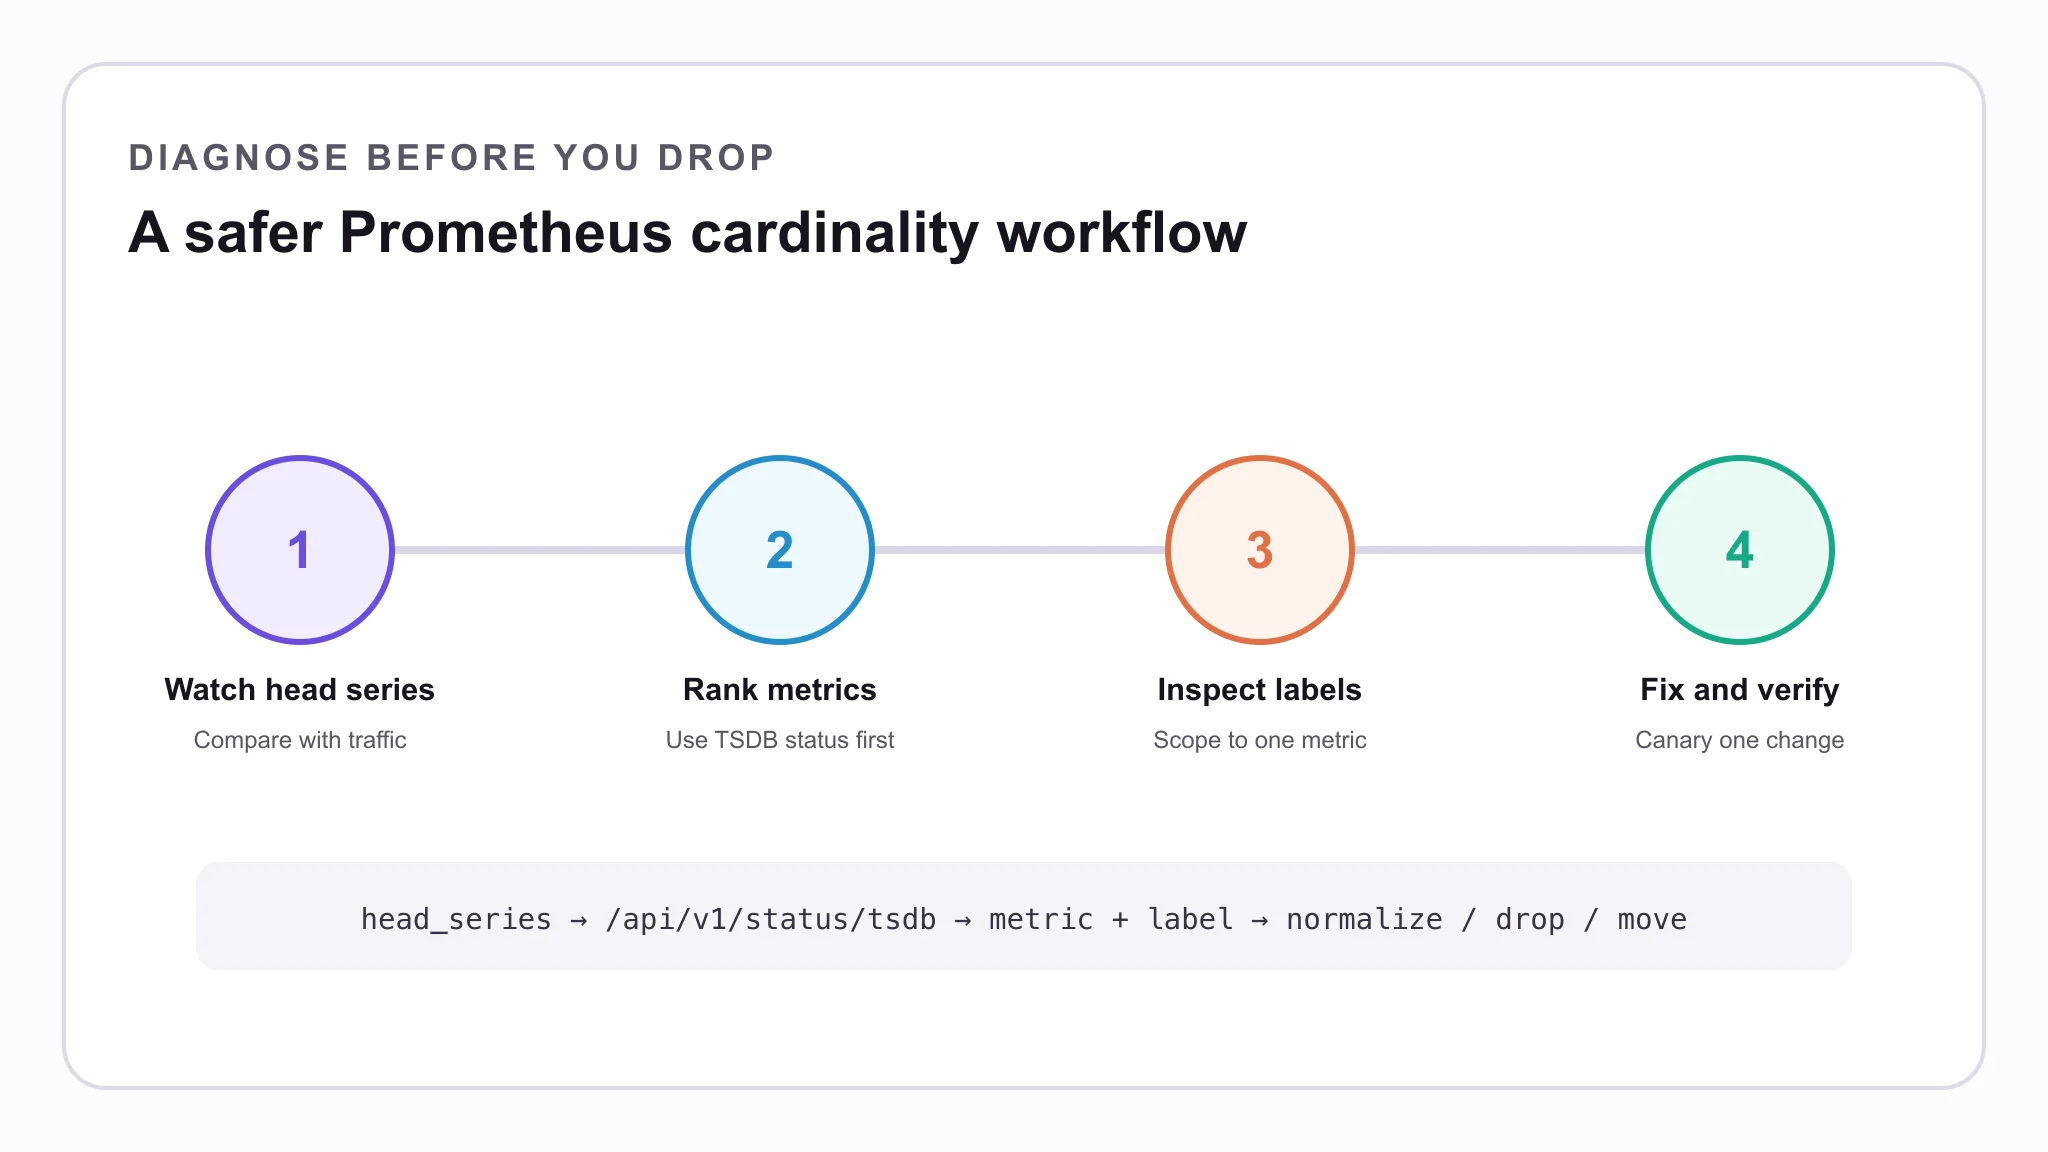
Once one metric family stands out, stop querying the whole index. Keep the rest of the investigation scoped to that metric.
Find the label causing cardinality growth
Assume http_requests_total is producing far more series than expected. Count the distinct values of a suspected label:
count(
  count by (pod) (
    http_requests_total{pod!=""}
  )
)
Repeat the query for route, instance, version or another candidate label. You can also find which values create the most combinations:
topk(
  20,
  count by (route) (
    http_requests_total{route!=""}
  )
)
A label with many values may still be useful. A pod label can isolate a failing replica, and a release label can separate a bad rollout. Check whether engineers aggregate by the label and whether its value set remains bounded enough for the Prometheus deployment.
Raw identifiers deserve closer inspection:
# Unbounded: every order creates another route value
route="/orders/83910291"

# Bounded: all order requests share a route template
route="/orders/{orderId}"
User IDs, request IDs, session IDs, timestamps, raw URLs and UUIDs rarely belong in metric labels. Keep them in logs or traces when they are needed for an exact lookup.
Choose the right cardinality fix
The safest fix is the earliest one in the telemetry path. Correct instrumentation before relying on Prometheus to discard data it has already received.
| Cause | Best first action | What it changes |
|---|---|---|
| Raw route or request identifier | Normalize or remove it in application instrumentation | Prevents the series from being created |
| Unused metric family | Drop it with metric_relabel_configs | Prevents local ingestion after scrape |
| Unused label on scraped metrics | Drop it only after checking series uniqueness | Reduces local series combinations |
| Detail needed only for investigation | Move it to logs or traces | Preserves context outside metric labels |
| Repeated expensive dashboard query | Add a scoped recording rule | Reduces query work, not source cardinality |
| Data unwanted only in remote storage | Use write_relabel_configs | Reduces remote write, not local cardinality |
| Uncontrolled exporter output | Add scrape limits as guardrails | Fails an oversized scrape rather than trimming it |
Fix labels at instrumentation time
Prometheus recommends keeping most metrics to a small, bounded set of label values and avoiding unbounded values such as user IDs or email addresses. Its published numbers are conservative guidelines, not hard server limits: keep most metric cardinality below 10 and investigate metrics that can exceed 100.
Normalize HTTP routes in the application or instrumentation library before export. Remove identifiers that no alert or aggregation uses. If an identifier is useful during an incident, attach it to a log or span and use trace context or exemplars to move from a metric signal to request-level evidence.
For metrics derived from spans, control which attributes become dimensions before aggregation. The OpenTelemetry SpanMetrics Connector guide shows how one raw span name or request attribute can multiply the generated series.
Drop unwanted series during metric relabeling
metric_relabel_configs runs after a target is scraped and before samples enter local storage. It can remove an unwanted metric family:
scrape_configs:
  - job_name: checkout
    static_configs:
      - targets: ["checkout:9090"]
    metric_relabel_configs:
      - source_labels: [__name__]
        regex: "debug_.*"
        action: drop
It can also remove labels:
metric_relabel_configs:
  - regex: "user_id|request_id|session_id"
    action: labeldrop
Use labeldrop carefully. Two formerly distinct samples can collapse into the same label set after a label is removed. Prometheus may then reject them as duplicate samples within the scrape. Confirm that the remaining labels still identify the intended series.
The official Prometheus configuration reference documents when metric relabeling runs and the available relabel actions.
Treat recording rules as a query optimization
A recording rule precomputes a PromQL expression so dashboards and alerts can read a smaller result. For example:
groups:
  - name: cardinality
    rules:
      - record: active_series_per_metric:http_rpc
        expr: |
          label_replace(
            count by (__name__) ({__name__=~"http_.*|rpc_.*"}),
            "metric", "$1", "__name__", "(.*)"
          )
This makes repeated cardinality dashboards cheaper than scanning the entire index each time. It does not remove the original source series or reduce ingestion. Prometheus documents recording-rule syntax and testing in its recording rules guide.
Know what scrape limits do
Prometheus supports sample_limit, label_limit, label_name_length_limit and label_value_length_limit in a scrape configuration. These settings are safety rails. If a target exceeds a configured limit after metric relabeling, the entire scrape is treated as failed.
Do not use them as if Prometheus will retain the first N samples and discard the rest. Alert on prometheus_target_scrapes_exceeded_sample_limit_total and fix the exporter or relabeling rules that caused the failure. The behavior is defined in the official scrape configuration reference.
Separate local ingestion from remote write
write_relabel_configs filters samples before Prometheus sends them to remote storage. It does not undo local ingestion, so it will not reduce prometheus_tsdb_head_series on the Prometheus server.
Use metric relabeling when the data should not enter local storage. Use write relabeling when Prometheus still needs the local series but the remote destination does not.
Measure, change and verify
Cardinality work is safer when one metric family or label changes at a time.
- Record
prometheus_tsdb_head_series, scrape samples, memory use and representative query latency. - Save the TSDB status output and the scoped cardinality queries for the suspected metric.
- Check dashboards, alerts and recording rules for the label or metric you plan to change.
- Fix the instrumentation or relabeling rule.
- Validate the configuration with
promtool check config prometheus.yml. - Deploy to a canary or one scrape job before rolling it out broadly.
- Compare series count, scrape health, memory and query latency over a similar traffic window.
promtool check config verifies syntax and referenced rule files. It cannot tell whether a removed label was useful to an alert or whether the remaining labels preserve series identity. That part still needs a canary and query comparison.
Historical series do not disappear immediately after a label changes. The old and new label sets remain distinct until the old series leave the head block and eventually age out under retention. Expect the graph to converge rather than drop instantly.
What is the Prometheus cardinality limit?
Prometheus has no universal maximum number of active series. The practical limit depends on label length, churn, scrape interval, retention, query patterns, hardware and deployment topology.
Several Prometheus settings contain the word “limit,” but none is a universal active-series ceiling:
| Control | Scope | What happens when it is reached |
|---|---|---|
sample_limit | Samples accepted from one scrape | The complete scrape fails |
label_limit | Labels allowed on one sample | The complete scrape fails |
HTTP API limit | Series or results returned by supported API endpoints | Only the response is limited; stored series remain unchanged |
| Team series budget | An operational threshold chosen for one deployment | Your alert or capacity process decides the response |
A stable million-series workload and a rapidly churning million-series workload do not place the same demand on Prometheus. Broad aggregations over long ranges also behave differently from narrow dashboards even when the stored series count is identical.
Use these signals together:
- head series growth relative to workload growth
- memory use and out-of-memory restarts
- scrape duration, failures and sample-limit events
- dashboard and alert evaluation latency
- rate of new series creation after deployments
- compaction and storage pressure
A round number can help with capacity planning, but symptoms and growth trends tell you when the current architecture is running out of room.
When Prometheus cleanup is not enough
Good instrumentation comes first in every storage architecture. Removing request IDs from metric labels and normalizing routes prevents avoidable work regardless of the backend.
Some teams still need high-cardinality dimensions for historical analysis after that cleanup. A columnar metrics architecture changes where the system pays for those dimensions by storing labels as columns and reading them when a query needs them. The guide to high-cardinality metrics in columnar time-series storage explains the trade-offs, while the production case study shows how Parseable handles around 100 million time series.
Parseable stores metrics, logs and traces in Apache Parquet on object storage and supports PromQL for metric queries. See the High-Cardinality Observability solution for the architecture and the PromQL documentation for supported query workflows.
Measure Prometheus cardinality in Parseable
Parseable stores a stable series hash with each Prometheus metric sample. You can count those hashes in the Query Console to see how many distinct series appeared in a metric stream during the selected time window:
SELECT
  count(DISTINCT "__series_hash_u64") AS distinct_series
FROM
  "<dataset_name>";
Choose a representative time window before running the query. A result of 101084, for example, means Parseable found 101,084 distinct series identities among the samples scanned for that period.
This is a historical-window count, not a point-in-time active-series count. Compare equivalent time windows before and after an instrumentation or relabeling change. Use prometheus_tsdb_head_series when you need the number of series currently in the Prometheus head block.
Prometheus cardinality checklist
- Graph
prometheus_tsdb_head_seriesbeside traffic and memory. - Use
/api/v1/status/tsdbto rank metrics and labels before running broad queries. - Scope PromQL analysis to one job, namespace or metric family.
- Normalize raw routes and remove unbounded identifiers at instrumentation time.
- Treat
metric_relabel_configsas a controlled ingestion filter. - Treat recording rules as query optimization rather than cardinality reduction.
- Remember that scrape limits fail the complete scrape.
- Count distinct
__series_hash_u64values in Parseable over equivalent time windows. - Verify one change over a comparable traffic window.