
Direct telemetry export usually starts simple. An application sends OTLP to a backend, the data appears and you move on.
That works until the exceptions arrive.
One service needs Kubernetes metadata. Another must remove email addresses from its logs. A third has to send traces to two backends without keeping an API key in application code. Putting each rule inside each service duplicates configuration and spreads credentials across codebases.
The OpenTelemetry Collector gives those jobs one place to run.
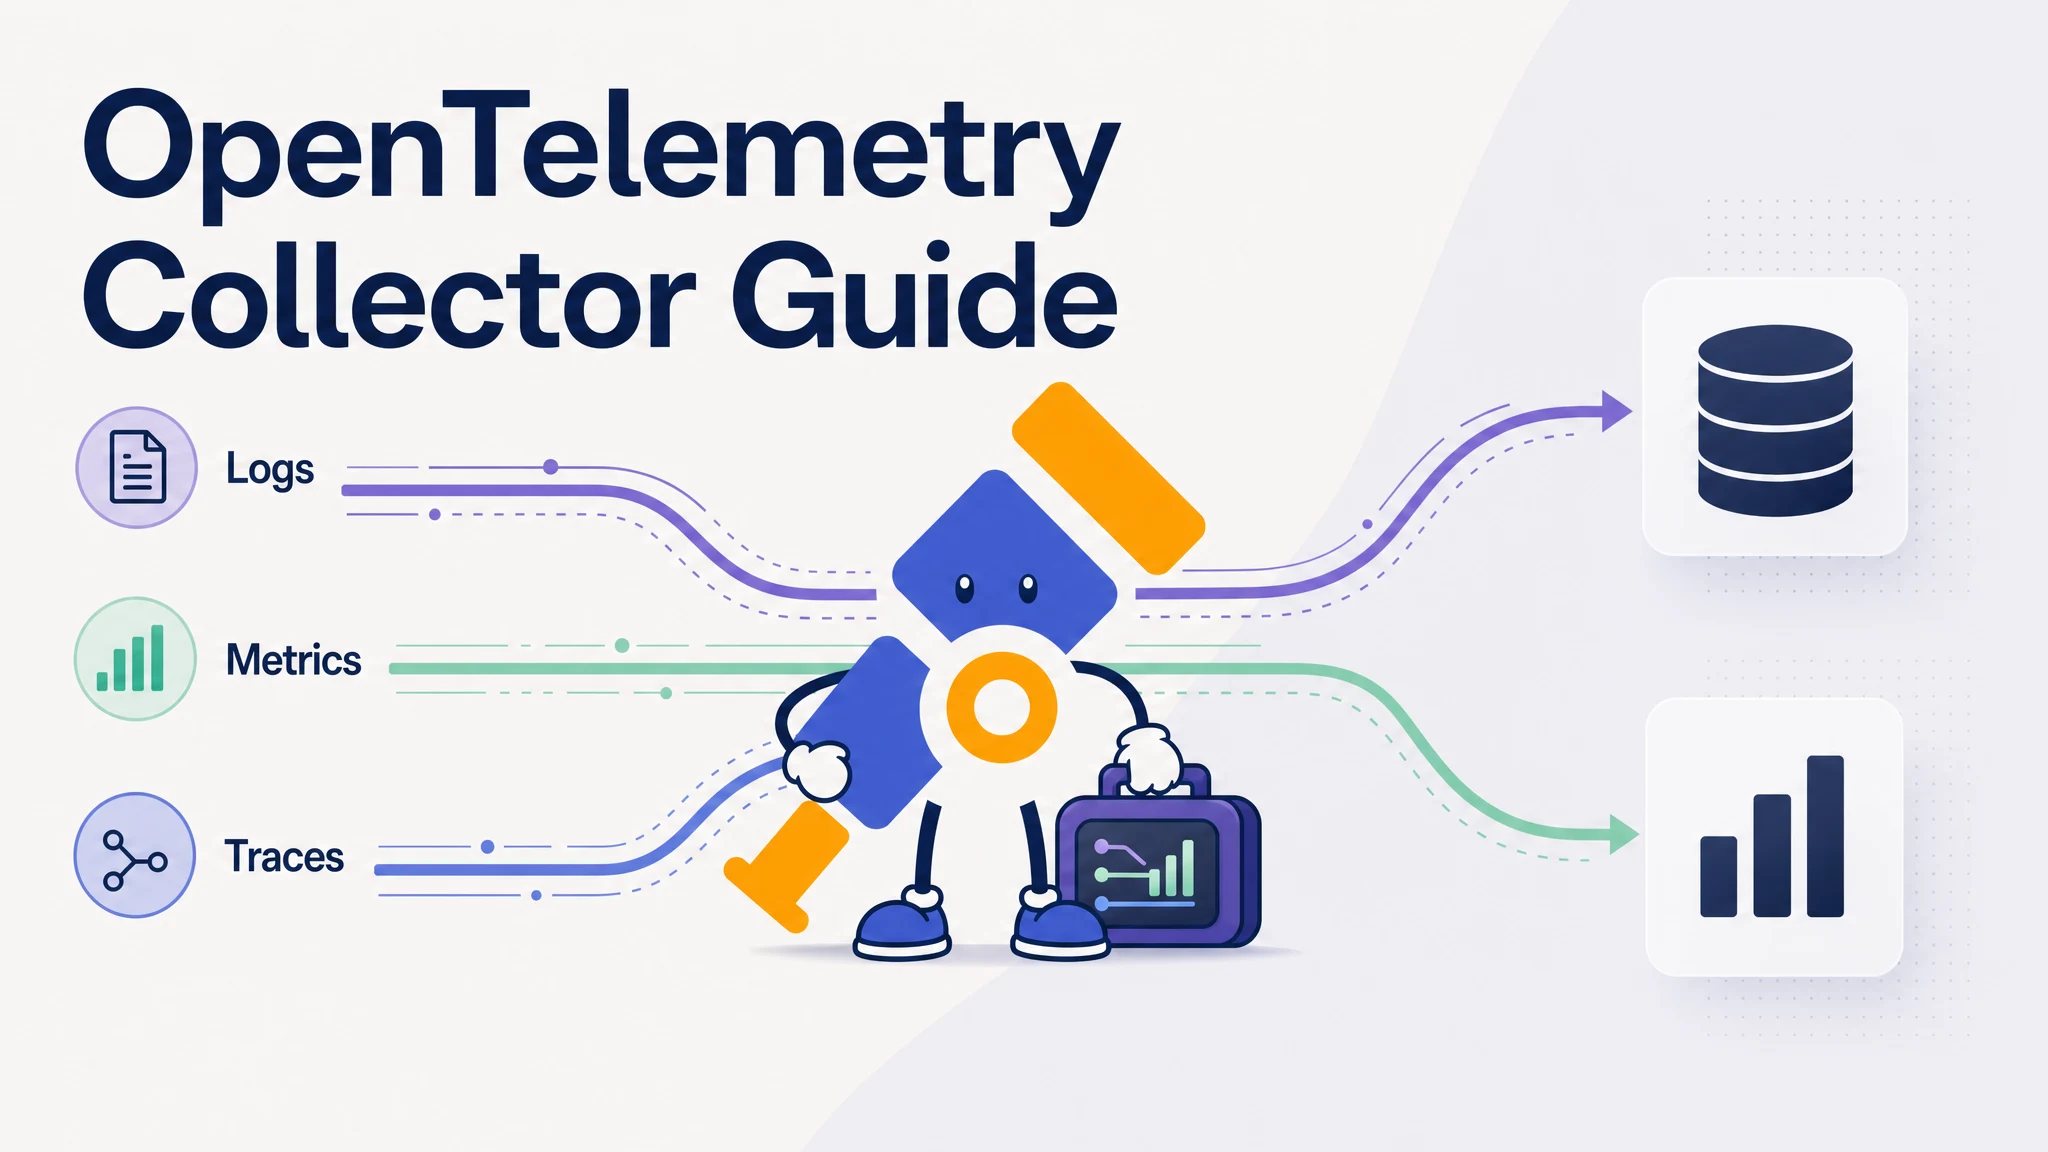
The OpenTelemetry Collector is a vendor-neutral service that receives telemetry, processes it and exports it to one or more destinations. It can handle logs, metrics and traces through configurable pipelines, so applications only need to send OTLP to a nearby endpoint.
The Collector is optional. A small application can send telemetry directly to a backend. Its value becomes clearer when you need batching, retries, filtering, enrichment, routing or a consistent export path across many services.
Collector placement affects what it can collect, where telemetry queues up and how failures spread.
What is the OpenTelemetry Collector?
The OpenTelemetry Collector, often shortened to OTel Collector or otelcol, is an open-source proxy for telemetry data. It sits between the systems that produce telemetry and the systems that store or analyze it.
Applications and infrastructure
            |
            | OTLP, Prometheus, files, syslog, Jaeger, Zipkin ...
            v
   OpenTelemetry Collector
            |
            | OTLP, Prometheus remote write, Kafka ...
            v
    Observability backends
The Collector does not instrument your application, store months of telemetry or provide a query interface. OpenTelemetry SDKs and auto-instrumentation create the data. The Collector moves and modifies it. A backend such as Parseable stores the data and gives engineers a way to search, visualize and alert on it.
Applications can keep exporting OTLP when the backend changes and processing rules no longer have to be copied into every codebase.
How does the OpenTelemetry Collector work?
Every Collector pipeline follows the same path:
receiver -> processor(s) -> exporter(s)A receiver accepts data. Processors can alter or buffer it in sequence. Exporters send the result onward. The service section of the configuration connects those components into pipelines for logs, metrics or traces.
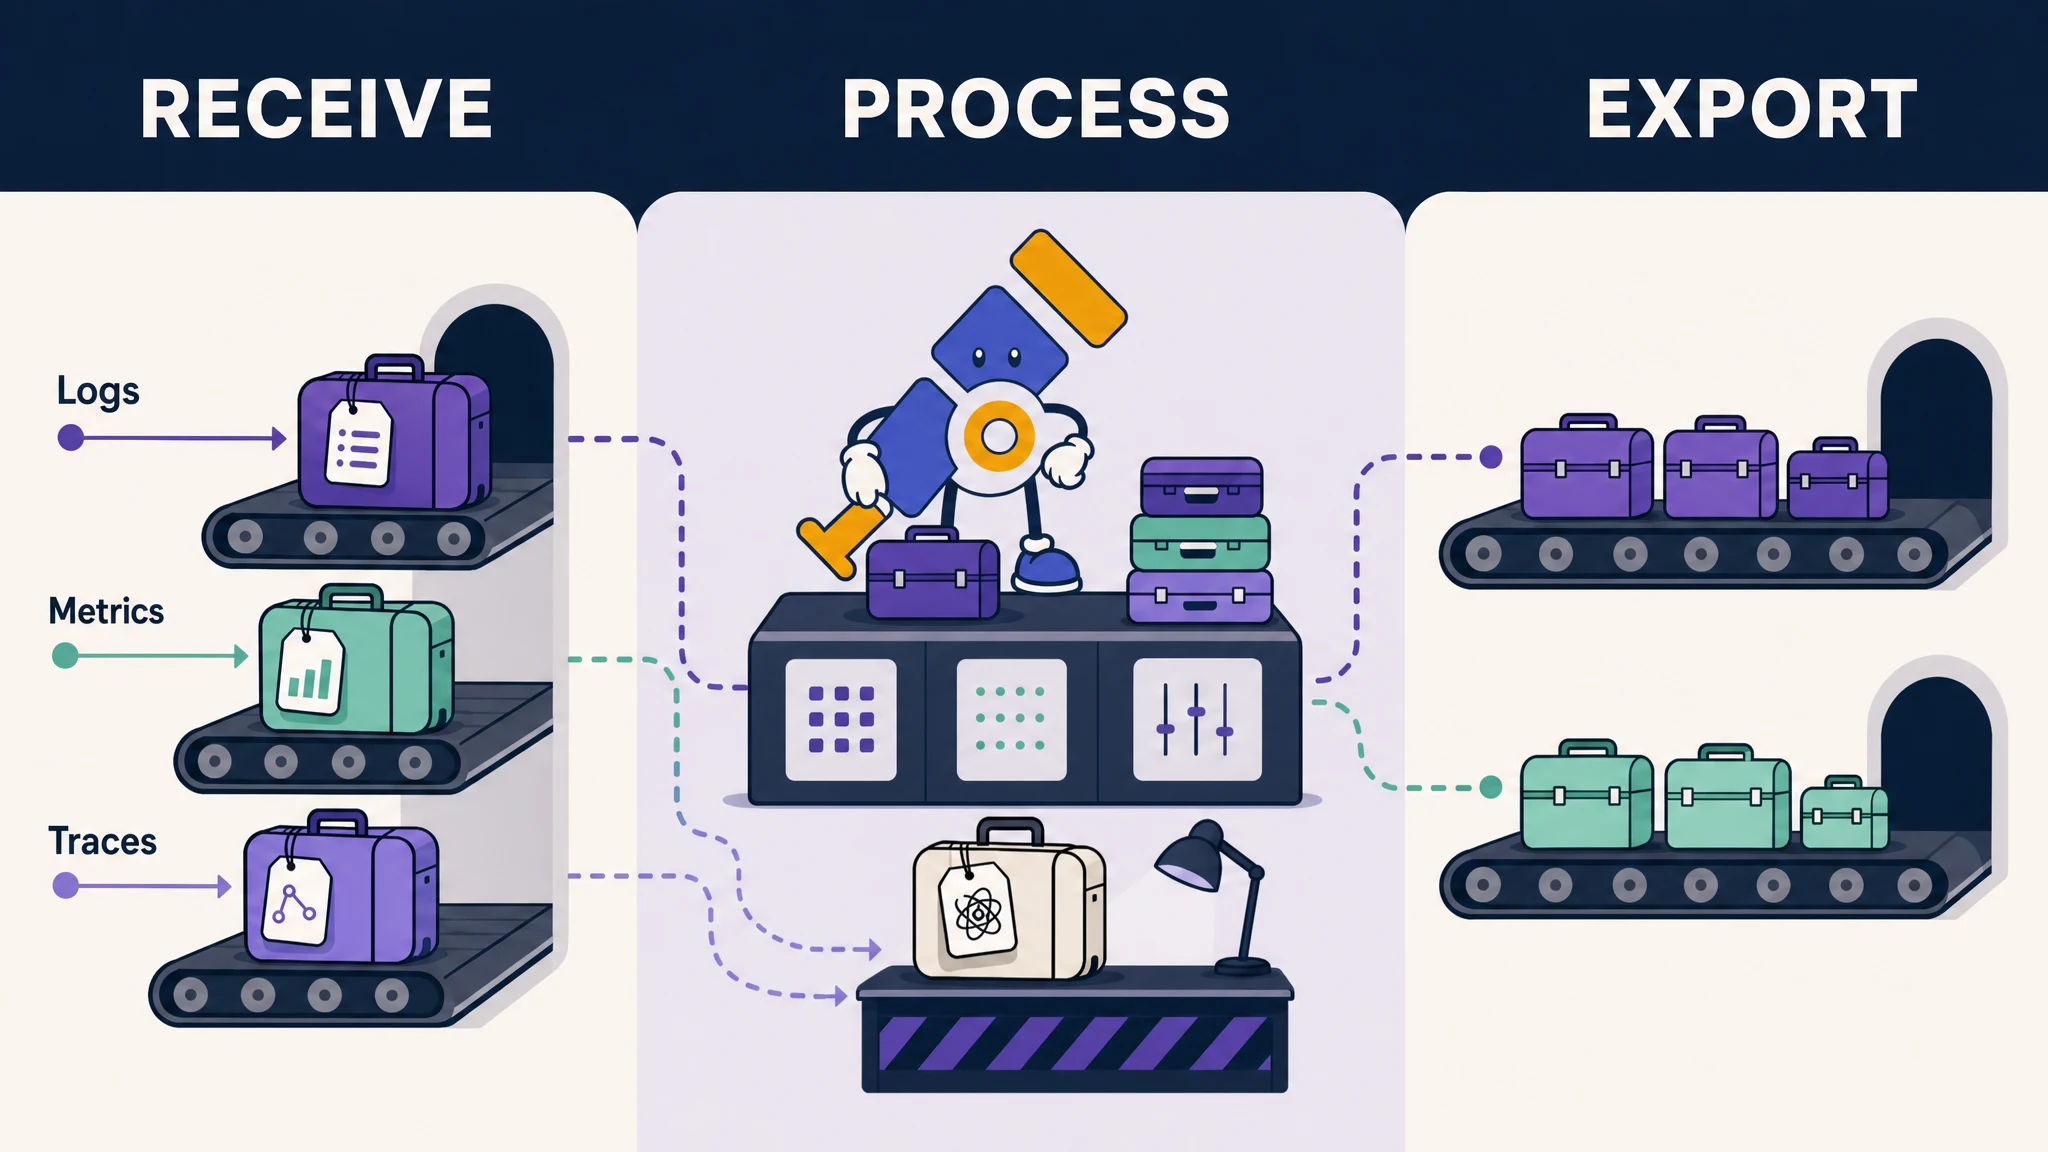
The configuration may define a component without using it. A receiver, processor or exporter becomes active only when a pipeline under service.pipelines refers to it. A Collector can therefore start successfully while collecting no telemetry.
Receivers bring telemetry in
A receiver listens for pushed data or pulls data from a source. The OTLP receiver is the common entry point for instrumented applications. Other receivers can scrape Prometheus endpoints, read files, consume Kafka topics or accept formats such as Jaeger and Zipkin.
One receiver can feed more than one pipeline when it supports those signal types. The Collector converts incoming data into its internal telemetry representation before passing it forward.
Processors change telemetry in flight
Processors run in the order listed in the pipeline. They can batch records, limit memory use, add resource attributes, redact values, filter noise, sample traces or transform fields.
Some processors depend on context that disappears when data is split across Collector instances. Tail sampling, for example, needs all spans from a trace to reach the same decision point.
Processor order matters too. If redaction runs after export, the sensitive value has already left the Collector.
The memory limiter processor guide covers one of the first safeguards worth understanding for production Collectors.
Exporters send telemetry out
An exporter translates the processed data into the protocol expected by a destination. An OTLP exporter can forward all supported signals to another Collector or an OTLP-compatible backend. Other exporters target systems such as Kafka or Prometheus remote write. The OpenTelemetry Collector exporters guide compares the debug, OTLP HTTP, OTLP gRPC and contrib paths.
A pipeline can have several exporters. This makes fan-out possible, but it also means each destination has its own credentials, availability and backpressure behavior to manage.
Connectors join pipelines
A connector acts as an exporter for one pipeline and a receiver for another. The SpanMetrics connector, for example, consumes spans from a traces pipeline and produces request count and duration metrics for a metrics pipeline.
The SpanMetrics connector guide follows that flow through a working configuration and explains how to control the resulting metric cardinality.
Extensions support the Collector process
Extensions provide capabilities outside the telemetry path, such as health checks, authentication, service discovery, persistent storage and diagnostic pages. They must also be enabled in the service section.
The official Collector component documentation lists the available component types and the distributions that contain them.
Do you need an OpenTelemetry Collector?
Not for every deployment.
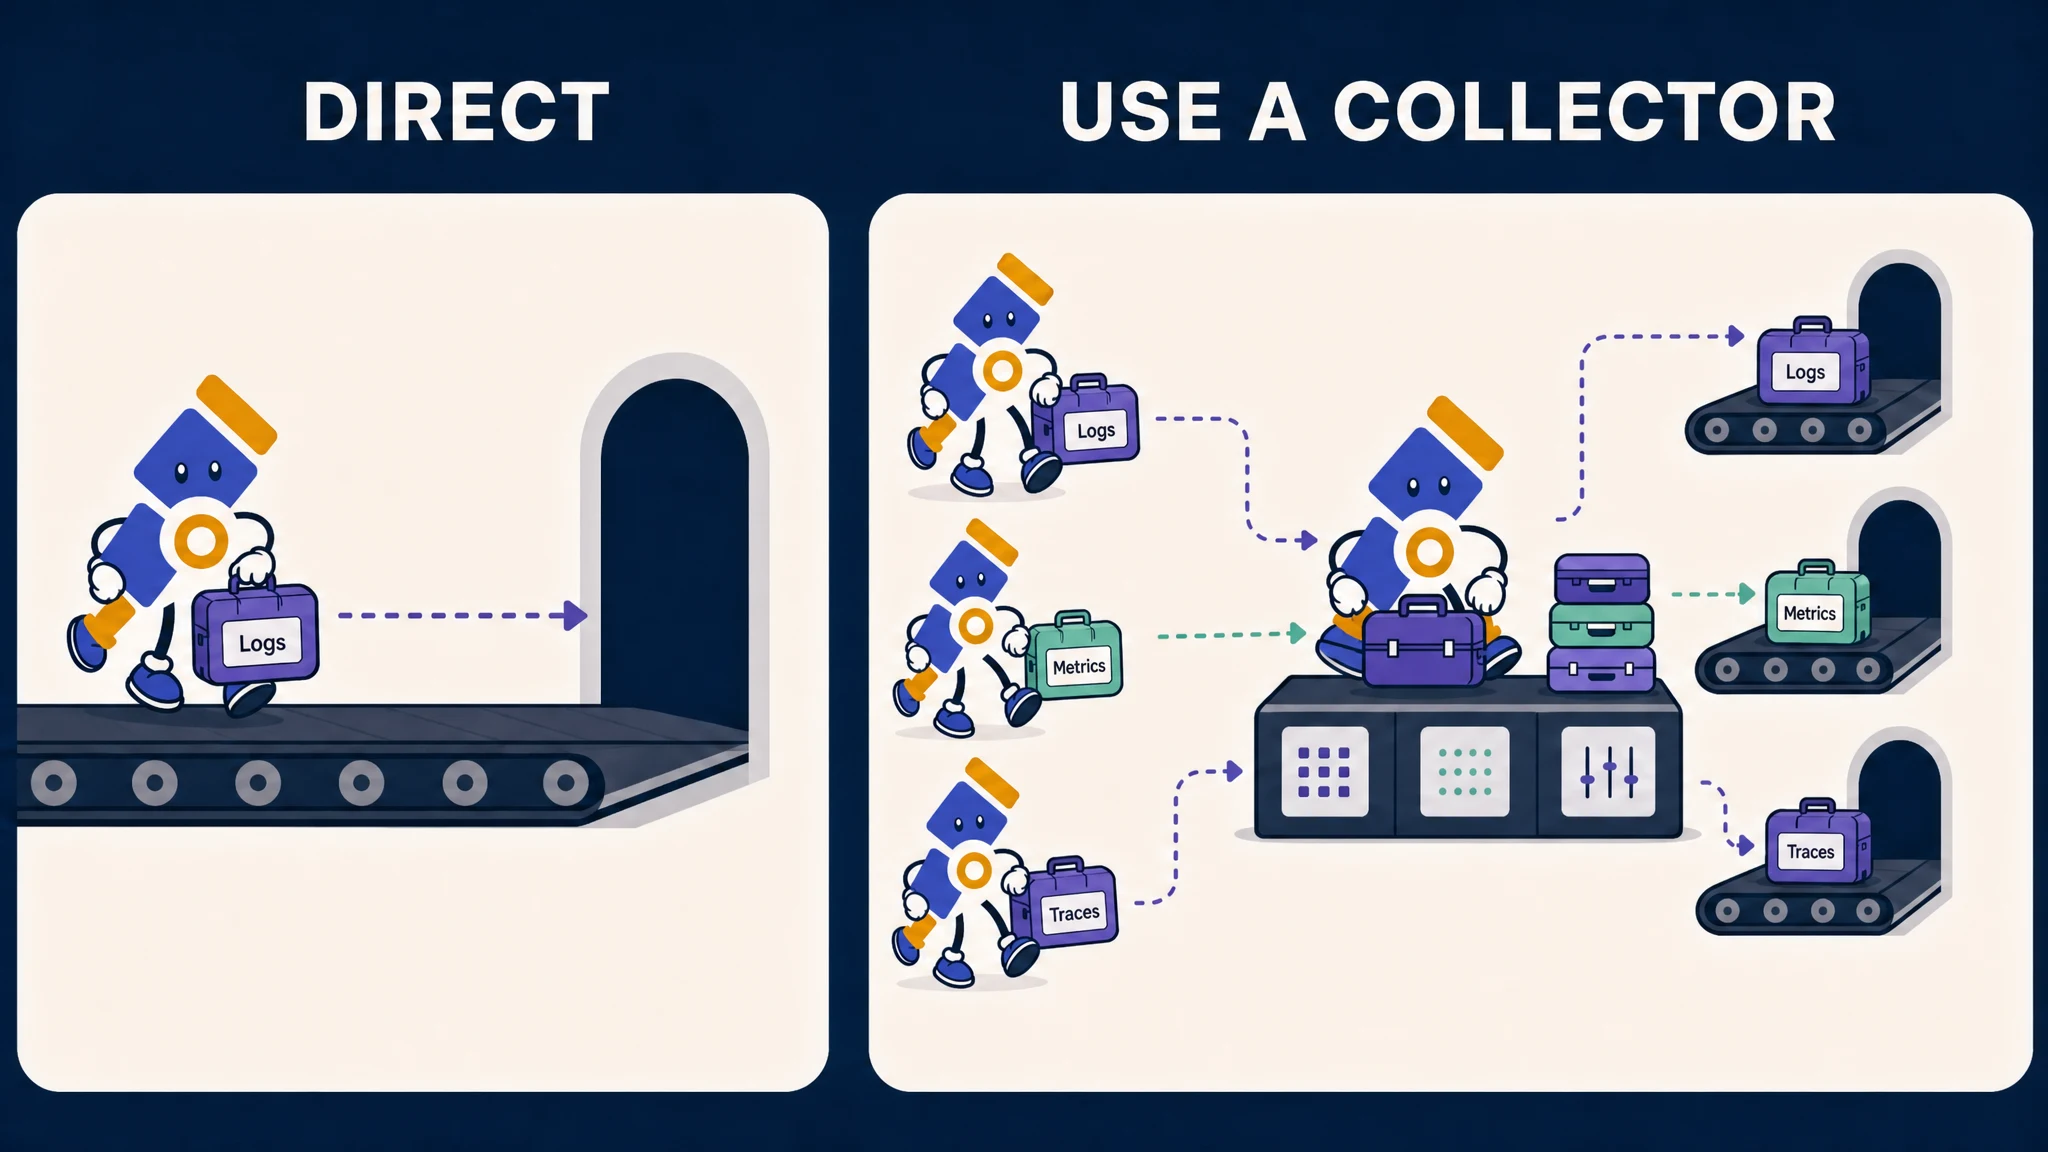
Direct export is a reasonable starting point when one application sends a modest amount of telemetry to one backend and that backend supports OTLP. It removes another service from the path and makes local experiments quick.
Add a Collector when at least one of these jobs belongs outside the application:
- buffer and retry exports during a temporary backend failure
- remove secrets or personal data before telemetry leaves your network
- enrich records with Kubernetes, host, cloud or environment metadata—the Kubernetes attributes processor guide shows how pod association works
- filter noisy telemetry before paying to ingest and retain it
- route signals or tenants to different destinations
- receive non-OTLP formats and export them through a common protocol
- change observability backends without changing every service
The Collector becomes another production service with memory limits, credentials, upgrades and its own telemetry. If it sits on the only route to your backend, all telemetry may queue there during a failure.
If resource footprint influences that decision, our Fluent Bit and OpenTelemetry Collector performance analysis compares CPU, memory and I/O under the same test conditions.
| Situation | Sensible starting point |
|---|---|
| Local development or one small service | Export directly to the backend |
| Several services using different SDKs | Collector gateway |
| Host metrics or container log collection | Collector agent on each host or node |
| Central filtering, routing or tail sampling | Collector gateway |
| Large Kubernetes environment | Agents feeding a scalable gateway tier |
Your first OpenTelemetry Collector pipeline
The following example accepts OTLP over gRPC and HTTP, batches the data and prints it through the debug exporter. Keep this first pipeline boring. Its job is to prove that the path works before credentials and a remote backend join the investigation.
Save it as otel-collector.yaml:
receivers:
  otlp:
    protocols:
      grpc:
        endpoint: 0.0.0.0:4317
      http:
        endpoint: 0.0.0.0:4318

processors:
  batch: {}

exporters:
  debug:
    verbosity: basic

service:
  pipelines:
    traces:
      receivers: [otlp]
      processors: [batch]
      exporters: [debug]
Run the Contrib distribution in Docker:
docker run --rm \
  -p 127.0.0.1:4317:4317 \
  -p 127.0.0.1:4318:4318 \
  -v "$PWD/otel-collector.yaml:/etc/otelcol-contrib/config.yaml:ro" \
  otel/opentelemetry-collector-contrib:latest
Then point an instrumented application at http://localhost:4318 or use the official telemetrygen utility to send test spans. The Collector output should report received and exported spans.
The official Collector quick start provides a complete telemetrygen walkthrough. Pin a tested Collector version in production rather than using latest.
Once this small pipeline works, the OpenTelemetry Collector configuration guide builds it into a three-signal config and explains receivers, processors, exporters, extensions and validation.
Read the configuration from the bottom up
When a pipeline fails, start with service.pipelines.traces:
- Is the expected receiver listed?
- Does each named component exist elsewhere in the file?
- Are the processors in the intended order?
- Is the exporter listed in the same pipeline?
Reading from the pipeline outward is faster than scanning several hundred lines of YAML and hoping the typo introduces itself.
Core, Contrib or a custom distribution?
The Collector is distributed as a binary containing a fixed set of components. Configuration enables components already compiled into that binary; it cannot summon a missing receiver into existence.
- Core contains a smaller set of generally applicable components.
- Contrib includes a much broader component catalog and is common for general deployments.
- Kubernetes is assembled for common Kubernetes collection needs.
- Custom distributions contain only the components your deployment requires.
Check the component registry before choosing a distribution. A smaller distribution reduces binary size and attack surface, while Contrib is convenient when you are still working out which integrations the pipeline needs. OpenTelemetry documents the available builds on its Collector distributions page.
If the choice is between an upstream distribution and Grafana's collector, the Grafana Alloy vs OpenTelemetry Collector comparison separates configuration, Prometheus, component coverage and operational trade-offs.
Where should you run the OpenTelemetry Collector?
“Run the Collector” is incomplete advice. Placement decides which data the Collector can see, how failures spread and which processors work correctly.
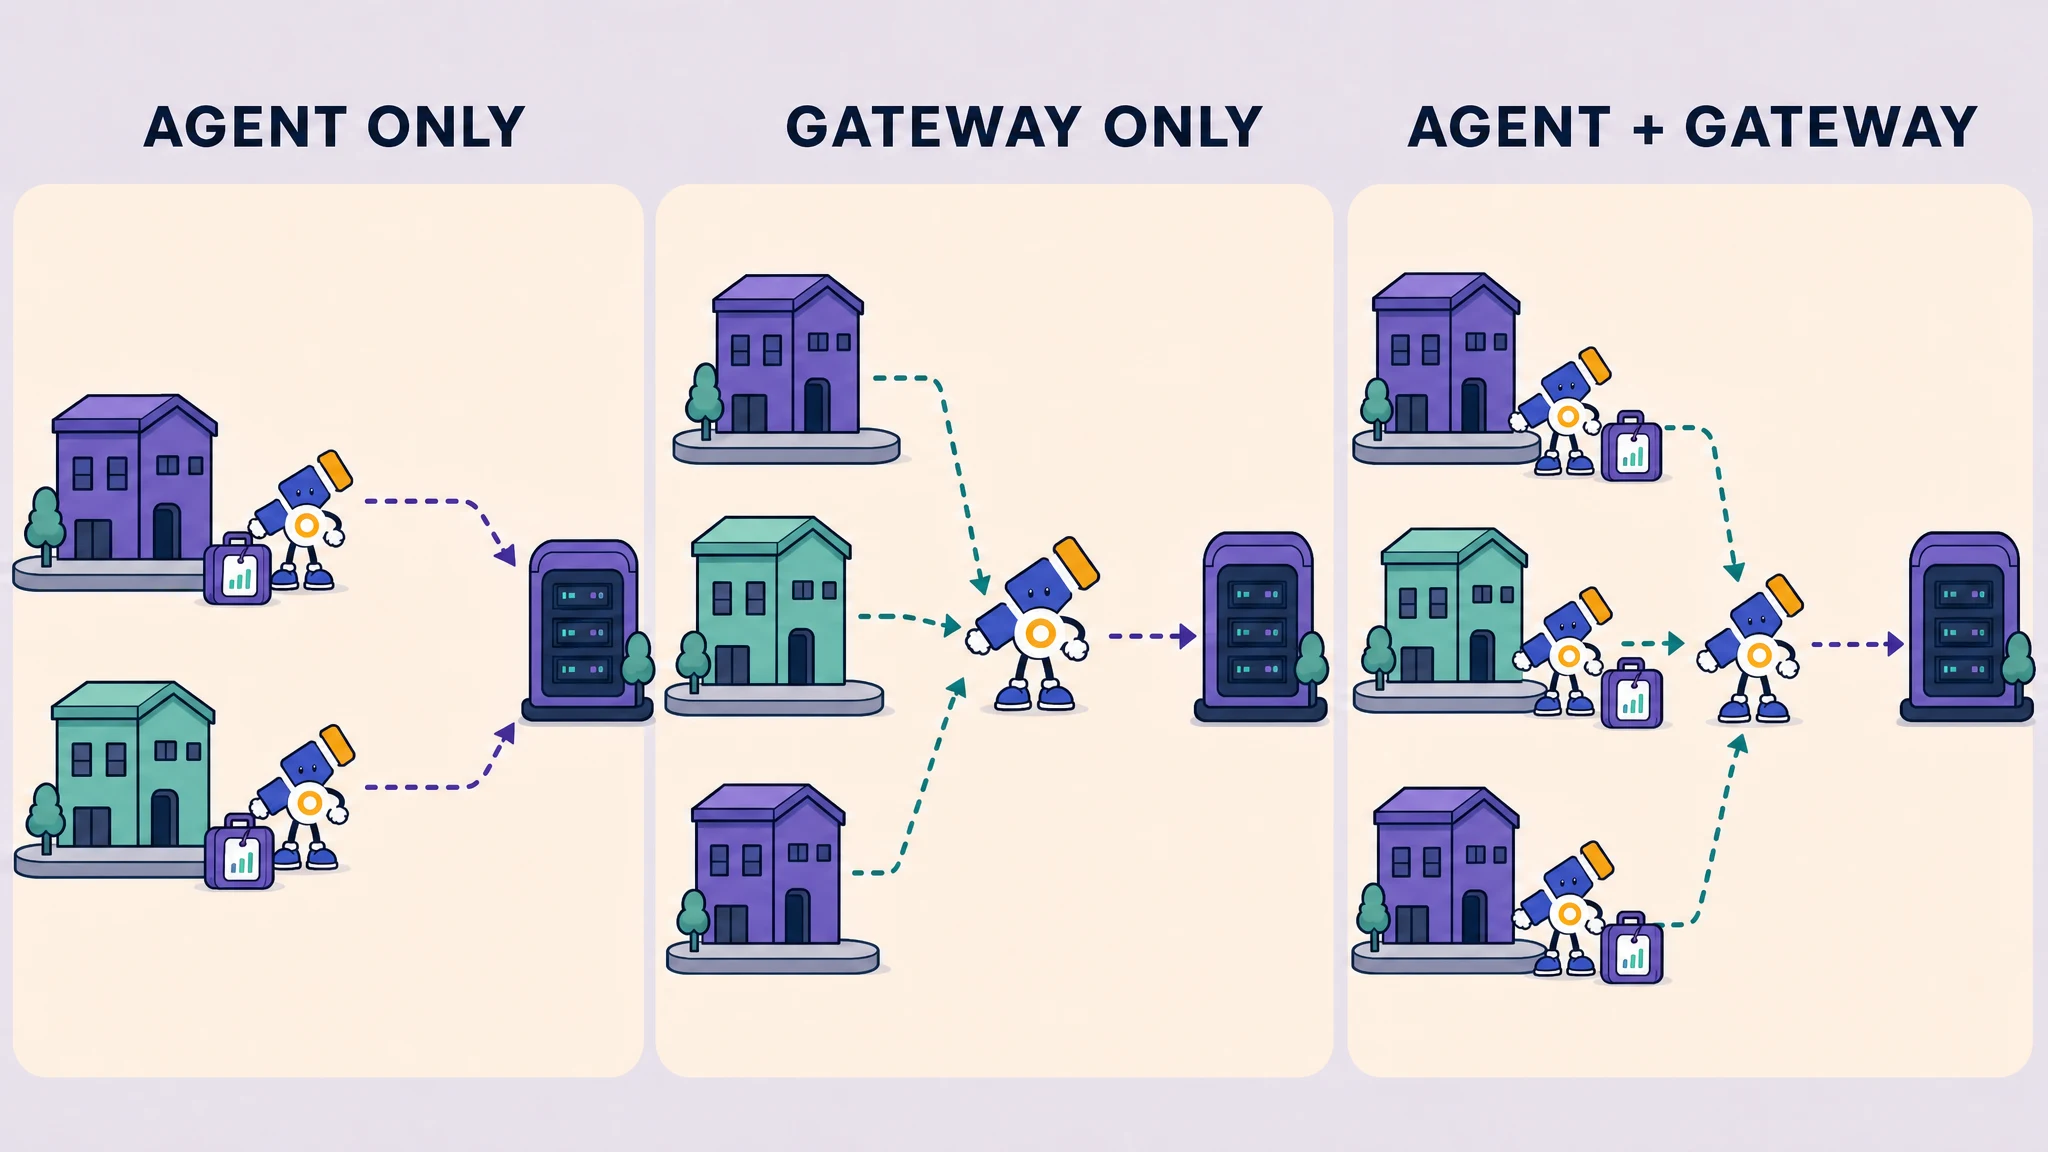
For a Kubernetes implementation, the agent vs gateway deployment guide maps node-local receivers, centralized processing and stateful routing to DaemonSets and Deployments.
Agent pattern
An agent runs close to the workload, commonly as a host service, sidecar or Kubernetes DaemonSet. It is well placed to read local files, collect host metrics and add node-specific metadata.
Agents reduce the distance between an application and its first telemetry hop. They also multiply the number of Collector instances you have to configure and upgrade.
Gateway pattern
A gateway is a standalone Collector service shared by many workloads. It centralizes credentials, transformations, routing and exports to backends. Gateways can scale horizontally behind a load balancer when the pipeline components allow it.
A gateway cannot read a log file that exists only on an application node. It also needs careful load balancing for stateful processing. Tail sampling requires every span from the same trace to arrive at the same sampling Collector.
Agent-to-gateway pattern
Larger environments often use both. Agents handle local collection and lightweight enrichment, then send OTLP to a gateway tier for centralized policy and export.
workload -> node agent -> gateway pool -> backendThis pattern is flexible, but each Collector hop adds queues, resource use and another place to inspect during an incident. The official deployment pattern guide explains the trade-offs in more detail. For a working log-focused deployment, see Kubernetes logs with the OpenTelemetry Collector and Parseable.
What happens when the backend is unavailable?
The application sends data to the Collector. The Collector processes it and calls an exporter. If the destination is temporarily unavailable, retry and queue settings determine whether the Collector waits, buffers or drops data.
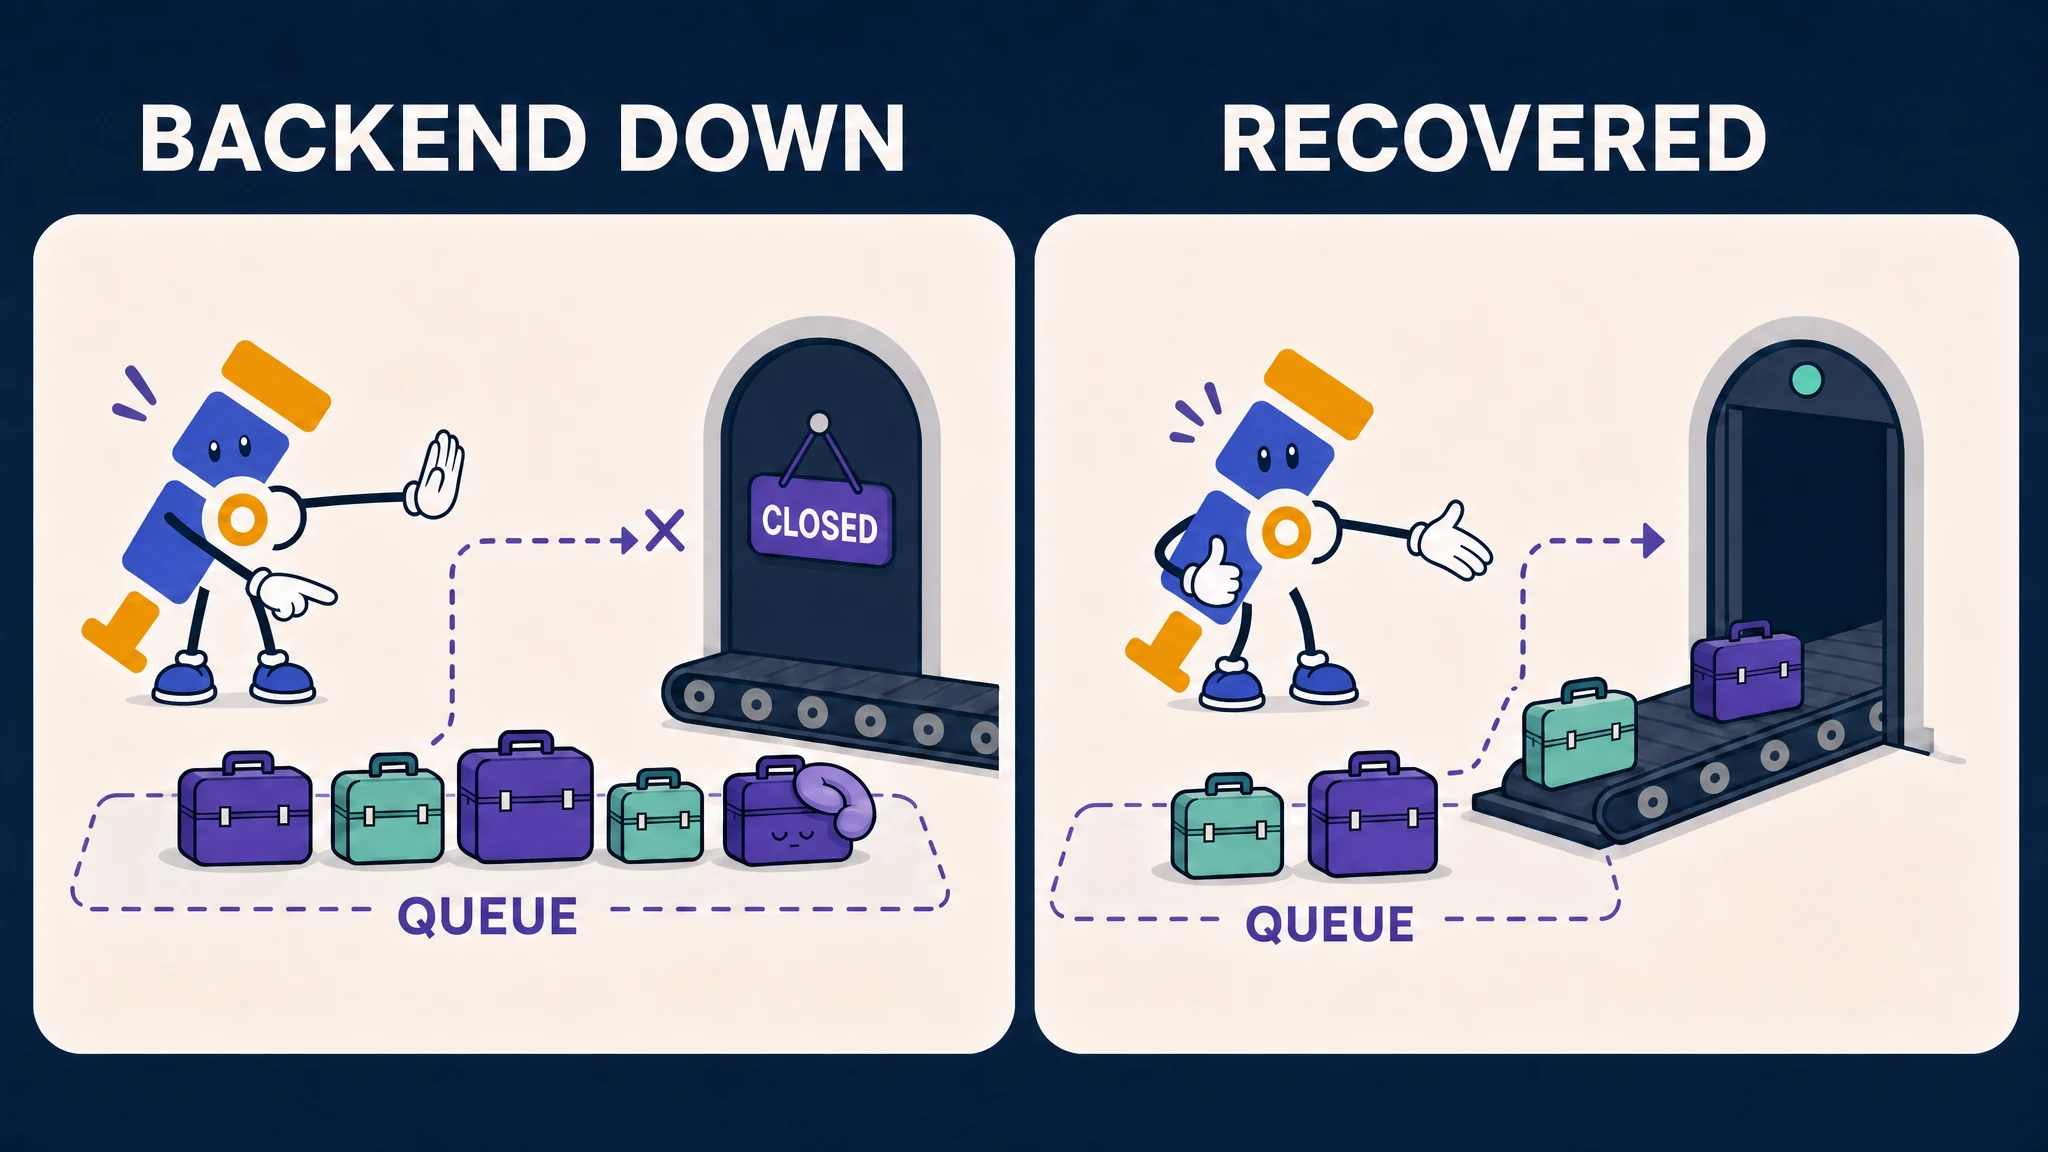
Memory is finite. A queue that grows without a limit eventually turns an observability outage into a Collector outage. Persistent queue storage can survive a process restart, but it still needs capacity planning and testing.
Before production, settle five questions:
- which failures are retryable
- how long data may wait
- how much memory or disk the queue may consume
- what happens when the queue is full
- which alert fires before telemetry is dropped
Test the failure path by making the destination unavailable in a non-production environment. Watch the queue grow, restore the destination and confirm that it drains. A configuration review cannot prove recovery behavior. The Collector data loss guide explains how to size sending queues, configure retries and persist queued telemetry across restarts.
How to monitor the Collector
The Collector emits its own metrics and logs. Use them to follow four boundaries:
- telemetry accepted by receivers
- telemetry refused by receivers
- telemetry sent by exporters
- telemetry failed or dropped during export
Also watch process memory, CPU, queue size and exporter latency. A healthy application with a saturated Collector can create a very convincing blank dashboard.
The OTel Collector metrics guide turns those boundaries into dashboard panels and alerts for refused data, queue pressure and export failures. OpenTelemetry also maintains separate guidance for Collector troubleshooting. During setup, the debug exporter separates “the Collector did not receive data” from “the backend did not accept data.” Do not leave detailed payload logging enabled on a busy production pipeline.
Production checklist
Before putting the Collector on a critical telemetry path:
- pin the Collector distribution and version
- validate that every configured component exists in that distribution
- bind receivers only to interfaces that need access
- use TLS and authentication across network boundaries
- keep API keys in a secret store or environment injection mechanism
- set container or service resource requests and limits
- add the memory limiter and batch processors where appropriate
- configure and test retry and queue behavior
- expose health checks and collect the Collector's internal telemetry
- load test with representative signal volume and payload size
- document who owns Collector upgrades and configuration changes
Collector configurations can contain credentials and can process telemetry with personal or security-sensitive fields. OpenTelemetry's Collector security guidance recommends encrypted transport, authentication, least privilege and limiting the binary to required components. The PII removal guide shows how to clean sensitive fields before they reach an exporter.
Sending OpenTelemetry data to Parseable
Parseable accepts OpenTelemetry logs, metrics and traces over OTLP/HTTP. The Collector can receive OTLP from applications, apply shared processing and route each signal to an appropriate Parseable dataset.
A minimal trace exporter looks like this:
exporters:
  otlphttp/parseable:
    endpoint: ${env:PARSEABLE_URL}
    encoding: json
    headers:
      X-API-Key: ${env:PARSEABLE_API_KEY}
      X-P-Stream: ${env:PARSEABLE_DATASET}
      X-P-Log-Source: otel-traces
Add the exporter to the traces pipeline after the local debug path works. Keep credentials outside the file and use HTTPS outside a local development environment.
The OpenTelemetry and Parseable stack guide covers a complete multi-signal architecture. The Parseable OpenTelemetry documentation has signal-specific ingestion instructions.