
Microsoft SQL Server
Send SQL Server logs, metrics, and traces to Parseable with OpenTelemetry
SQL Server emits useful signals from a few different places: ERRORLOG files, dynamic management views, query telemetry, and the applications that execute T-SQL. This guide brings those signals into Parseable with the OpenTelemetry SQL Server and SQL Query receivers, ERRORLOG collection, and a continuously running SQL client workload.
What the integration collects
| Signal | Source | Parseable dataset |
|---|---|---|
| Logs | SQL Server ERRORLOG, active query samples, and top-query events | sqlserver-logs |
| Metrics | OpenTelemetry SQL Server receiver and optional SQL Query metrics | sqlserver-metrics |
| Traces | Instrumented SQL client spans | sqlserver-traces |
SQL Server does not emit end-to-end application traces. Instrument the application or workload executing T-SQL and send its spans to the Collector over OTLP.
Prerequisites
- SQL Server 2019 or later
- OpenTelemetry Collector Contrib
- A Parseable ingestor endpoint and API key
- A monitoring login with access to SQL Server dynamic management views
SQL Server Developer Edition is licensed only for development and testing. Use an appropriately licensed edition in production.
Create a monitoring login
Run as a SQL Server administrator:
CREATE LOGIN otel WITH PASSWORD = 'replace-with-a-strong-password';
GRANT VIEW ANY DATABASE TO otel;

-- SQL Server 2022 and later
GRANT VIEW SERVER PERFORMANCE STATE TO otel;

-- Use VIEW SERVER STATE instead on older SQL Server releases.
Enable Query Store in the application database:
ALTER DATABASE telemetry SET QUERY_STORE = ON (
  OPERATION_MODE = READ_WRITE,
  QUERY_CAPTURE_MODE = AUTO,
  MAX_STORAGE_SIZE_MB = 256,
  INTERVAL_LENGTH_MINUTES = 1
);
For SQL Server on Linux, ERRORLOG is normally available at /var/opt/mssql/log/errorlog. Mount the log directory read-only into the Collector.
Collector configuration
Create otel-collector.yaml. The exporter examples expect PARSEABLE_ENDPOINT and PARSEABLE_API_KEY to be set in the Collector environment:
receivers:
  otlp:
    protocols:
      grpc:
        endpoint: 0.0.0.0:4317
      http:
        endpoint: 0.0.0.0:4318

  filelog/sqlserver:
    include:
      - /mssql/log/errorlog
      - /mssql/log/errorlog.*
    exclude:
      - /mssql/log/*.xel
    start_at: end
    include_file_name: true
    include_file_path: true

  sqlserver:
    collection_interval: 10s
    username: otel
    password: ${env:MSSQL_PASSWORD}
    server: sqlserver
    port: 1433
    events:
      db.server.query_sample:
        enabled: true
      db.server.top_query:
        enabled: true
    top_query_collection:
      lookback_time: 60s
      max_query_sample_count: 1000
      top_query_count: 100
      collection_interval: 30s
    query_sample_collection:
      max_rows_per_query: 100
    metrics:
      sqlserver.database.io:
        enabled: true
      sqlserver.database.latency:
        enabled: true
      sqlserver.database.operations:
        enabled: true
      sqlserver.database.tempdb.space:
        enabled: true
      sqlserver.deadlock.rate:
        enabled: true
      sqlserver.memory.usage:
        enabled: true
      sqlserver.os.wait.duration:
        enabled: true
      sqlserver.processes.blocked:
        enabled: true

processors:
  memory_limiter:
    check_interval: 1s
    limit_mib: 700
    spike_limit_mib: 150
  transform/sqlserver_query_logs:
    error_mode: ignore
    log_statements:
      - context: log
        statements:
          - set(body, "SQL Server query telemetry event")
  resource/sqlserver:
    attributes:
      - key: service.name
        value: sqlserver
        action: upsert
      - key: deployment.environment.name
        value: production
        action: upsert
  batch:
    timeout: 1s

exporters:
  otlphttp/parseable_logs:
    endpoint: ${env:PARSEABLE_ENDPOINT}
    encoding: json
    headers:
      Authorization: "Bearer ${env:PARSEABLE_API_KEY}"
      X-P-Stream: sqlserver-logs
      Content-Type: application/json
    retry_on_failure:
      enabled: true
      max_elapsed_time: 0s

  otlphttp/parseable_metrics:
    endpoint: ${env:PARSEABLE_ENDPOINT}
    encoding: json
    headers:
      Authorization: "Bearer ${env:PARSEABLE_API_KEY}"
      X-P-Stream: sqlserver-metrics
      Content-Type: application/json
    retry_on_failure:
      enabled: true
      max_elapsed_time: 0s

  otlphttp/parseable_traces:
    endpoint: ${env:PARSEABLE_ENDPOINT}
    encoding: json
    headers:
      Authorization: "Bearer ${env:PARSEABLE_API_KEY}"
      X-P-Stream: sqlserver-traces
      Content-Type: application/json
    retry_on_failure:
      enabled: true
      max_elapsed_time: 0s

service:
  pipelines:
    logs/errorlog:
      receivers: [filelog/sqlserver]
      processors: [memory_limiter, resource/sqlserver, batch]
      exporters: [otlphttp/parseable_logs]
    logs/query_events:
      receivers: [sqlserver]
      processors:
        - memory_limiter
        - transform/sqlserver_query_logs
        - resource/sqlserver
        - batch
      exporters: [otlphttp/parseable_logs]
    metrics:
      receivers: [sqlserver]
      processors: [memory_limiter, resource/sqlserver, batch]
      exporters: [otlphttp/parseable_metrics]
    traces:
      receivers: [otlp]
      processors: [memory_limiter, batch]
      exporters: [otlphttp/parseable_traces]
The query-event transform keeps the log body type stable while retaining query attributes such as db.query.text, elapsed time, reads, writes, query hashes, wait type, and blocking session ID.
Add dashboard-compatible custom metrics
Some dashboards expect mssql_* metric names rather than native sqlserver.* names. Add the SQL Query receiver when necessary:
receivers:
  sqlquery/dashboard_metrics:
    driver: sqlserver
    datasource: ${env:MSSQL_DATASOURCE}
    collection_interval: 15s
    queries:
      - sql: |
          SELECT COALESCE(DB_NAME(database_id), 'master') AS database_name,
                 CAST(COUNT_BIG(*) AS bigint) AS connection_count
          FROM sys.dm_exec_sessions
          WHERE is_user_process = 1
          GROUP BY database_id
        metrics:
          - metric_name: mssql_connections
            value_column: connection_count
            attribute_columns: [database_name]

      - sql: |
          SELECT CAST(SUM(io_stall_read_ms + io_stall_write_ms) AS bigint)
                 AS io_stall_total
          FROM sys.dm_io_virtual_file_stats(NULL, NULL)
        metrics:
          - metric_name: mssql_io_stall_total
            value_column: io_stall_total
Add sqlquery/dashboard_metrics to the metrics pipeline. Limit custom performance-counter queries to the counters used by your dashboards; exporting every SQL Server counter creates unnecessary volume.
Generate representative activity
The reference workload creates customer, product, inventory, order, event, measurement, and churn tables. It exercises transactions, joins, aggregates, full scans, tempdb sorts, lock waits, deliberate deadlocks, duplicate-key errors, and ERRORLOG entries.
SET XACT_ABORT ON;
BEGIN TRAN;

INSERT dbo.Orders(ExternalId, CustomerId, Status, Total)
VALUES(NEWID(), 42, 'paid', 99.95);

UPDATE dbo.Inventory
SET Available = Available - 1,
    Reserved = Reserved + 1,
    UpdatedAt = SYSUTCDATETIME()
WHERE ProductId = 7;

COMMIT;

RAISERROR('SQL Server telemetry workload completed', 10, 1) WITH LOG;
Instrument SqlClient, JDBC, ODBC, or the client library used by your application. Useful span attributes include db.system.name=microsoft.sql_server, db.namespace, db.operation.name, db.query.summary, server.address, and server.port.
Verify ingestion
SELECT count(*) FROM "sqlserver-logs"
WHERE p_timestamp > NOW() - INTERVAL '10 minutes';
SELECT metric_name, count(*)
FROM "sqlserver-metrics"
WHERE p_timestamp > NOW() - INTERVAL '10 minutes'
GROUP BY metric_name
ORDER BY metric_name;SELECT span_name, count(*)
FROM "sqlserver-traces"
WHERE p_timestamp > NOW() - INTERVAL '10 minutes'
GROUP BY span_name;View in Parseable
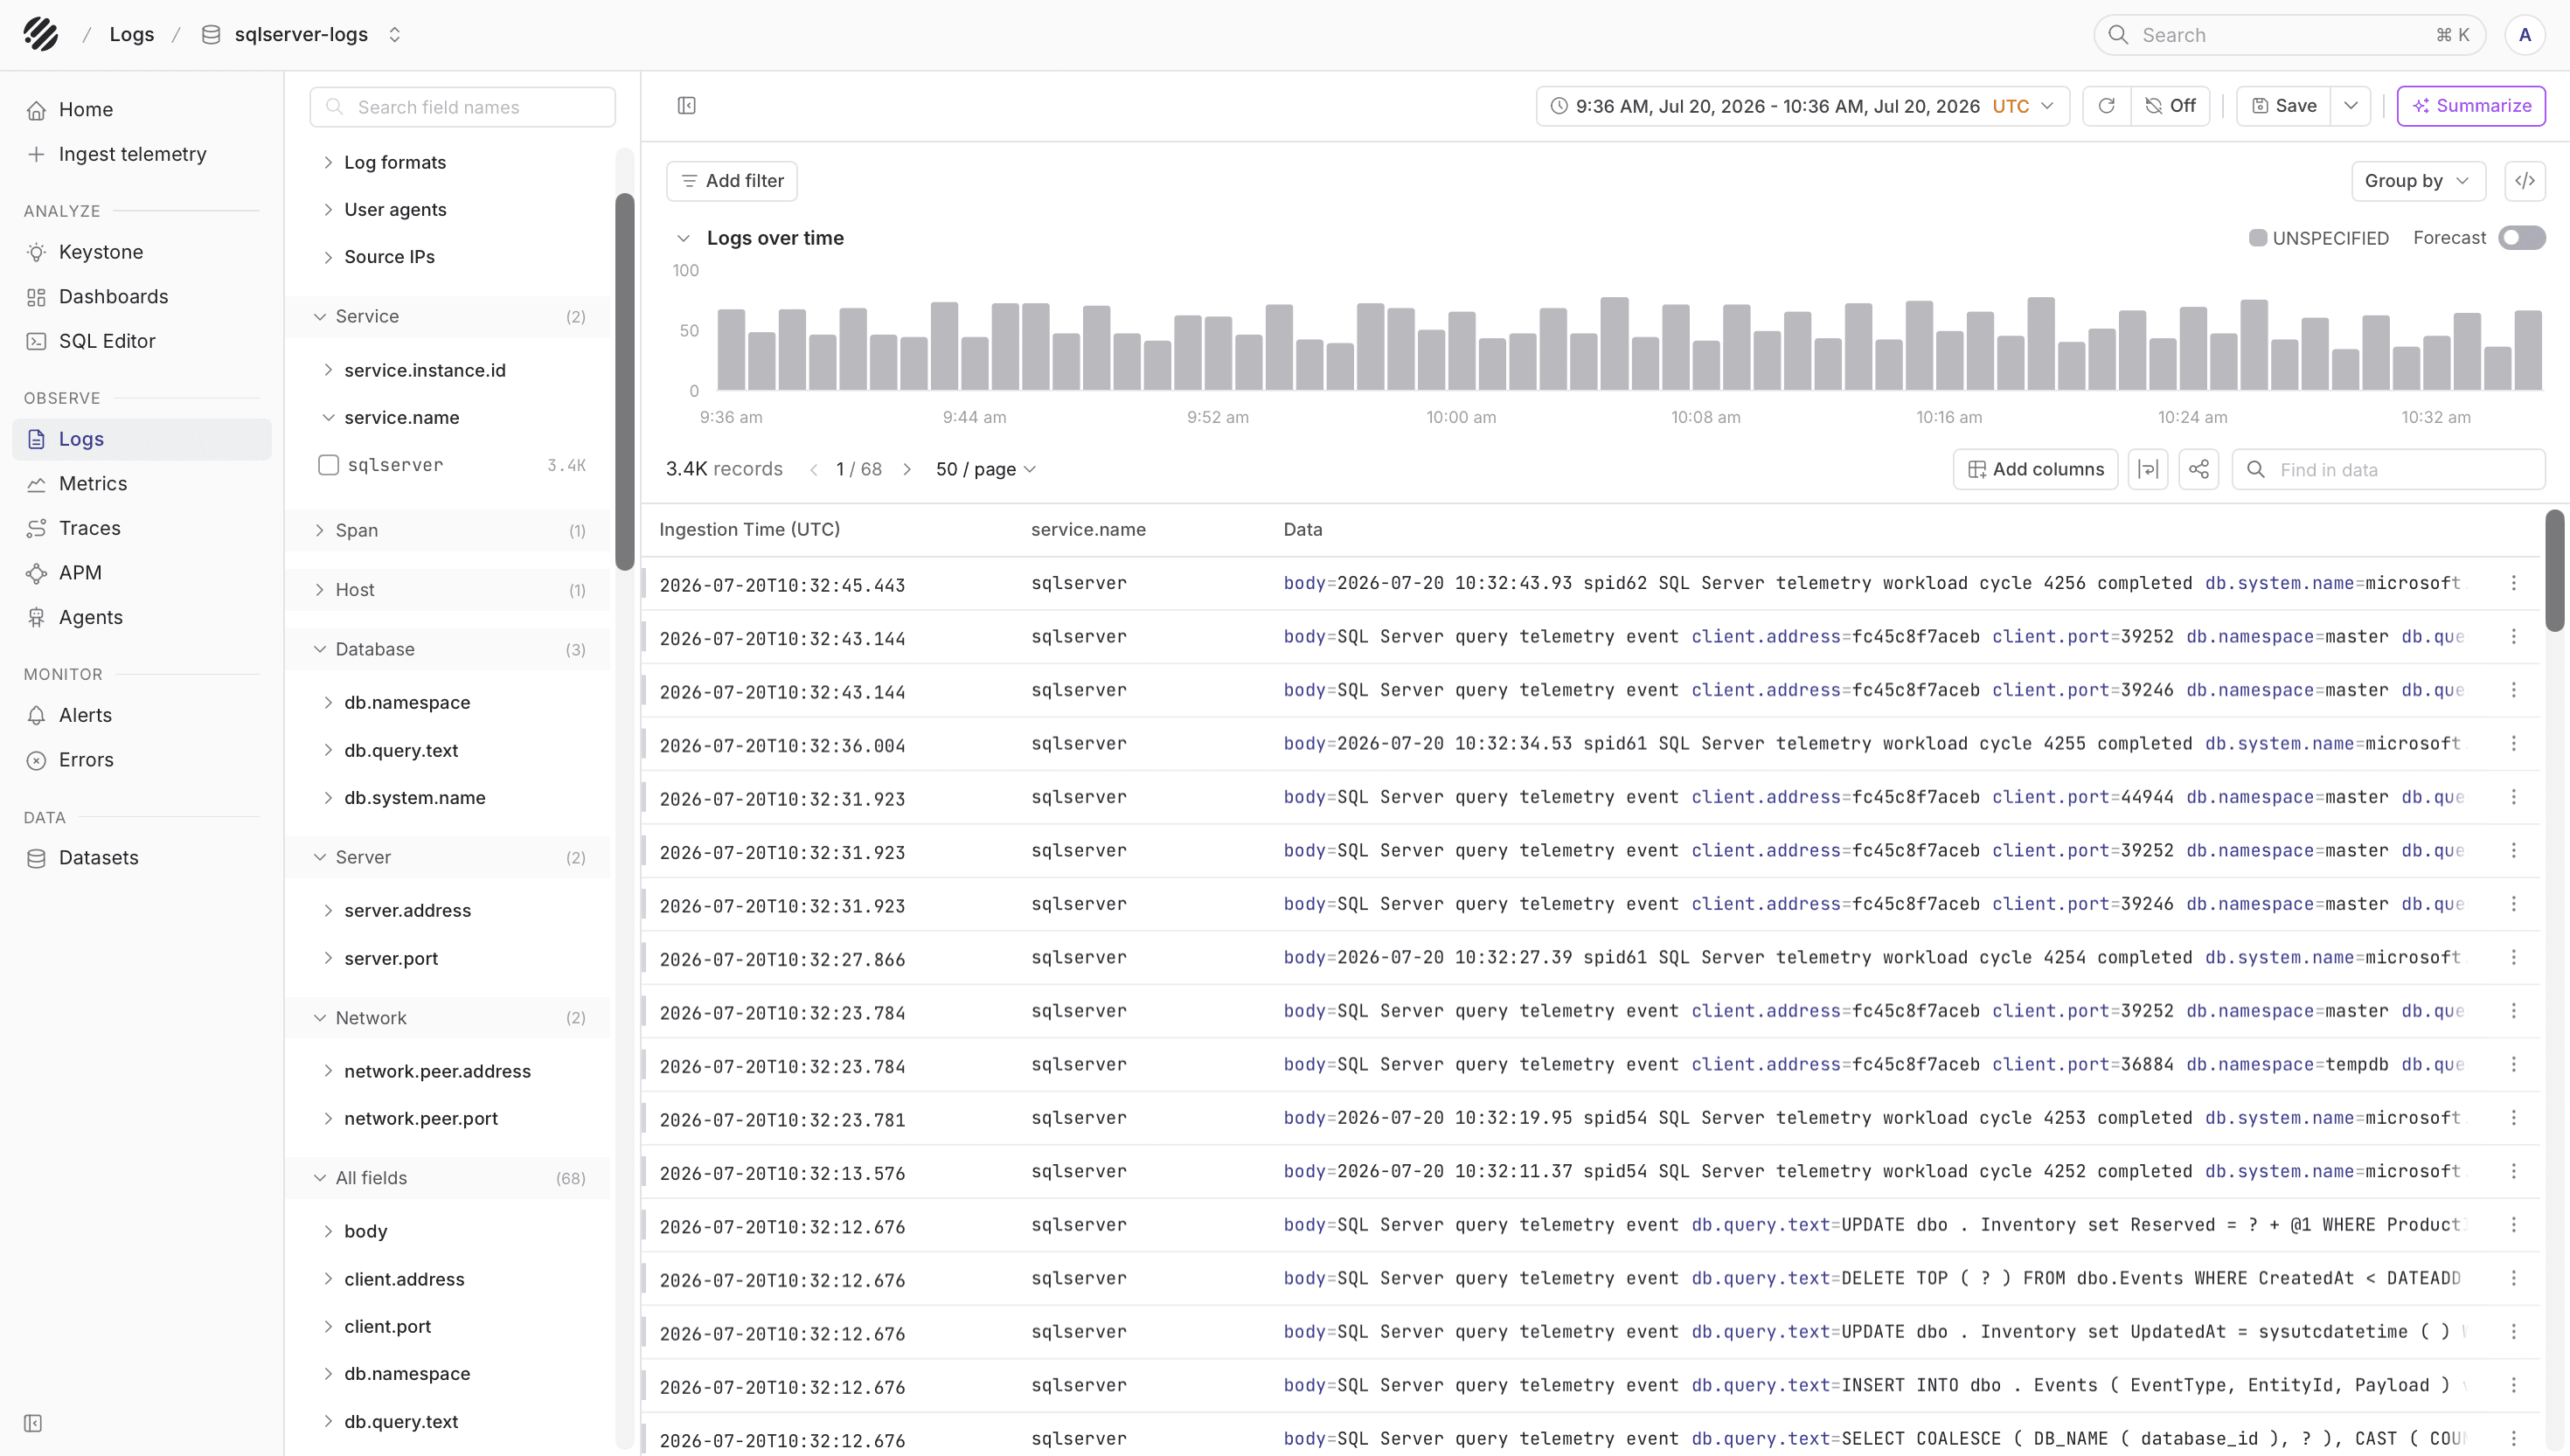
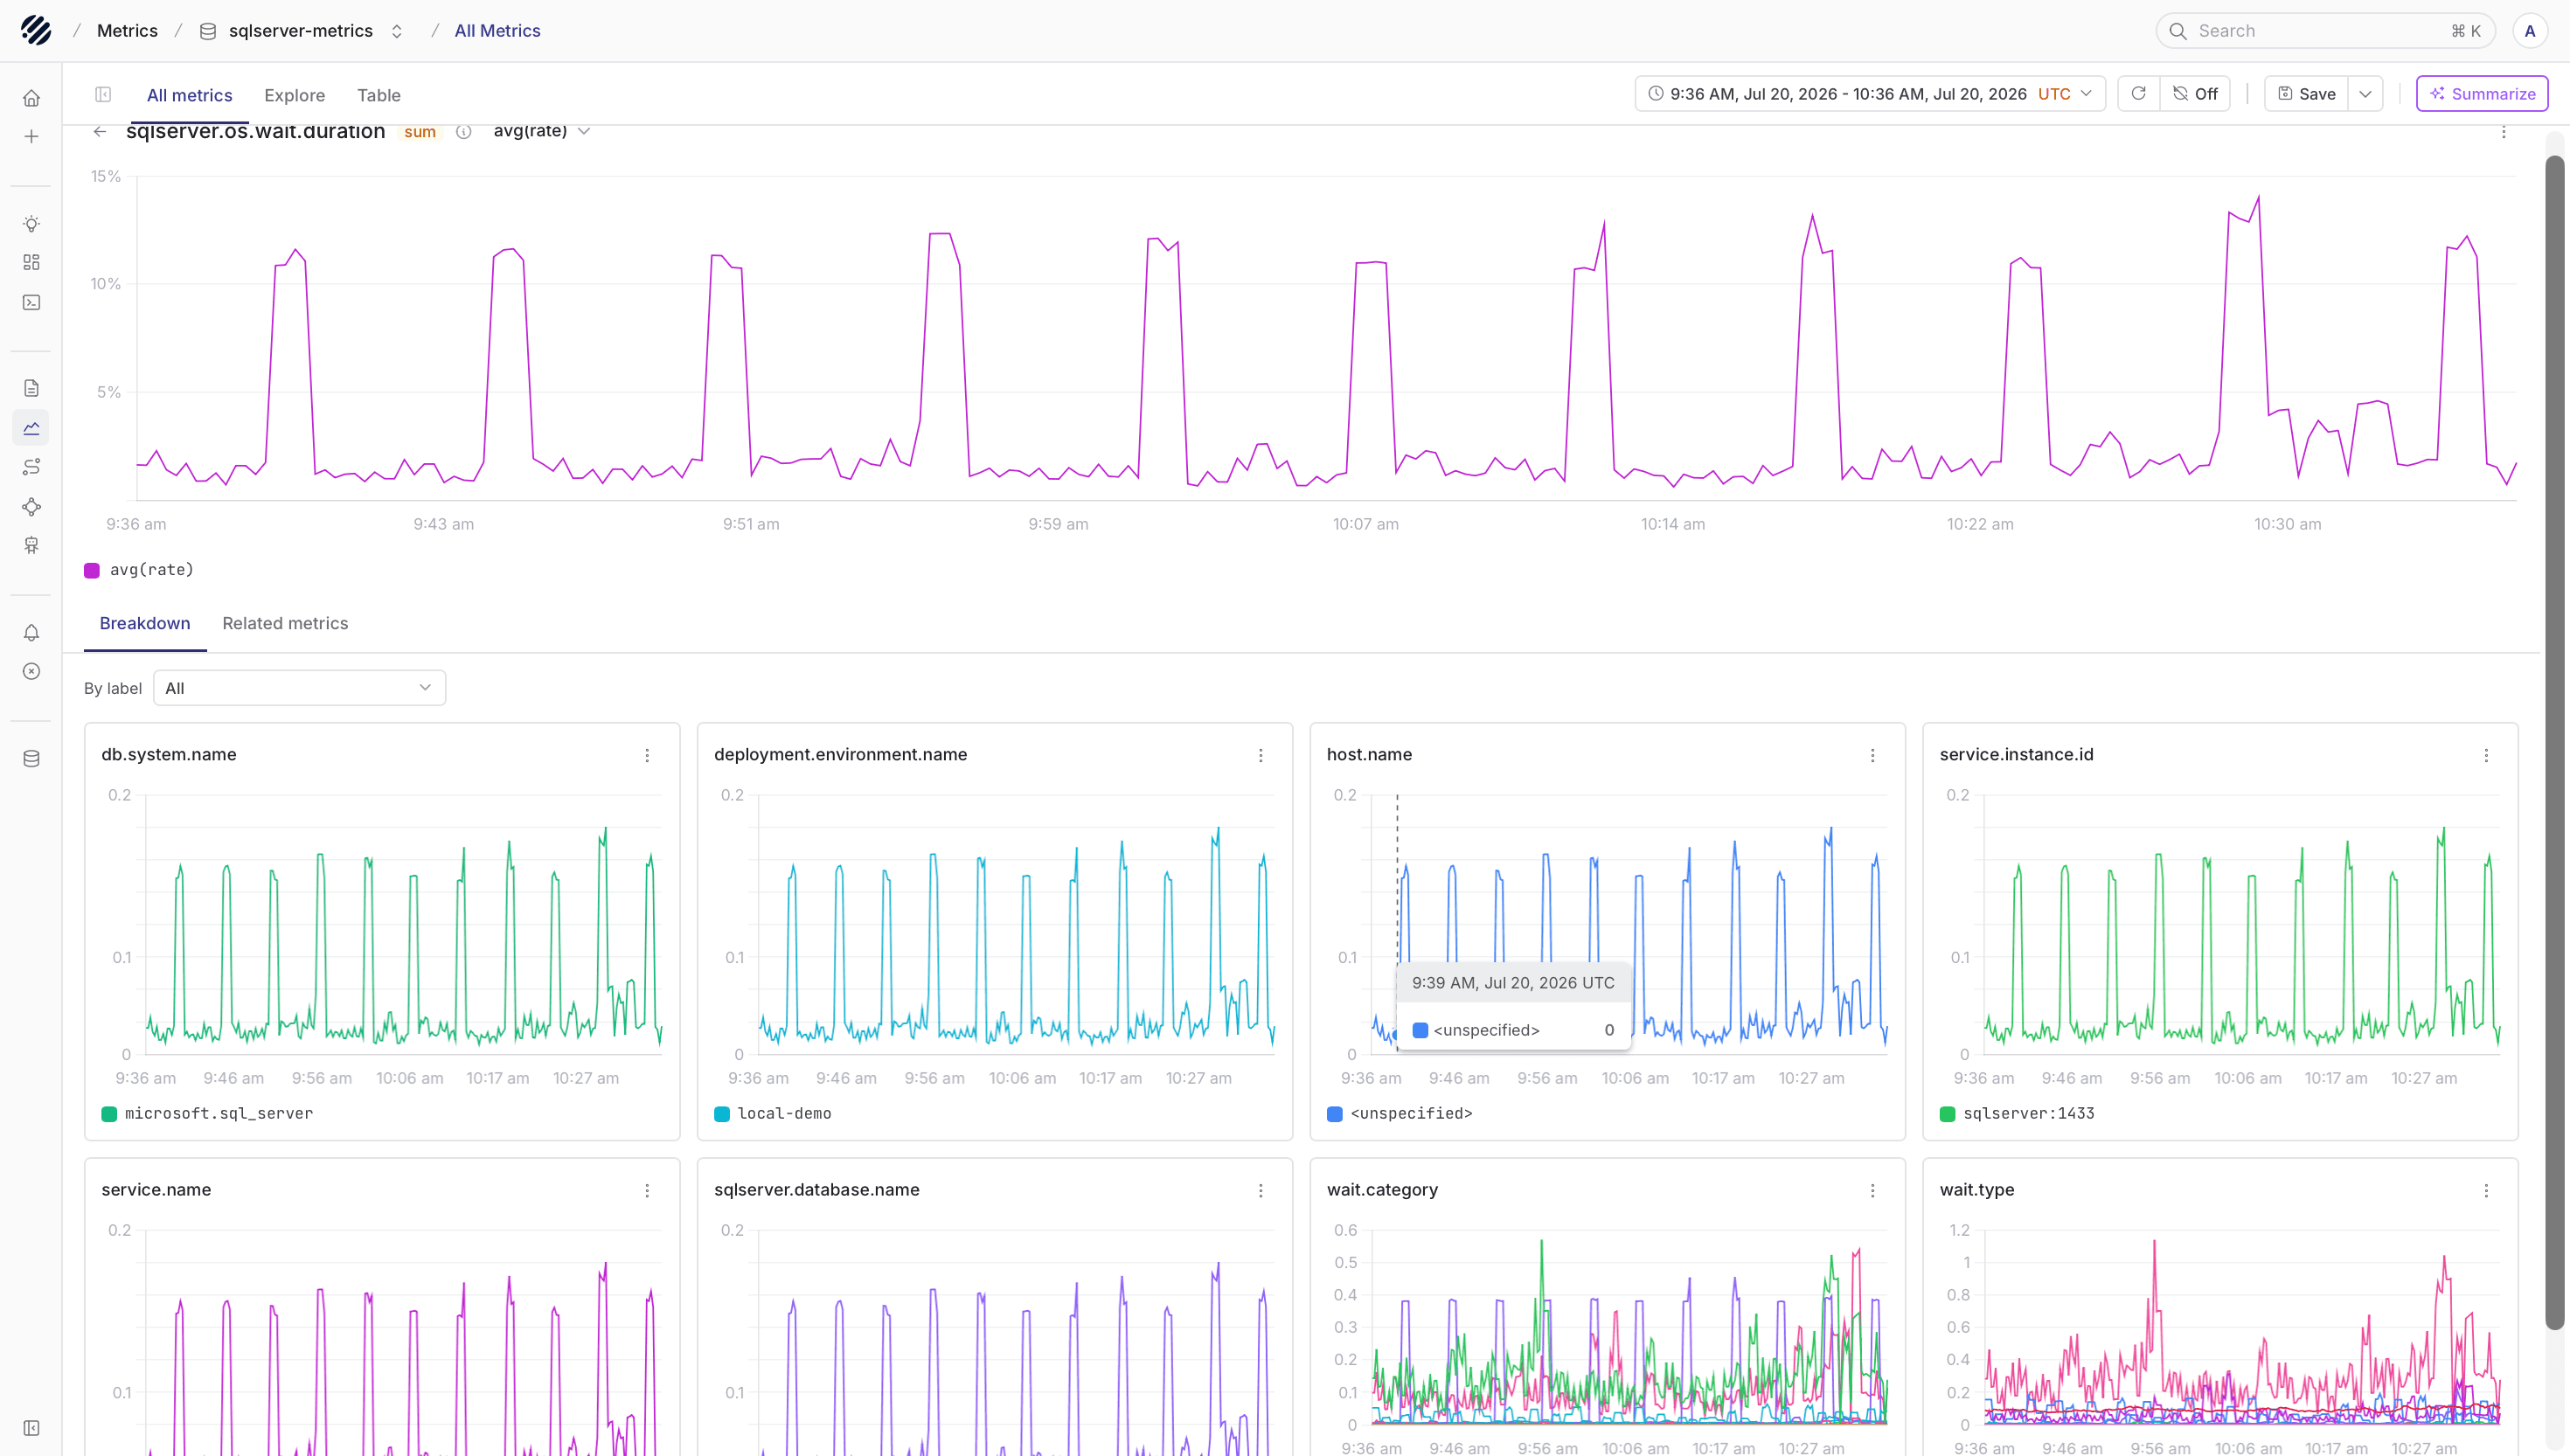
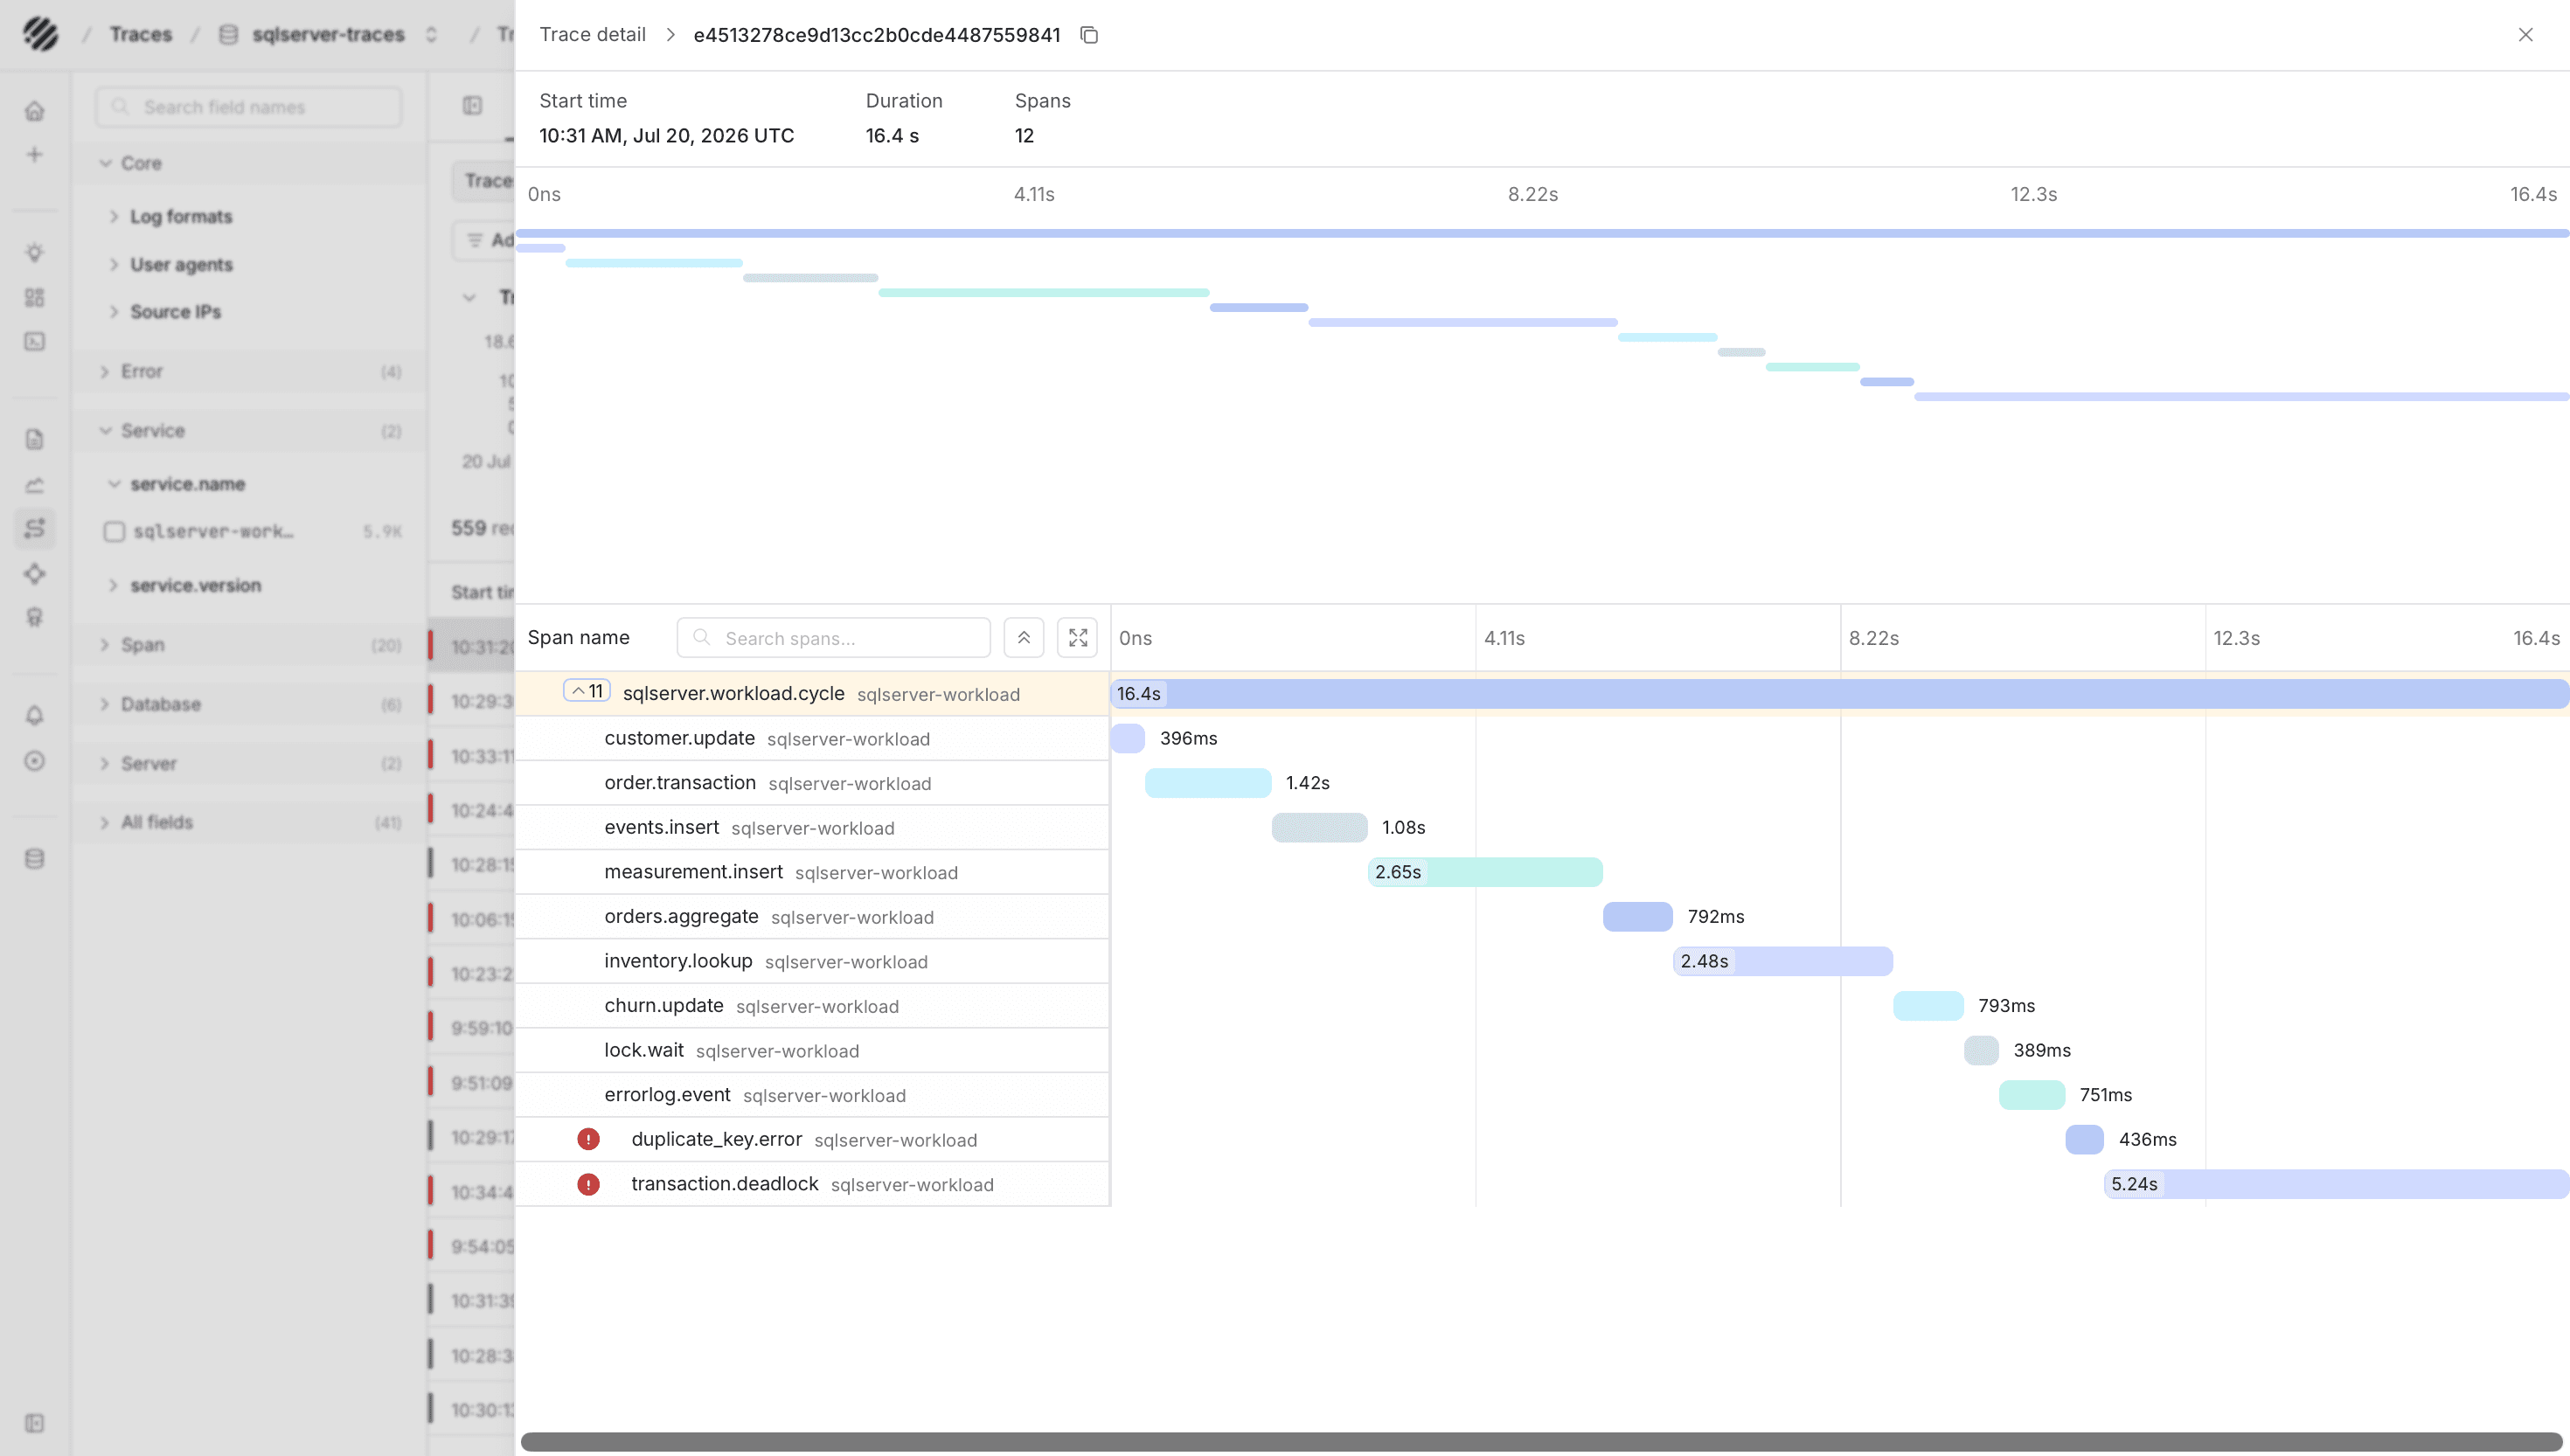
SQL Server data lands in Parseable as logs, metrics, and traces. Use the logs dataset for ERRORLOG and query events, the metrics dataset for SQL Server receiver and custom SQL Query metrics, and the traces dataset for the application spans around T-SQL calls.
Dashboards
Public Parseable dashboard templates are available in parseablehq/dashboards. SQL Server templates may use native sqlserver.*, custom mssql_*, or generic performance-counter families; match the Collector receivers to the template requirements.
Troubleshooting
- SQL Server 2022 and later require
VIEW SERVER PERFORMANCE STATE; earlier releases useVIEW SERVER STATE. - If the Collector reports certificate parsing errors against a development container, configure a valid SQL Server certificate. Do not disable certificate validation in production.
- An HTTP
405from Parseable normally means the exporter is pointed at the query/UI endpoint rather than the ingestor. - If query events produce log schema errors, keep ERRORLOG and query events in separate pipelines and normalize the query-event body as shown above.
Was this page helpful?