
AIOps platforms group alerts, detect anomalies, investigate incidents and automate response. This guide compares 10 AIOps software platforms and tools by AI workflow, integrations, deployment and pricing. The order follows those workflows and does not represent an overall score.
Parseable publishes this comparison. Capabilities and pricing for these AIOps vendors are based on public documentation reviewed in September 2026.
What is AIOps?
- AIOps meaning: Artificial intelligence for IT operations.
- Inputs: Alerts, events, metrics, logs, traces, topology, changes and tickets.
- Outputs: Correlated incidents, likely causes, affected services and recommended actions.
- Goal: Reduce investigation time and alert noise without hiding evidence.
AIOps versus observability
- Observability: Collects and explores telemetry to explain system behavior.
- AIOps: Correlates that data, suggests causes and supports incident response.
- Combined approach: Use an enterprise observability platform as the telemetry system of record and AIOps for investigation or automation.
- Architecture check: Confirm whether the product replaces your telemetry backend or works above existing tools.
Where these tools fit
AIOps now covers several distinct workflows. Parseable, Grafana Cloud, Datadog and New Relic investigate telemetry inside an observability platform. Dynatrace emphasizes causal analysis. Splunk ITSI and BigPanda correlate events across operational systems, while ServiceNow and IBM connect incidents to service-management context. PagerDuty starts with paging and incident response.
Dedicated AI SRE agents that autonomously investigate or remediate incidents form an adjacent category and are not the focus of this comparison.
Decide which workflow is failing before comparing AIOps solutions. A team overwhelmed by duplicate alerts needs a different product from one that already has clean telemetry and wants faster investigation.
10 best AIOps platforms and tools
Parseable: best for MCP-native, AI-assisted observability
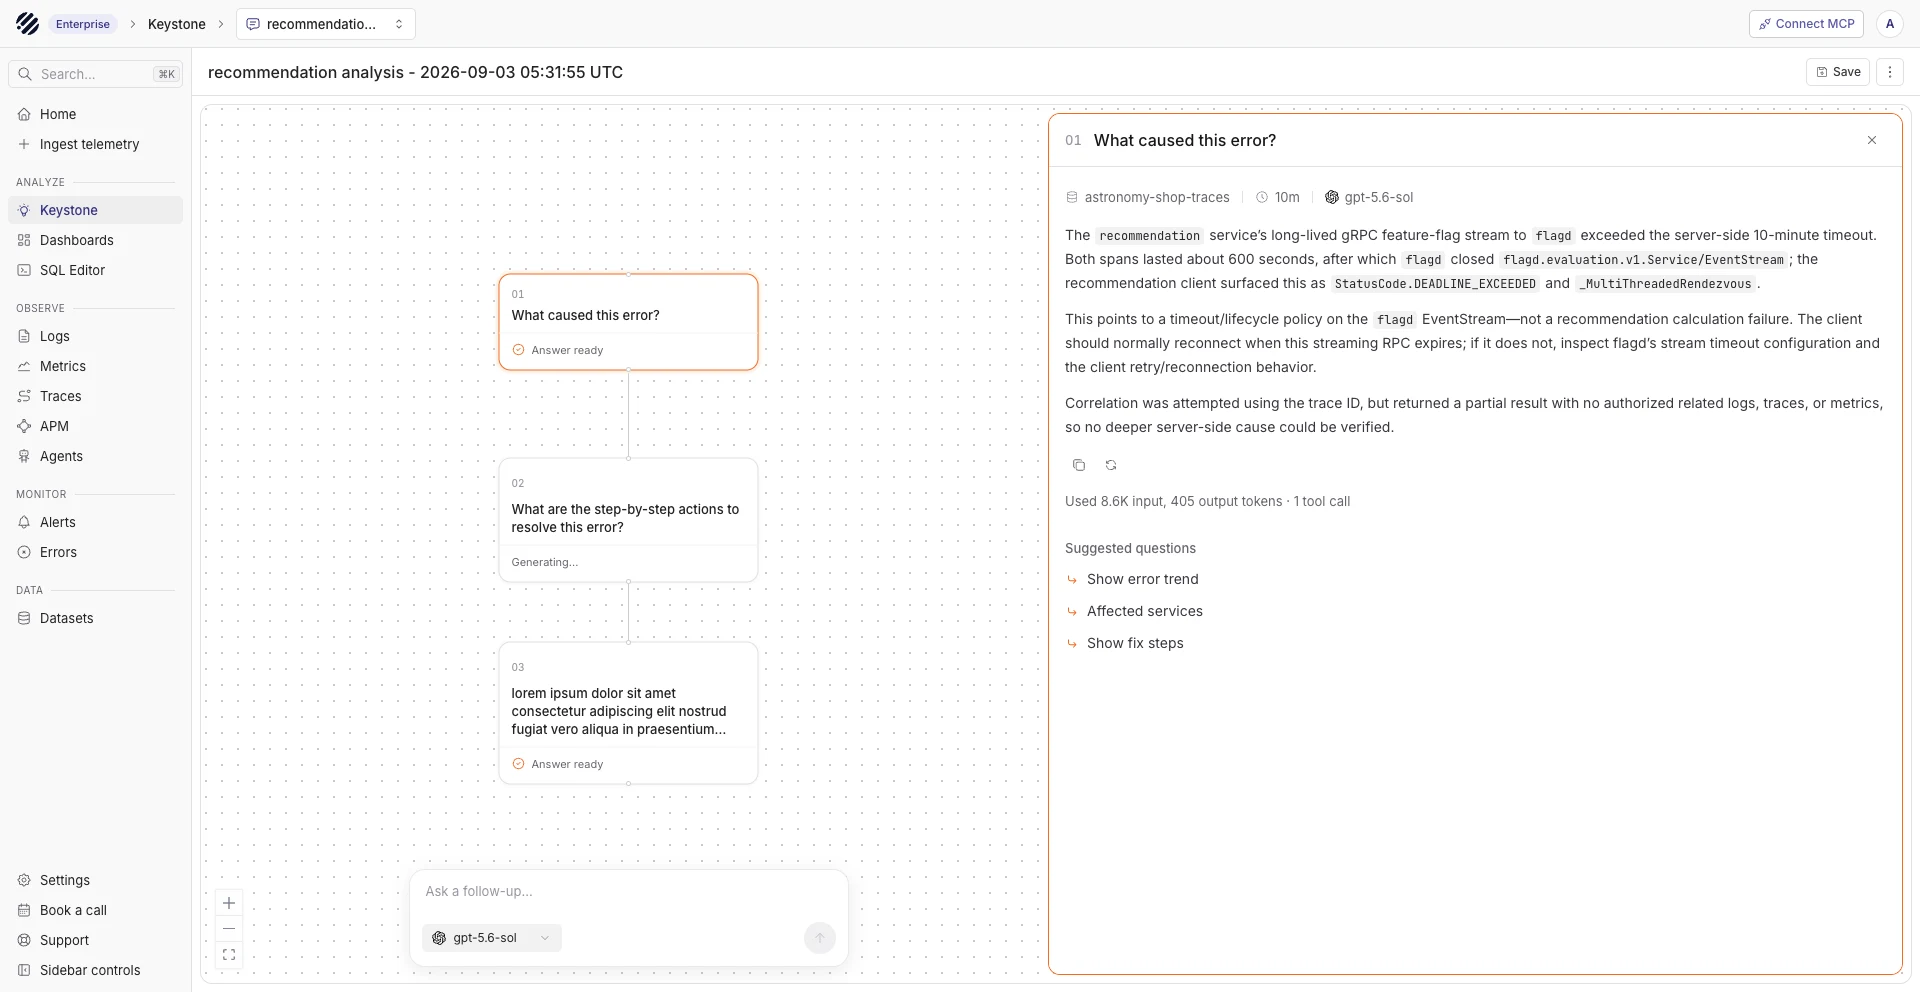
Parseable combines an OpenTelemetry-native backend with Keystone, SQL assistance, summarization and the Parseable MCP Server.
- Best for: MCP-native, AI-assisted investigation across logs, metrics and traces.
- Keystone: Converts natural-language questions into SQL-backed, multi-dataset investigations with follow-up analysis.
- MCP: Gives Claude, Codex, Cursor and other MCP clients governed access to live telemetry through 27 bounded tools.
- AI features: Includes Text-to-SQL, query explanation and dataset summarization.
- Data control: Supports Cloud, BYOC and self-hosted deployment with object-storage retention.
- Choose when: Your logs, metrics and traces already follow an OpenTelemetry data path and engineers want to investigate them through SQL, natural language or an MCP client.
- Watch for: Cross-vendor event correlation and CMDB workflows are less mature than specialist enterprise tools. Production actions require explicit permissions and human review.
- Pricing: See Parseable pricing for ingest, retention and deployment terms.
Dynatrace: best for causal analysis across complex applications
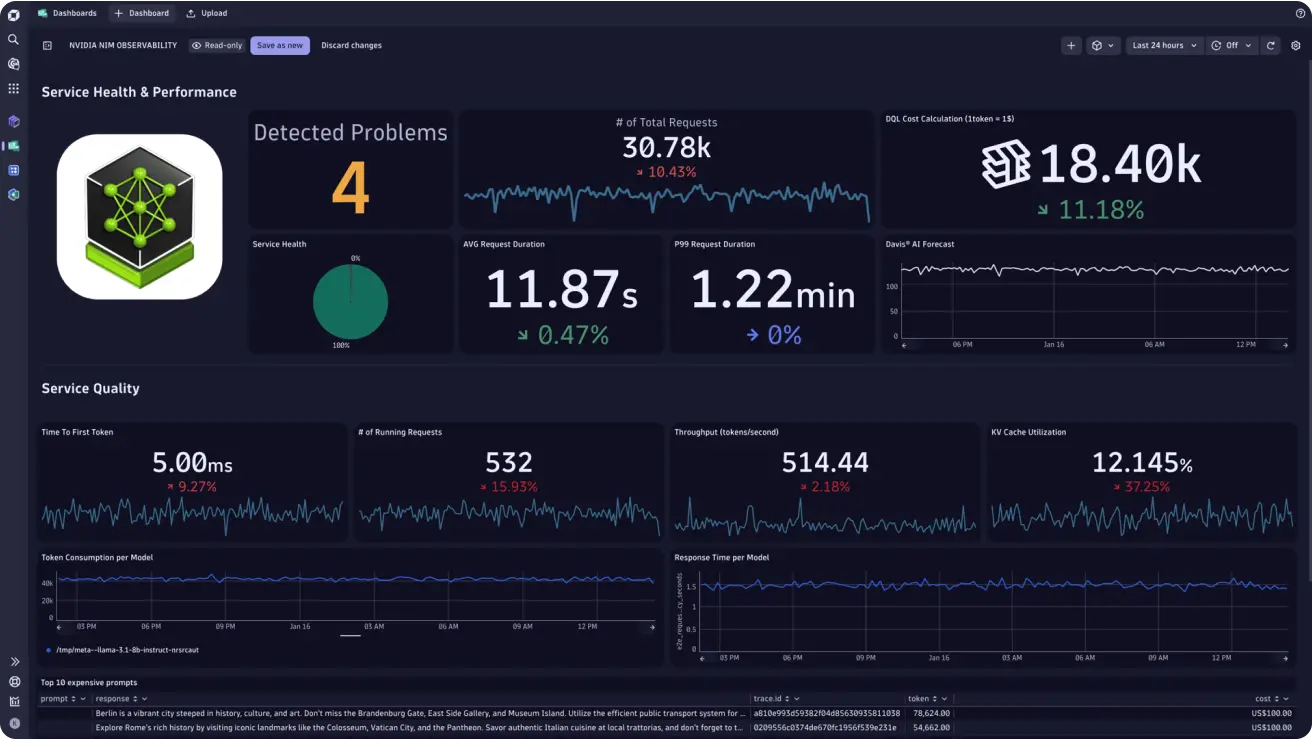
Dynatrace Davis AI combines predictive, causal and generative techniques with the topology and telemetry held in the Dynatrace platform. Its strongest fit is an application estate where OneAgent and Smartscape already provide consistent dependency context.
- Best for: Causal analysis across complex application estates.
- Investigation: Davis links service dependencies, changes and anomalies to identify likely causes and affected applications.
- Automation: Dynatrace workflows can route findings or trigger approved remediation steps.
- Choose when: You want one managed platform to discover services, retain their topology and investigate incidents against that shared model.
- Watch for: Platform commitment and incomplete coverage of queues, serverless workloads or managed dependencies.
- Pricing: Consumption-based; see Dynatrace pricing.
Datadog: best for teams already using the Datadog platform
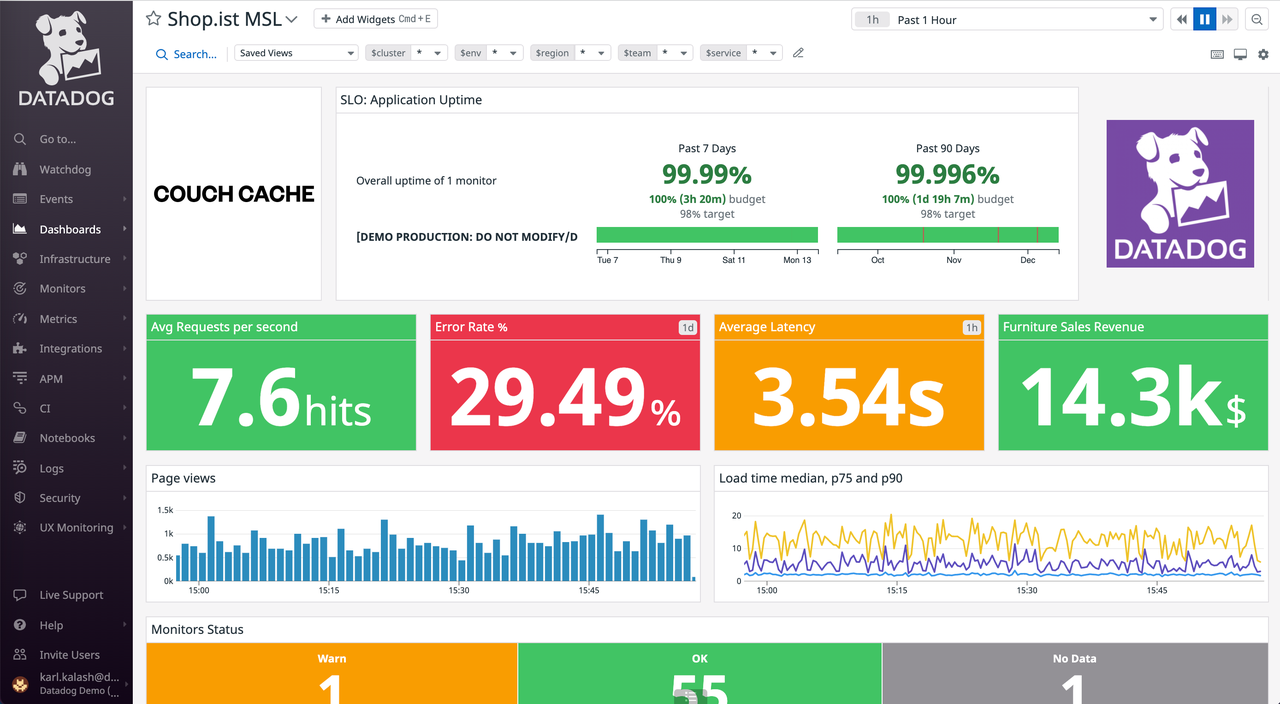
Datadog Bits AI works with Watchdog findings and the telemetry, service ownership and incident data already held in Datadog. Teams can use it to summarize an alert, investigate related signals and support remediation without leaving the platform.
- Best for: Teams already using Datadog infrastructure, APM and logs.
- Investigation: Bits AI can query Datadog data, surface related anomalies and assemble incident context.
- Coverage: Its usefulness grows with the number of Datadog products and integrations deployed across the environment.
- Choose when: Datadog is already the operating console and the main problem is reducing manual investigation inside it.
- Watch for: Coverage and cost vary by licensed module and instrumentation depth.
- Pricing: Product-level billing; see Datadog pricing.
Grafana Cloud: best for open observability and AI investigations
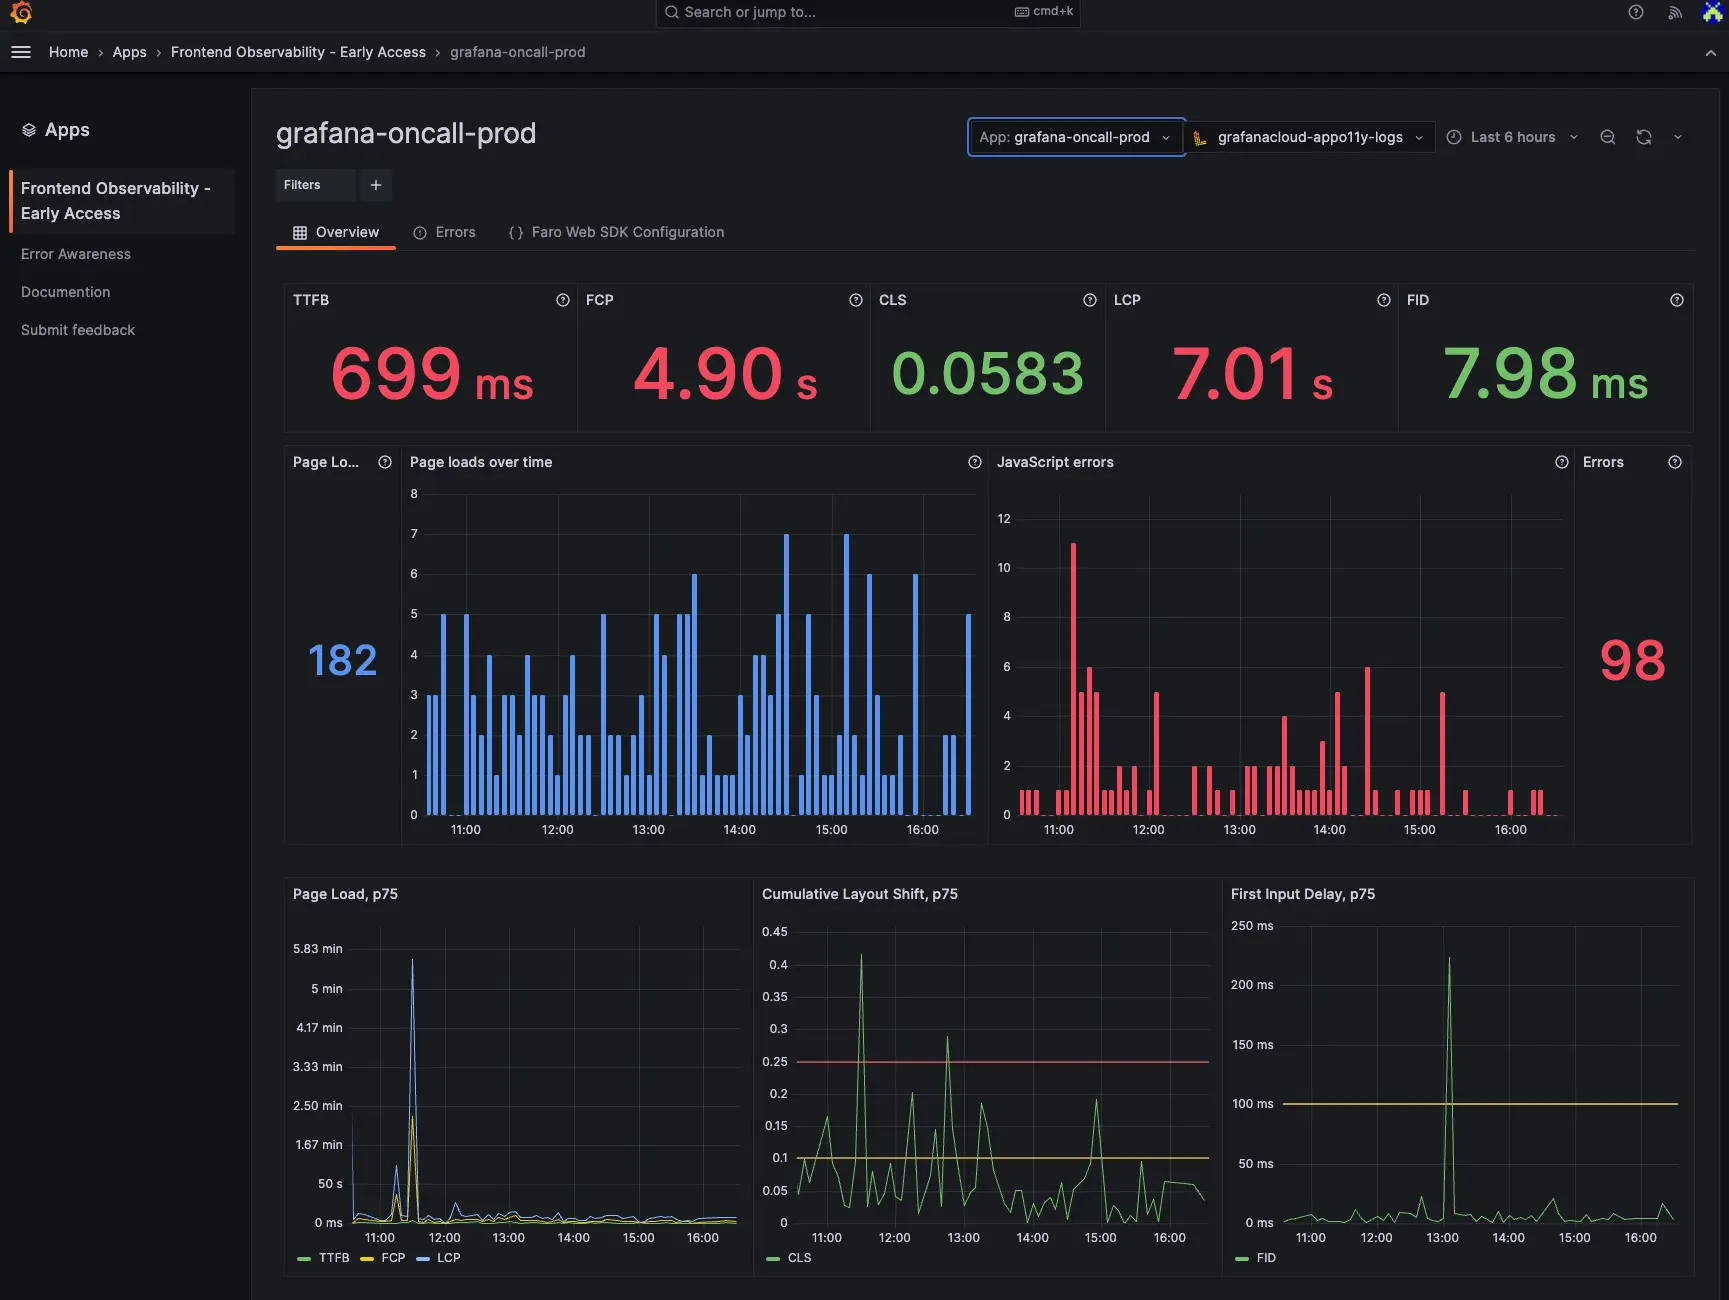
Grafana Cloud Investigations works across metrics, logs, traces and profiles in Grafana Cloud. It tests hypotheses and records the evidence used in an investigation, while Sift focuses on automated checks for Kubernetes and other infrastructure problems.
- Best for: Open observability stacks using Prometheus, Loki and Tempo.
- Investigation: Assistant Investigations explores related signals and produces a report that engineers can inspect rather than only a short summary.
- Ecosystem: Existing Grafana dashboards and open telemetry backends provide a familiar starting point.
- Choose when: The team already works in Grafana Cloud and wants AI assistance without changing its Prometheus, Loki or Tempo workflow.
- Watch for: Advanced AI workflows require Grafana Cloud entitlements, and correlation may span several data sources.
- Pricing: Free tier; Pro starts at $19 per month plus usage. See Grafana pricing.
- Related: Grafana alternatives, Grafana Loki vs Parseable and Grafana vs Datadog.
New Relic: best for application-centric AI investigation
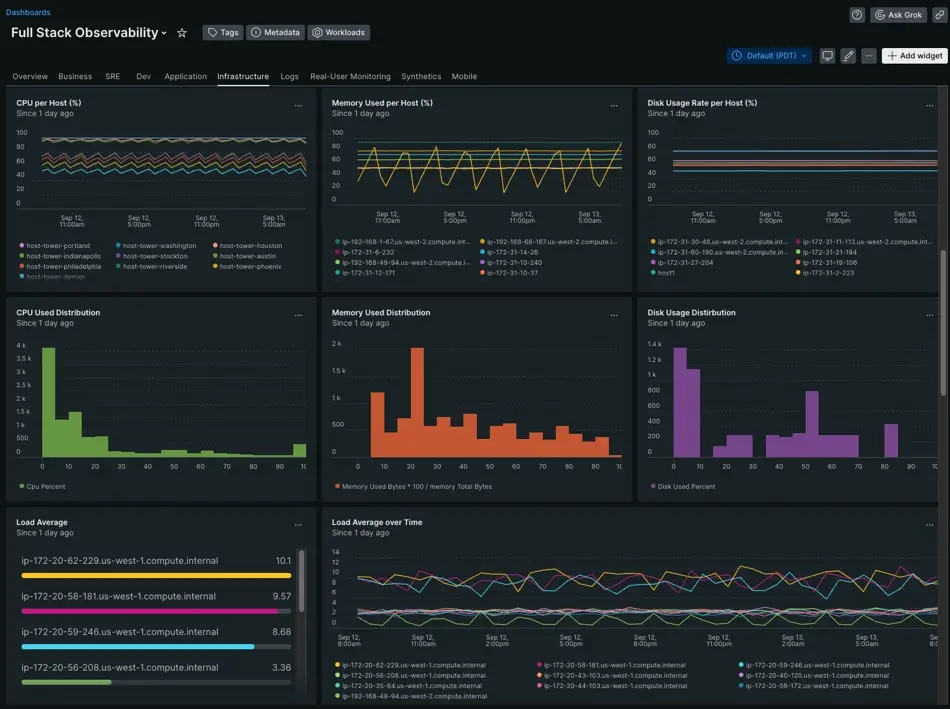
New Relic AI applies natural-language analysis and recommended actions to application and infrastructure data in New Relic. Its application-centric model suits teams that begin an incident with a service, transaction or deployment rather than a cross-vendor event queue.
- Best for: Application teams using New Relic APM, logs and NRQL.
- Investigation: Engineers can move from an anomaly or alert into related telemetry and root-cause suggestions.
- Context: APM entities, changes and NRQL data give the investigation its application context.
- Choose when: New Relic already contains the application data and ownership model used during incidents.
- Watch for: AI uses Advanced Compute, and results depend on instrumentation coverage.
- Pricing: Free 100 GB monthly ingest allowance; see New Relic pricing.
Splunk IT Service Intelligence: best for Splunk-centered operations
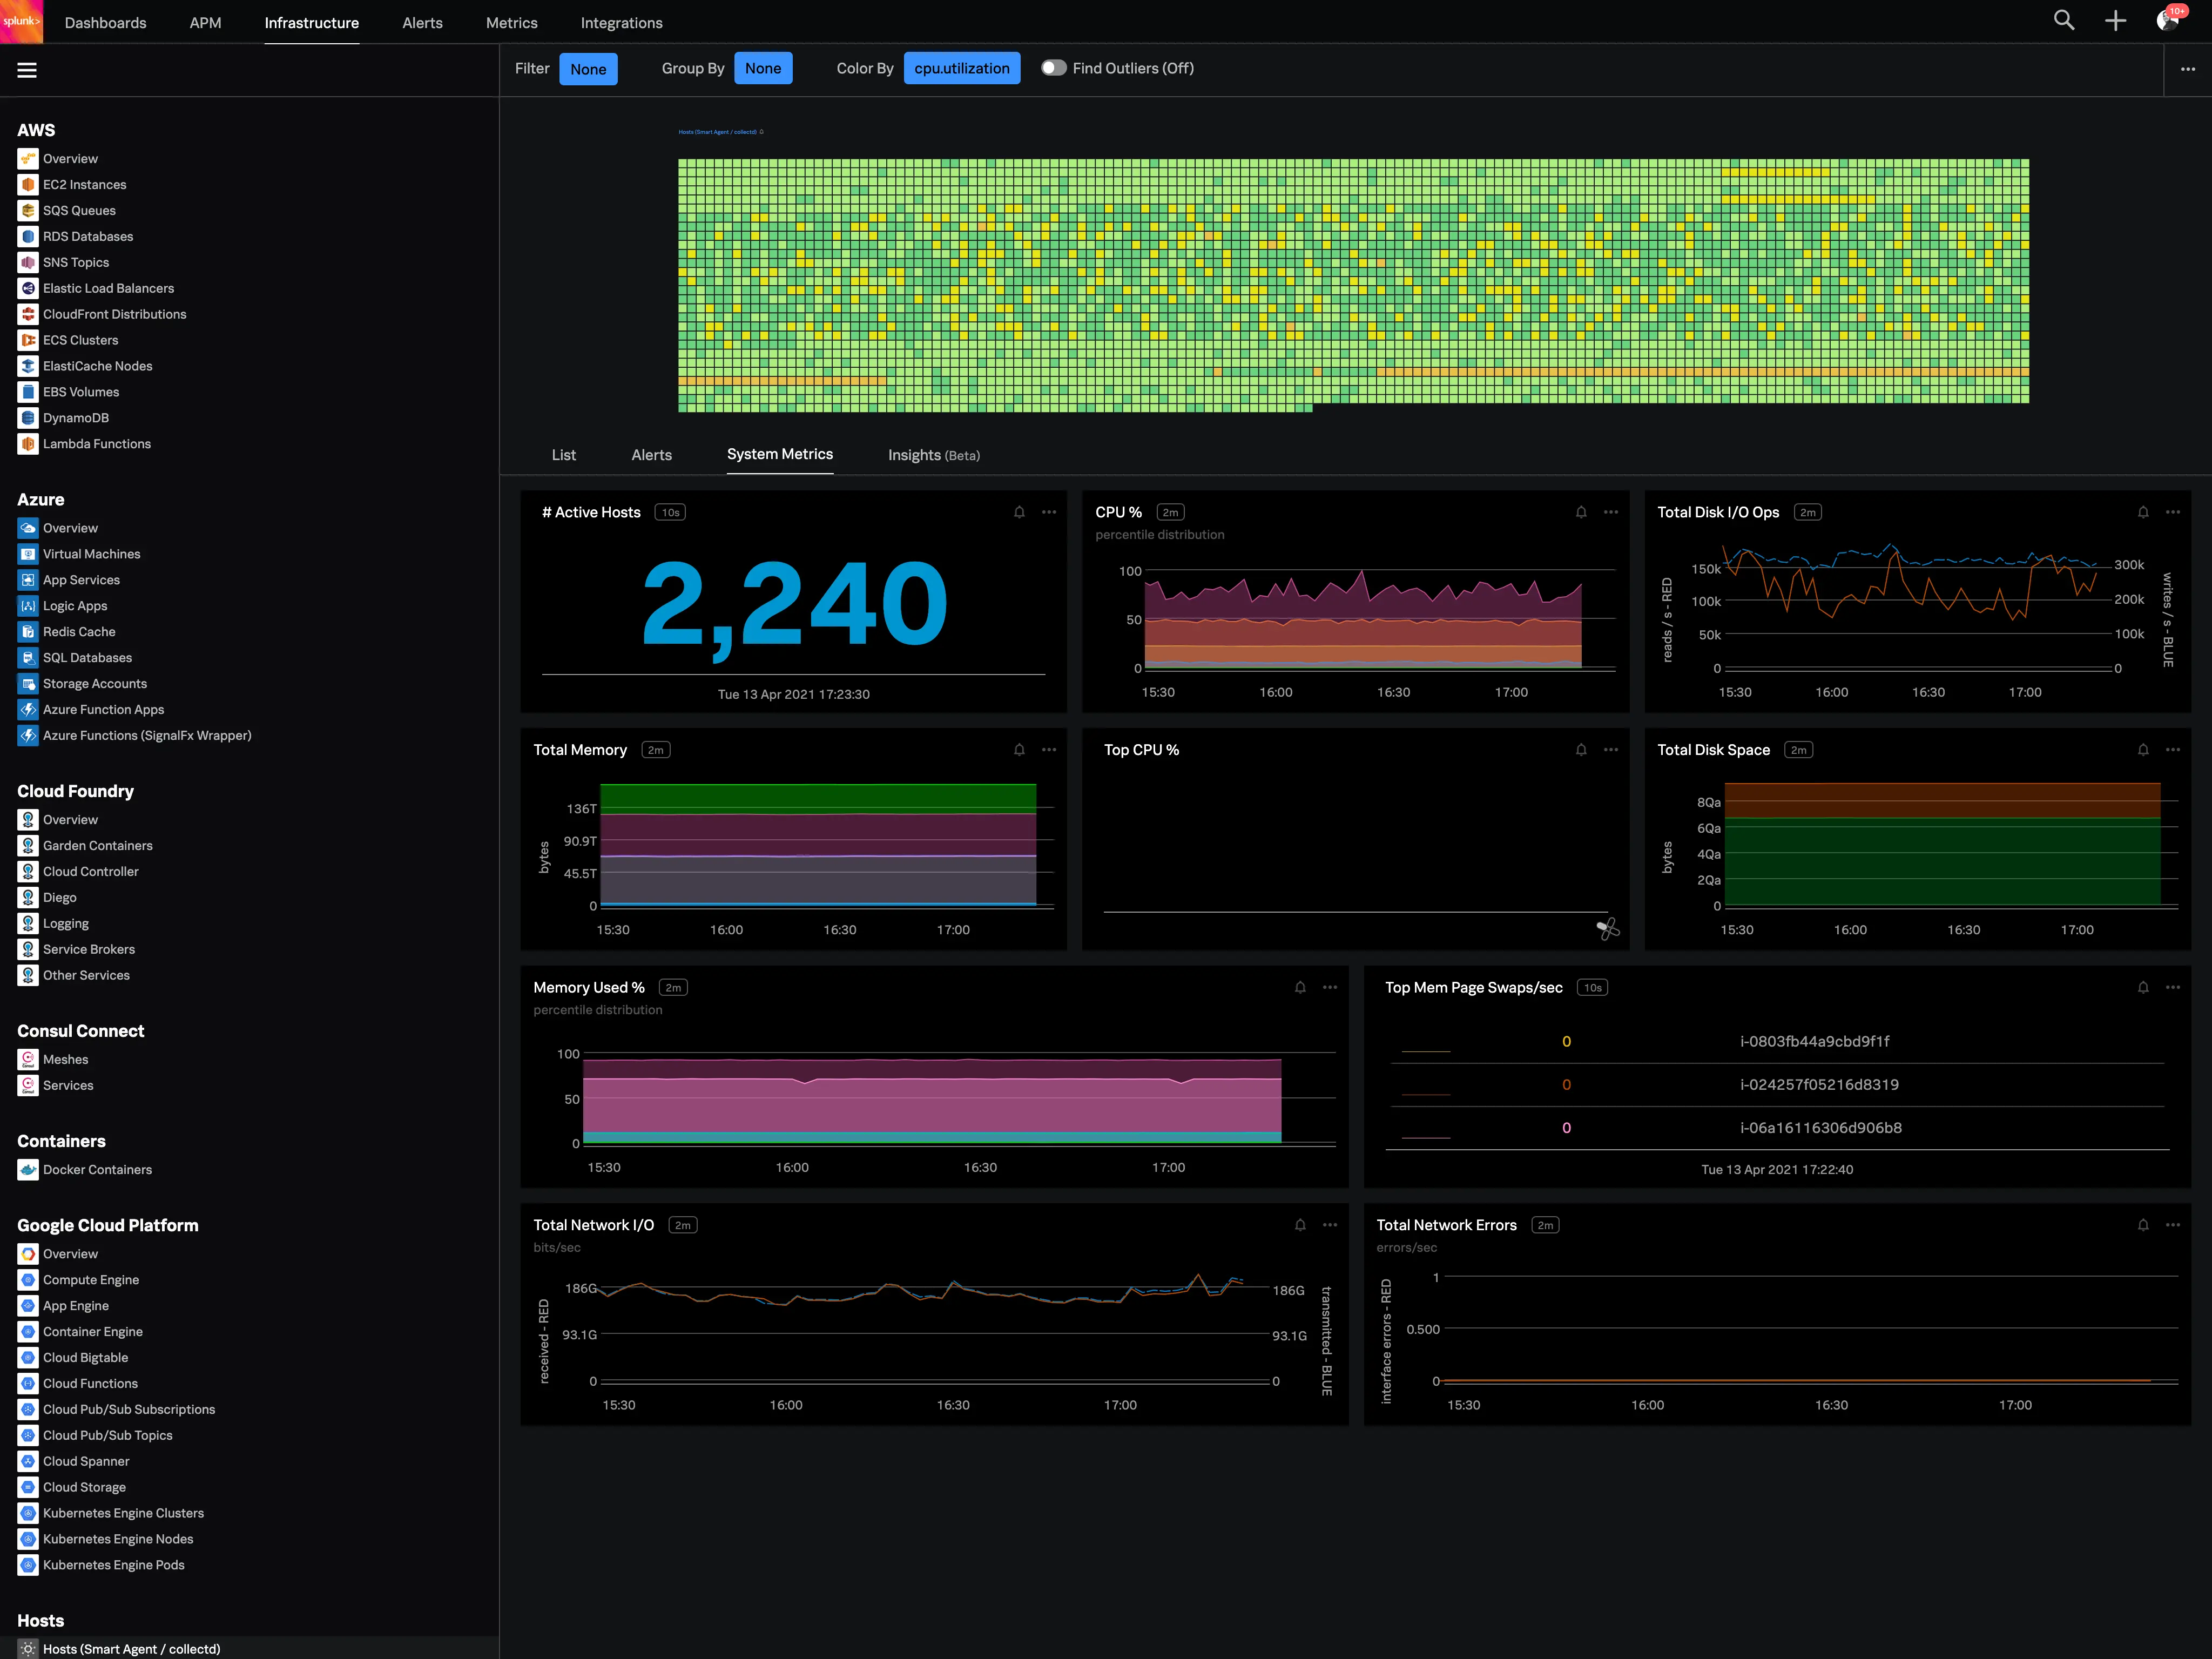
Splunk IT Service Intelligence builds service-health views from Splunk searches, KPIs and events. It is designed for operations teams that want event analytics and business-service context on top of data already indexed in Splunk.
- Best for: Enterprises with established Splunk data and searches.
- Correlation: ITSI groups notable events and uses service dependencies to narrow probable causes.
- Service context: KPIs and service models connect technical symptoms to business impact.
- Choose when: Splunk is the operational data platform and the team is prepared to maintain service models and KPI searches.
- Watch for: Service models require maintenance, and workflows may span several Splunk products.
- Pricing: Custom quote based on data, infrastructure, ITSI and support.
PagerDuty AIOps: best for paging and incident-response workflow
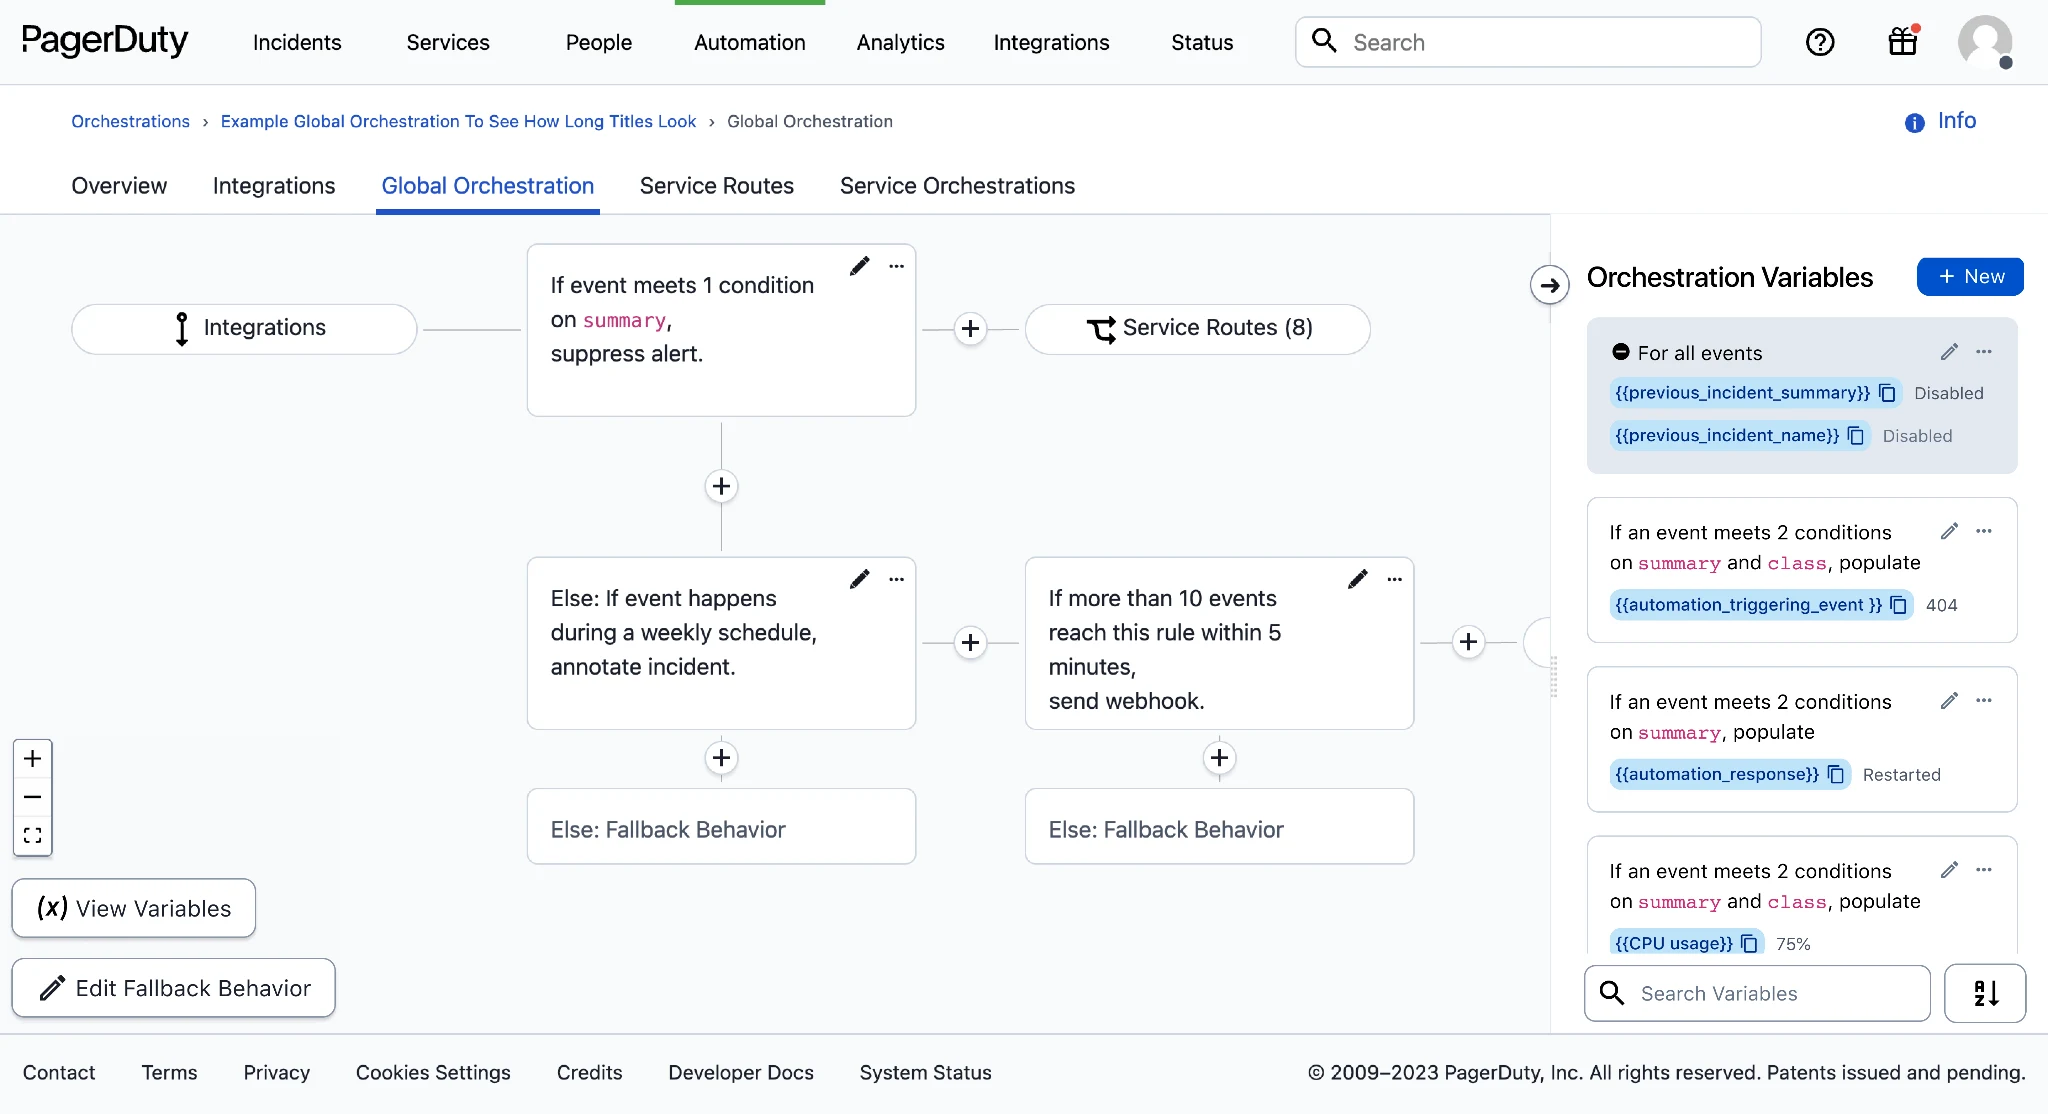
PagerDuty AIOps receives events from monitoring tools, groups related signals and applies orchestration before responders are paged. It belongs downstream of telemetry collection: the product improves how incidents are created and handled rather than replacing log, metric or trace analysis.
- Best for: Alert reduction and on-call incident response.
- Correlation: Event grouping and suppression reduce duplicate notifications reaching on-call teams.
- Automation: Event Orchestration can route incidents and start predefined diagnostic or remediation workflows.
- Choose when: The operational pain is noisy paging, routing or repetitive incident-response work across several monitoring sources.
- Watch for: Incoming event quality controls results; PagerDuty does not replace telemetry analytics.
- Pricing: Starts at $699 per month, billed by accepted events. See PagerDuty AIOps pricing.
IBM Cloud Pak for AIOps: best for hybrid enterprise operations
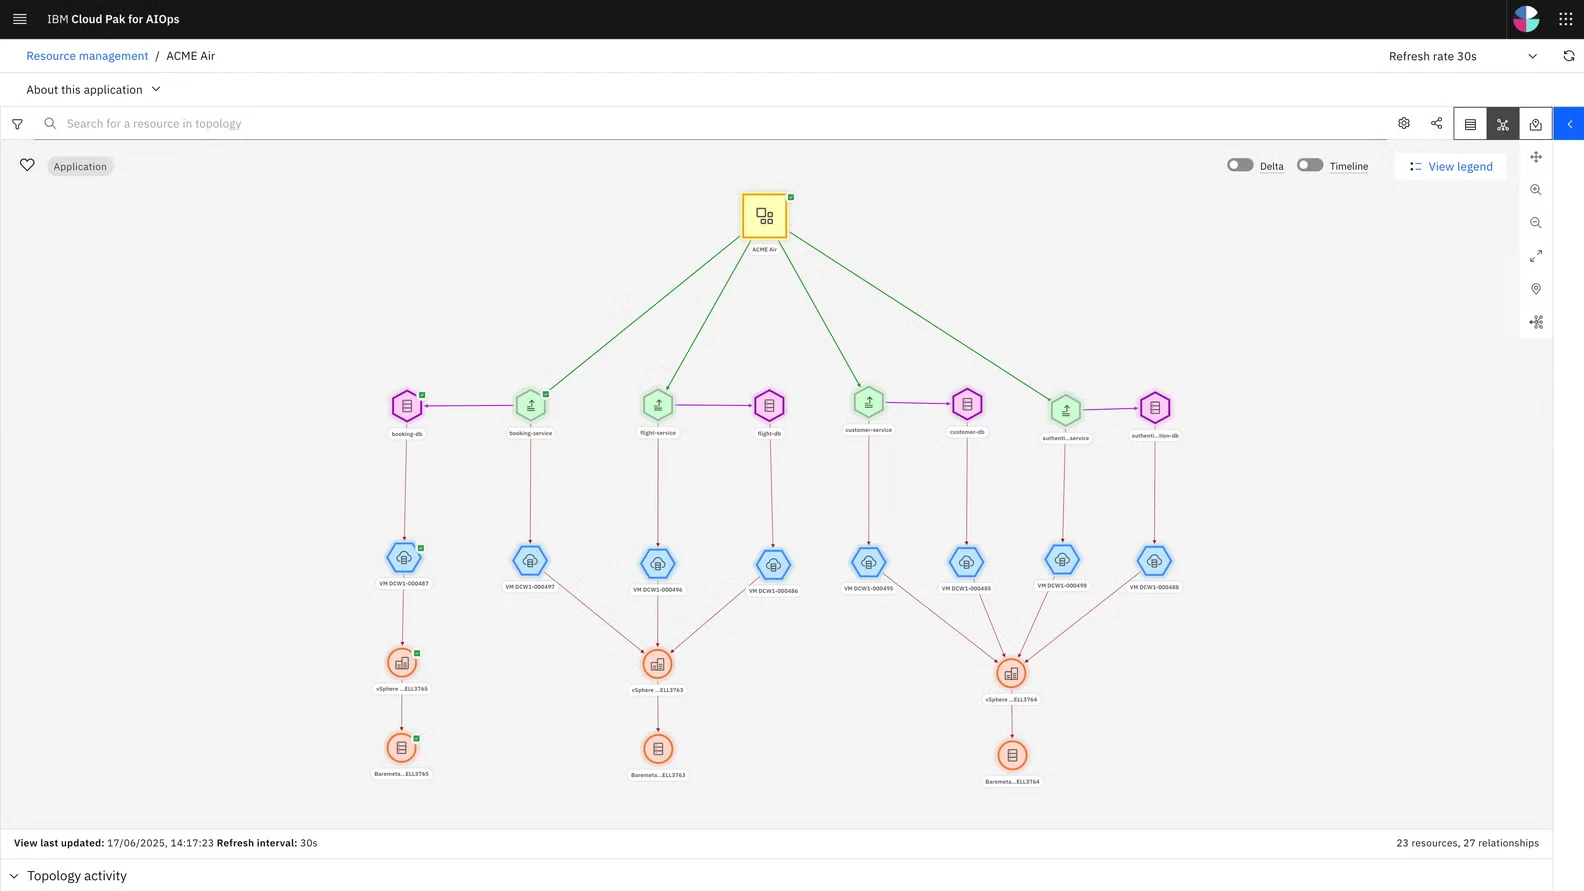
IBM Cloud Pak for AIOps combines operational events, topology and automation in an OpenShift-based deployment. It targets large hybrid environments where incidents cross infrastructure domains and several existing management products.
- Best for: Hybrid enterprises with several management tools.
- Correlation: The platform groups events and uses topology to connect symptoms with affected resources and services.
- Automation: Incident similarity and runbook recommendations help operations teams reuse earlier responses.
- Choose when: Data sovereignty, hybrid infrastructure and integration with established enterprise operations tooling matter more than a lightweight rollout.
- Watch for: OpenShift deployment, connectors and topology require significant implementation work.
- Pricing: Modular workload pricing; see IBM pricing.
ServiceNow ITOM AIOps: best for ServiceNow-centered IT operations
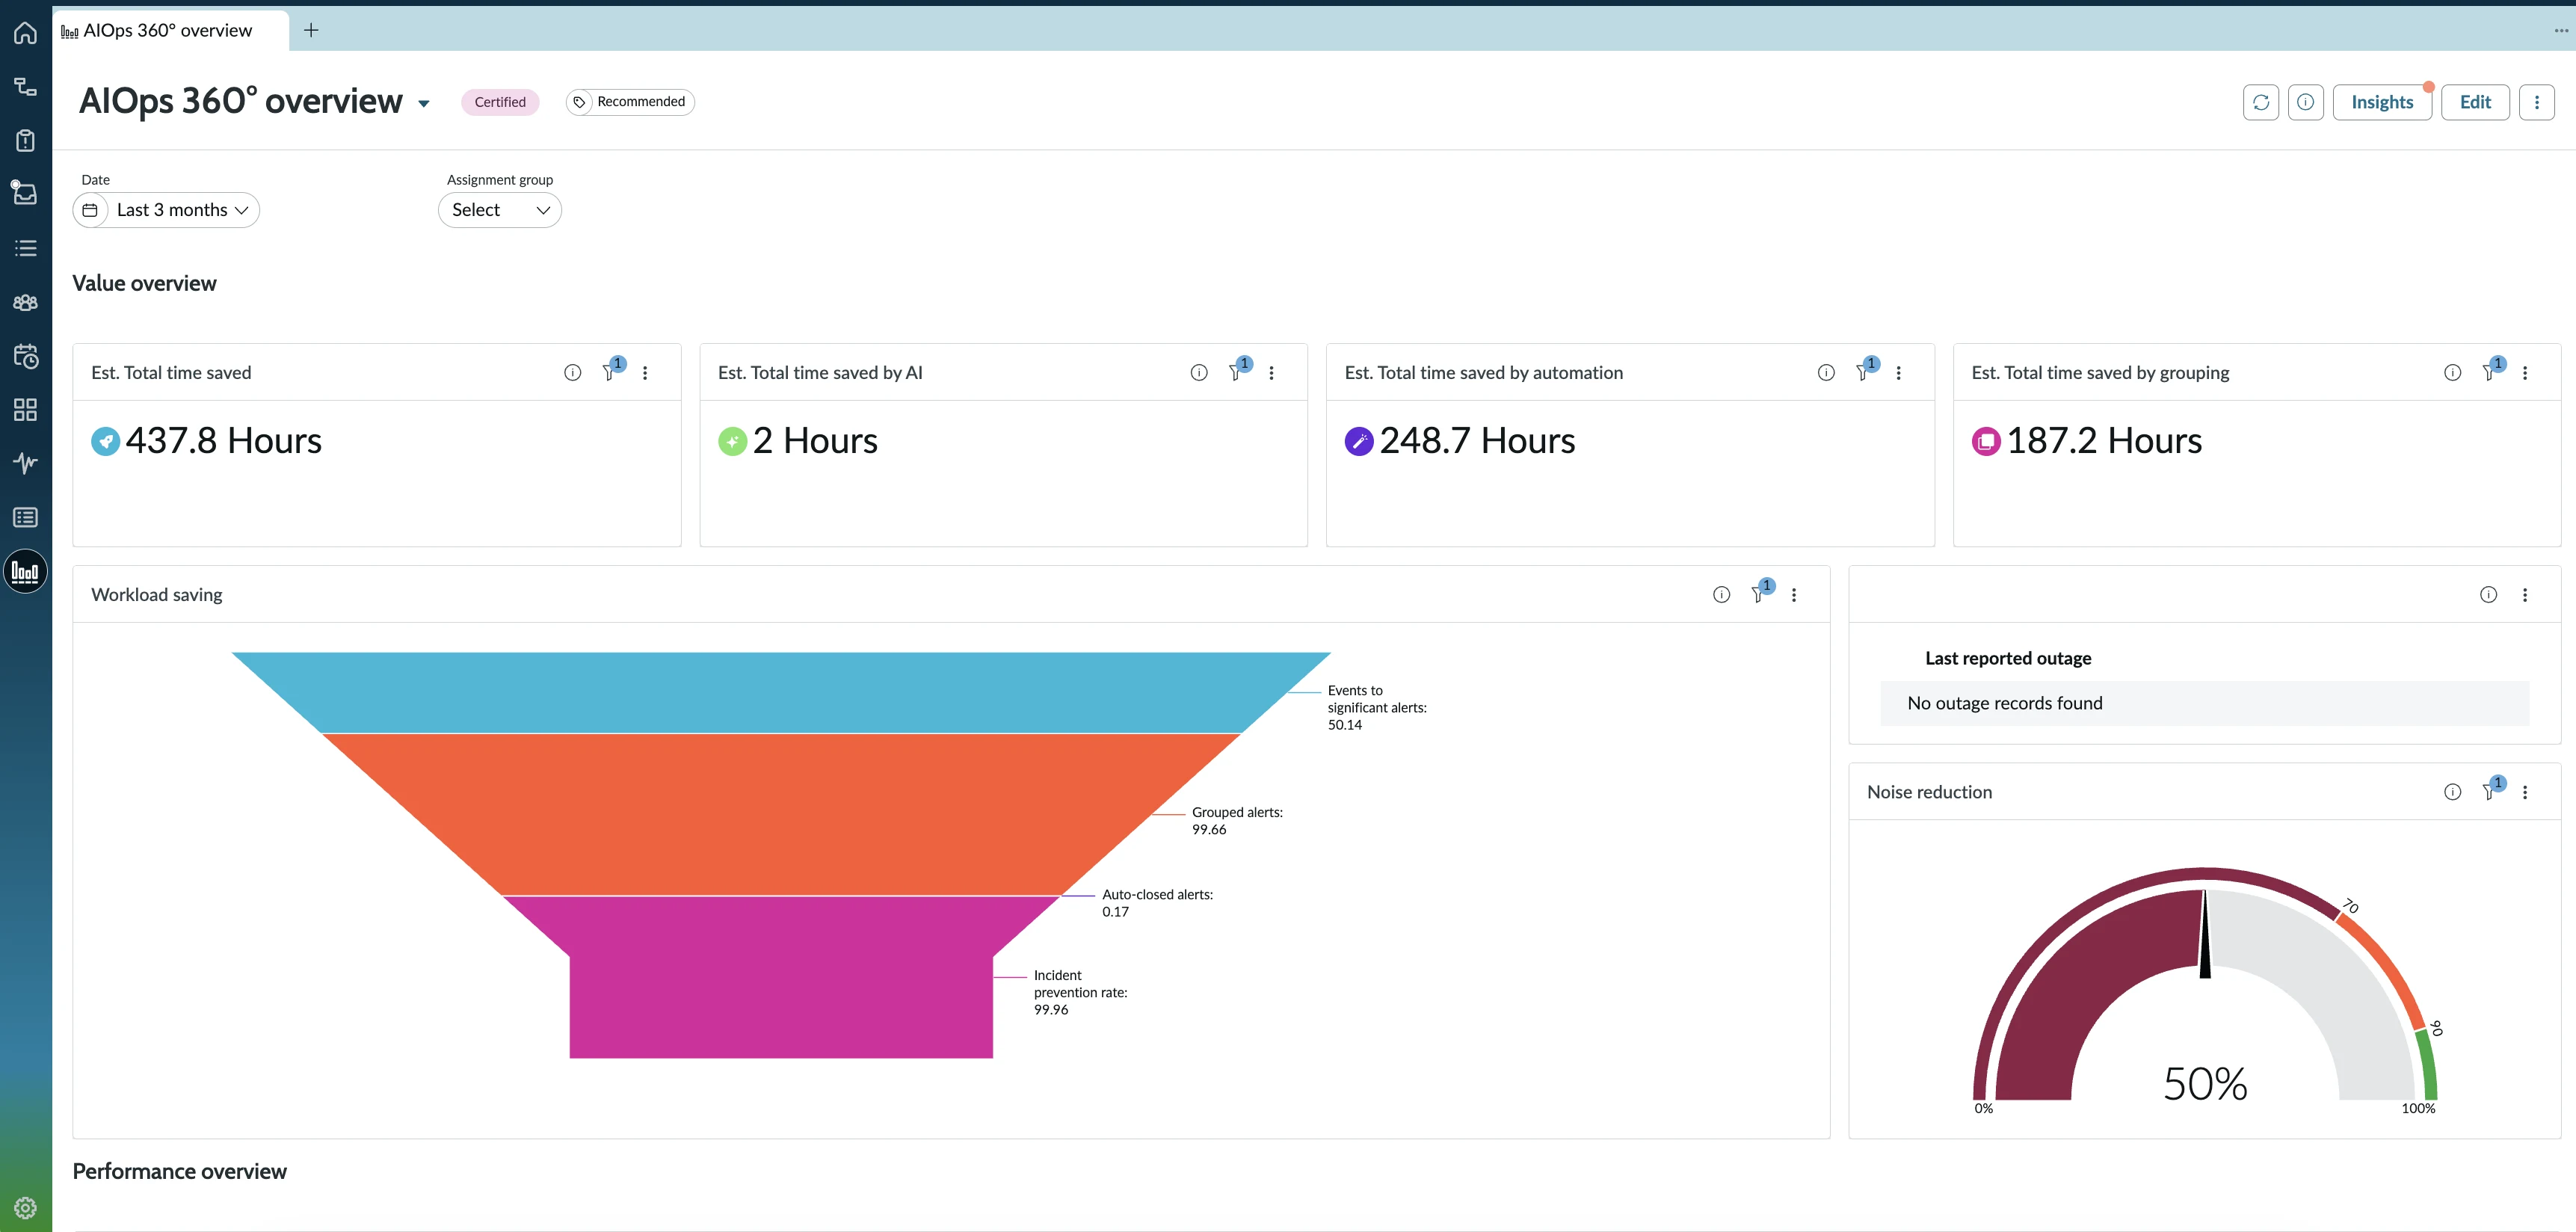
ServiceNow IT Operations Management combines event management with service maps, configuration data and ITSM workflows. Its advantage is connecting an operational signal to the affected service, change record, owner and response process.
- Best for: ServiceNow environments built around ITSM and CMDB data.
- Correlation: Events can be grouped and prioritized using service relationships and operational context.
- Workflow: Incidents, changes and automation remain inside the ServiceNow operating model.
- Choose when: The CMDB and ServiceNow workflows are already maintained well enough to provide reliable incident context.
- Watch for: Results depend on CMDB accuracy and maintained service mapping.
- Pricing: Custom ITOM packaging and implementation quote.
BigPanda: best for vendor-neutral event correlation
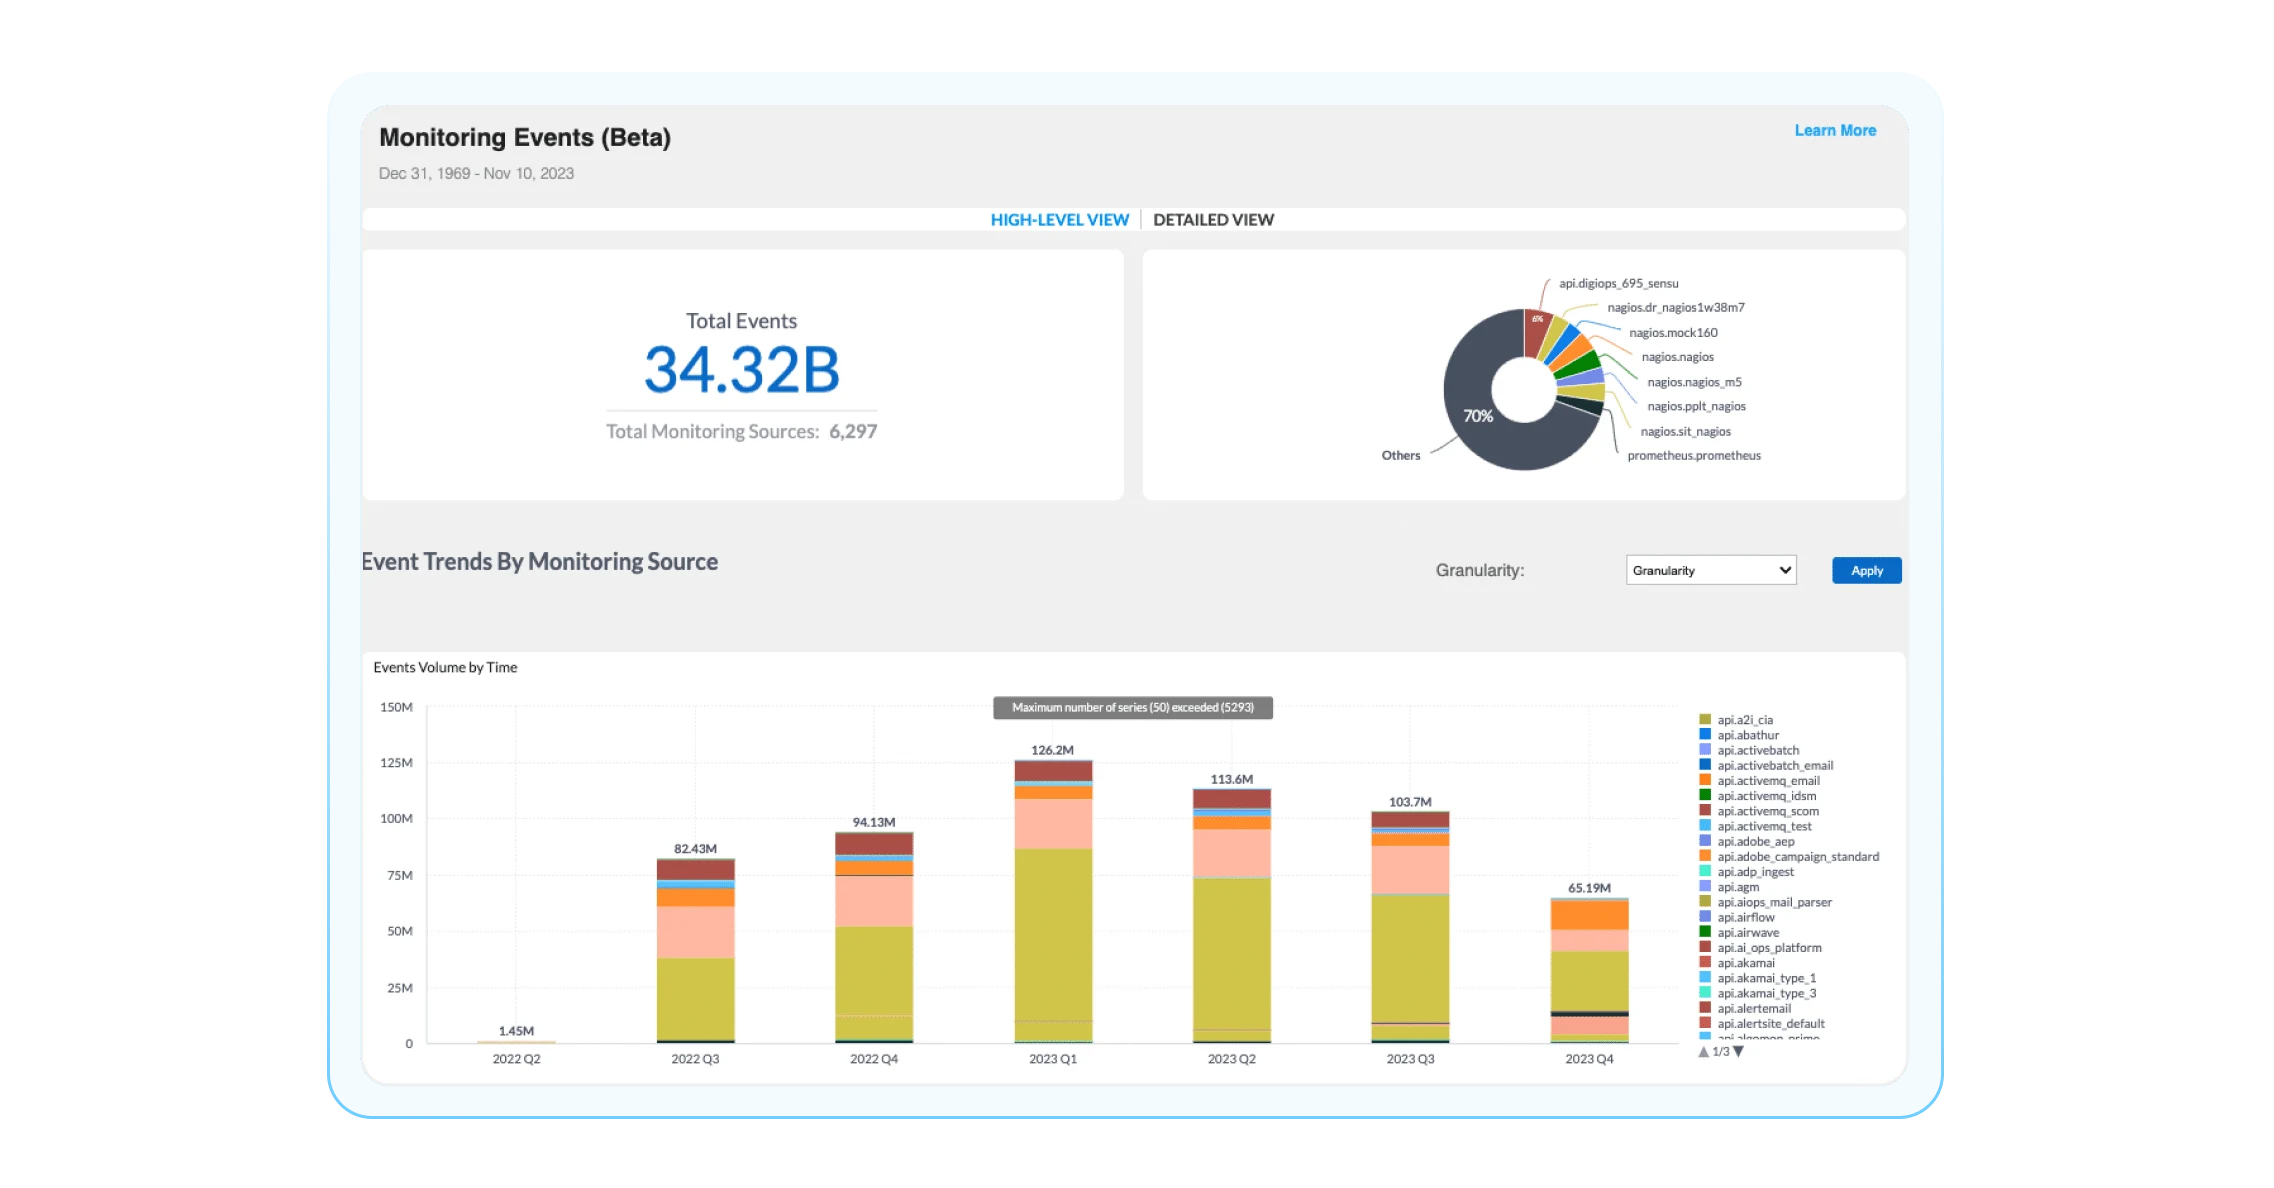
BigPanda sits above monitoring and observability products to normalize their events into a common operational layer. It is a focused option for organizations whose hardest problem is correlating alerts across vendors rather than querying the underlying telemetry in another backend.
- Best for: Vendor-neutral event correlation across monitoring tools.
- Correlation: Normalization and enrichment make signals from different products comparable before they are grouped.
- Operations context: Topology and change integrations help attach ownership and probable impact to an incident.
- Choose when: Several monitoring platforms feed the same operations center and duplicate or fragmented events slow triage.
- Watch for: Source normalization and topology integrations require careful setup. Test for missed incidents.
- Pricing: Custom enterprise quote based on event scale, connectors and support.
AIOps platforms comparison table
Use this table to build a shortlist, then replay real incidents in each product.
| Platform | AI strength | Best for | Deployment | Primary data source |
|---|---|---|---|---|
| Parseable | Keystone + MCP | Telemetry investigation | Cloud / BYOC / self-hosted | Logs, metrics and traces |
| Dynatrace | Davis causal AI | Complex applications | Cloud / managed | Dynatrace topology and telemetry |
| Datadog | Watchdog + Bits AI | Datadog users | SaaS | Datadog telemetry and incidents |
| Grafana Cloud | Assistant + Sift | Open observability | SaaS | Prometheus, Loki, Tempo and profiles |
| New Relic | AI + Autopilot | Application investigation | SaaS | New Relic entities and telemetry |
| Splunk ITSI | Event analytics | Splunk users | Cloud / self-managed | Splunk events, searches and KPIs |
| PagerDuty AIOps | Noise reduction | On-call response | SaaS | Monitoring and incident events |
| IBM Cloud Pak | Correlation + runbooks | Hybrid enterprise IT | Self-managed | Events, topology and runbooks |
| ServiceNow ITOM | CMDB-aware AI | ServiceNow environments | SaaS | Events, CMDB and service maps |
| BigPanda | Event correlation | Multi-tool alerting | SaaS | Multi-vendor alerts, changes and topology |
Pricing and packaging change; verify current terms with each vendor.
Conclusion
Choose the workflow first: telemetry investigation, causal analysis, event correlation or ITSM automation. Shortlist two products and replay the same incidents before enabling write access or automated remediation.
Parseable is the strongest fit here when the requirement is MCP-native investigation, SQL assistance and AI summarization over OpenTelemetry data. Teams centered on CMDB workflows, cross-vendor event correlation or paging should shortlist the corresponding specialists above.