

Most tracing systems do not need to store every trace. Successful requests often look the same, while failed and slow requests contain the information engineers need during an incident.
Tail sampling lets the OpenTelemetry Collector decide which traces to keep after their spans arrive. The Collector can retain errors and high-latency traces, then keep a smaller percentage of normal traffic.
This reduces trace volume, but it adds three requirements. The Collector needs enough memory to hold pending traces, every span from a trace must reach the same Collector instance, and span-derived metrics must be created from the correct side of the sampling pipeline.
What is OpenTelemetry tail sampling?
OpenTelemetry tail sampling is a Collector-side sampling method. The tail_sampling processor groups spans by trace ID, waits for spans to arrive and evaluates the completed trace against a set of policies.
The flow looks like this:
application services
        |
        | all traces
        v
OpenTelemetry Collector
        |
        | hold spans and evaluate policies
        v
error traces + slow traces + baseline sample
        |
        v
trace backend
The processor is stateful because it keeps trace data while waiting to make the decision. It is available in the OpenTelemetry Collector Contrib and Kubernetes distributions. A Core or custom distribution may not include it.
Head sampling vs tail sampling
Head sampling makes the decision when a trace starts. It has low overhead, but it cannot use the final status or duration because those values do not exist yet.
Tail sampling makes the decision after spans reach the Collector. It can keep a trace because one span failed, because the full trace was slow or because an attribute matched a policy.
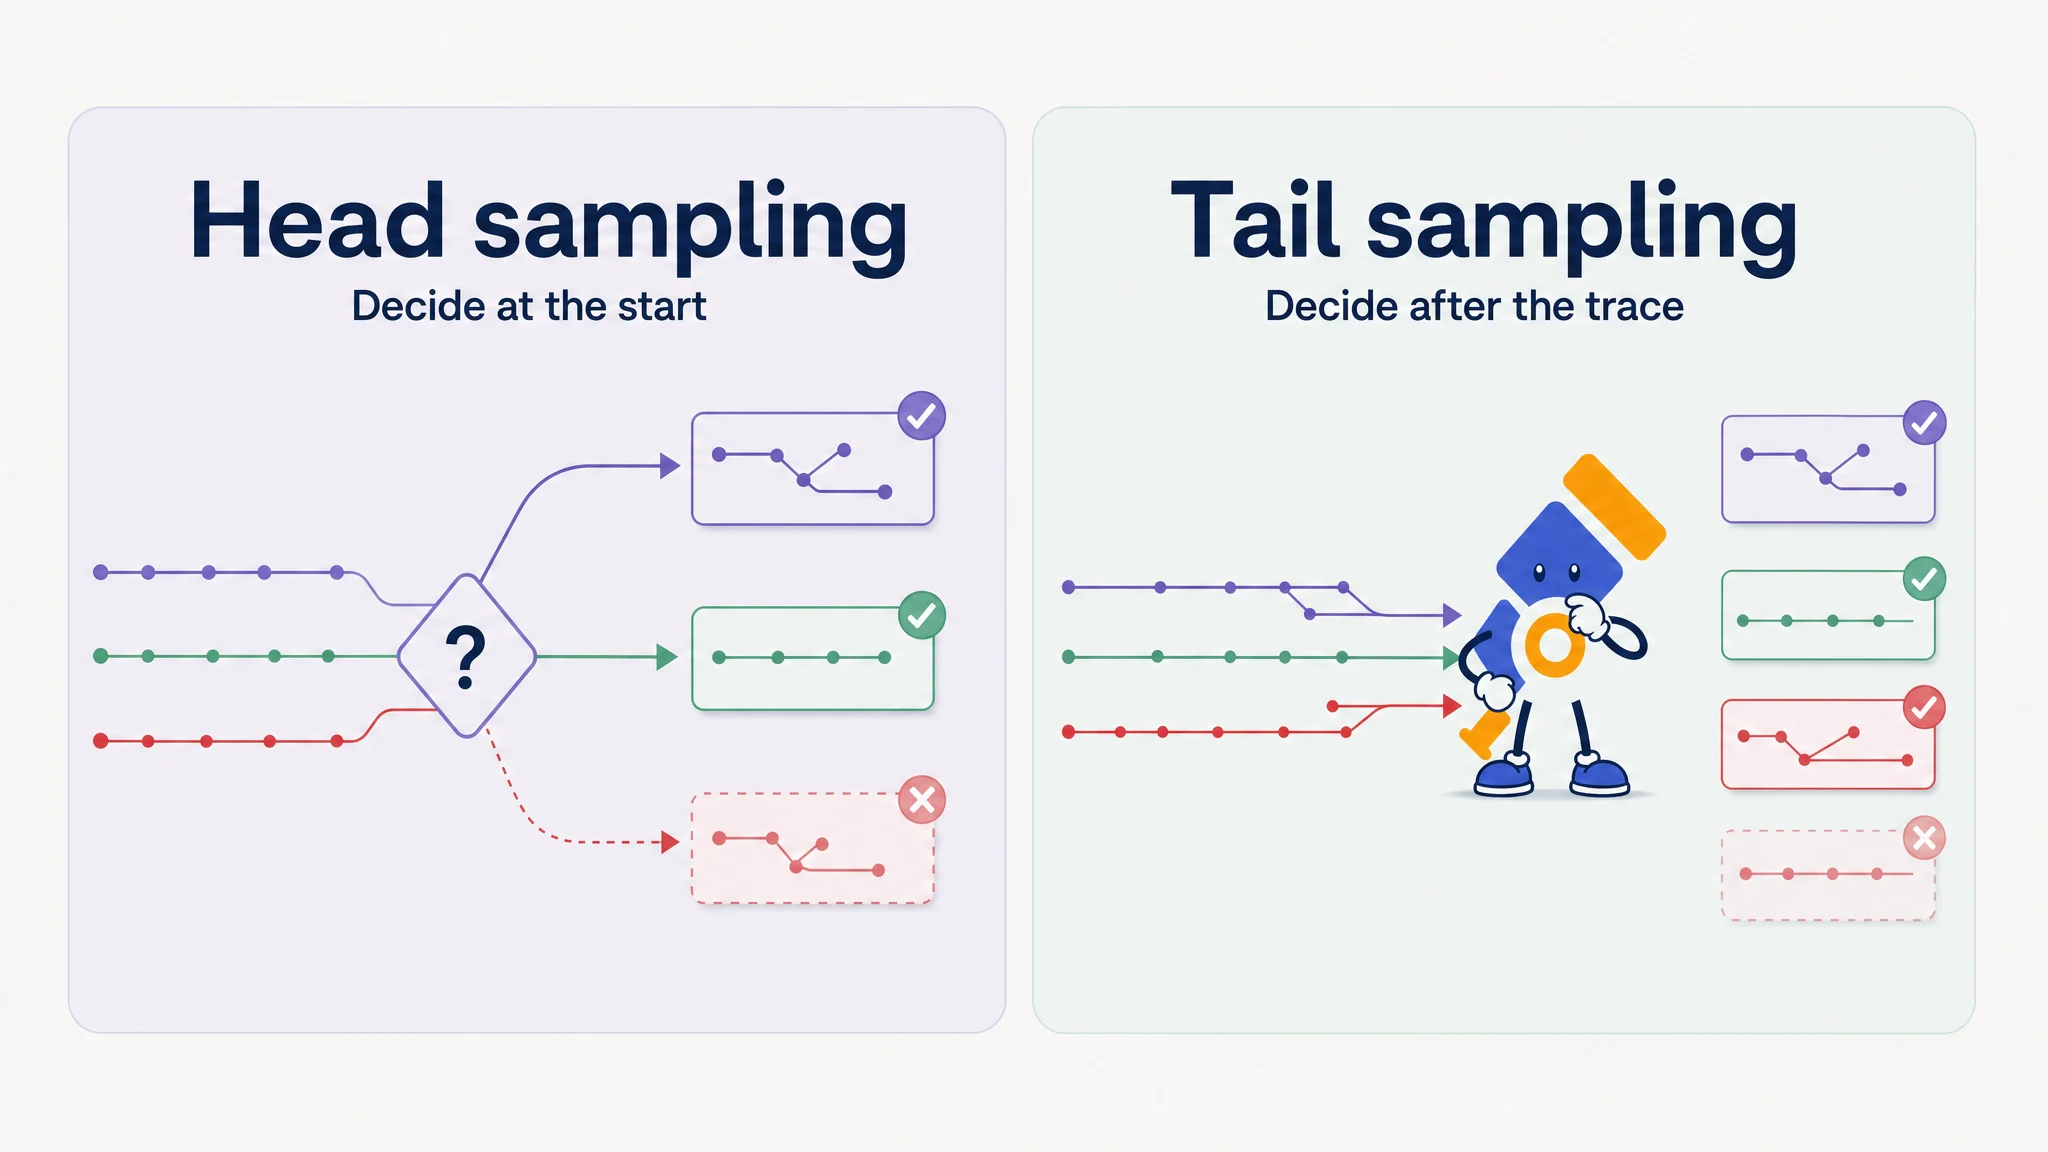
| Head sampling | Tail sampling | |
|---|---|---|
| Decision time | When the trace starts | After spans reach the Collector |
| Error-based sampling | Cannot use the final outcome | Can inspect span status |
| Latency-based sampling | Cannot use the final duration | Can inspect trace duration |
| Resource use | Low | Stores pending traces in Collector memory |
| Scaling | Stateless | One instance must receive every span from the trace |
Applications normally need to export all traces to the tail-sampling tier, usually over OTLP. If an SDK drops a trace through head sampling, the Collector never receives it and cannot keep it later when a child span reports an error.
Configure the tail sampling processor
The following configuration keeps three groups of traces:
- traces containing a span with
ERRORstatus - traces with a duration of at least two seconds
- five percent of the remaining traces
Save the configuration as otel-tail-sampling.yaml.
receivers:
  otlp:
    protocols:
      grpc:
        endpoint: 0.0.0.0:4317
      http:
        endpoint: 0.0.0.0:4318

processors:
  memory_limiter:
    check_interval: 1s
    limit_percentage: 80
    spike_limit_percentage: 20

  tail_sampling:
    decision_wait: 15s
    num_traces: 50000
    expected_new_traces_per_sec: 2000
    decision_cache:
      sampled_cache_size: 100000
      non_sampled_cache_size: 500000
    policies:
      - name: keep-errors
        type: status_code
        status_code:
          status_codes: [ERROR]

      - name: keep-slow-traces
        type: latency
        latency:
          threshold_ms: 2000

      - name: keep-baseline
        type: probabilistic
        probabilistic:
          sampling_percentage: 5

  batch:
    timeout: 5s
    send_batch_size: 1000

exporters:
  otlp_http/parseable:
    endpoint: ${env:PARSEABLE_URL}
    encoding: json
    headers:
      X-API-Key: ${env:PARSEABLE_API_KEY}
      X-P-Stream: ${env:PARSEABLE_TRACE_STREAM}
      X-P-Log-Source: otel-traces

service:
  pipelines:
    traces:
      receivers: [otlp]
      processors: [memory_limiter, tail_sampling, batch]
      exporters: [otlp_http/parseable]
Processors run in the order listed in the pipeline. Keep memory_limiter first so it can slow incoming data when memory is under pressure. If you use a processor such as k8sattributes, place it before tail_sampling because it needs the original span context. Keep batch after tail_sampling; the sampler first groups spans into complete traces, then batch prepares the retained spans for export.
How tail sampling policies are evaluated
Each policy evaluates the trace and returns a sampling decision. In the example, the error, latency and probabilistic policies are separate reasons to keep the trace.
The status_code policy keeps a trace when any span has ERROR status. The latency policy calculates trace duration from the earliest span start time to the latest span end time. The probabilistic policy provides a small baseline of normal traces so successful traffic does not disappear completely.
By default, the processor checks every policy, and a matching drop policy can reject a trace even if another policy keeps it. With sample_on_first_match enabled, it stops checking after the first sampling match, so policy order matters.
Other available policies include string_attribute, numeric_attribute, boolean_attribute, span_count, rate_limiting, ottl_condition, and, not, drop and composite. The official tail sampling processor policy reference lists every policy and includes configuration examples.
Configure decision_wait
decision_wait controls how long the default trace-complete strategy waits before evaluating a trace. Its default value is 30 seconds. The example reduces it to 15 seconds.
This value is based on span arrival time, not only trace duration. A ten-second request may export all its spans together when it finishes. A much shorter request may produce a late span if an SDK batches data or retries an export.
A longer wait gives late spans more time to reach the Collector. It also delays export and keeps more trace data in memory. Measure the delay between the first and last span arriving at the sampling tier, including application batching and retries, then choose a value with enough headroom for normal traffic.
The decision cache keeps sampling decisions after trace data leaves the main buffer. It helps late spans receive the same decision as the original trace. Configure both caches well above num_traces when late spans are common. If most traces are dropped, the non-sampled cache usually needs more entries than the sampled cache.
Size num_traces and Collector memory
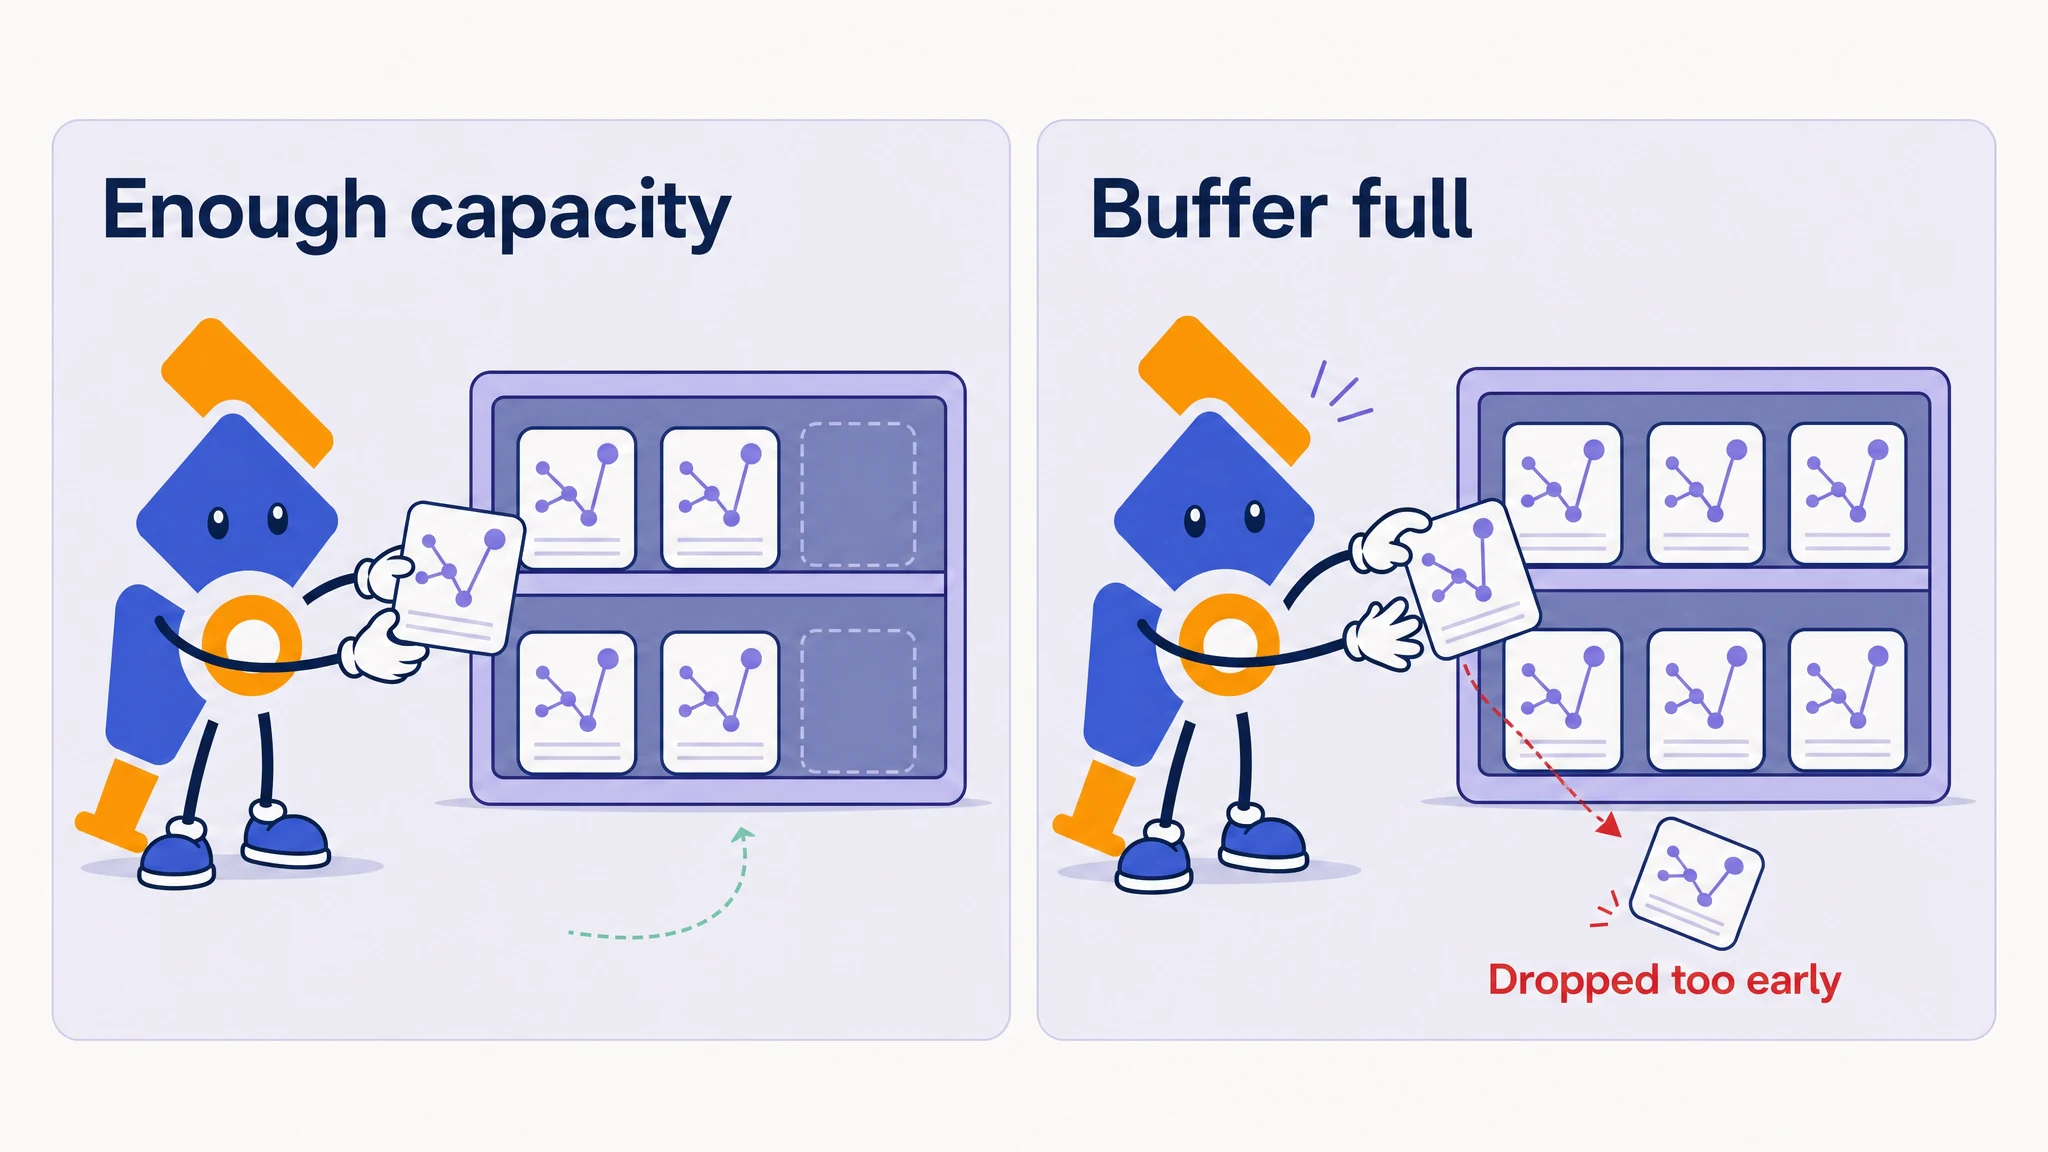
num_traces sets the number of trace IDs the processor can keep in its main buffer. It is a trace count, not a memory limit.
When the buffer fills before a sampling decision, the oldest pending trace is removed. The processor reports this through otelcol_processor_tail_sampling_sampling_trace_dropped_too_early.
Use the following calculation as a starting point:
num_traces >= peak new traces/second x decision_wait in seconds x safety factorFor 2,000 new traces per second, a 15-second wait and a safety factor of 1.5:
2,000 x 15 x 1.5 = 45,000 tracesRounding the result to 50,000 leaves space for short traffic bursts. Use peak trace rate for this calculation, not average span rate. One trace may contain two spans while another contains hundreds.
expected_new_traces_per_sec helps the processor allocate internal data structures. It does not limit incoming traffic and does not replace num_traces.
Memory use depends on spans per trace, attributes, events, links and payload size. Load test the Collector with representative traces and include memory used by receivers, processors, batches and exporter queues. The memory limiter processor protects the Collector under pressure, but it cannot prevent incomplete traces when the sampling tier is undersized.
Recent Collector versions also support maximum_trace_size_bytes. This setting immediately drops a trace that grows beyond the configured size and prevents one unusually large trace from using a large part of the sampler's memory.
Newer Collector versions also provide drop_pending_traces_on_shutdown for controlling pending traces during shutdown and num_shards for processing sampling decisions concurrently. These are advanced tuning options and are not required for the basic configuration shown here.
Scale tail sampling in Kubernetes
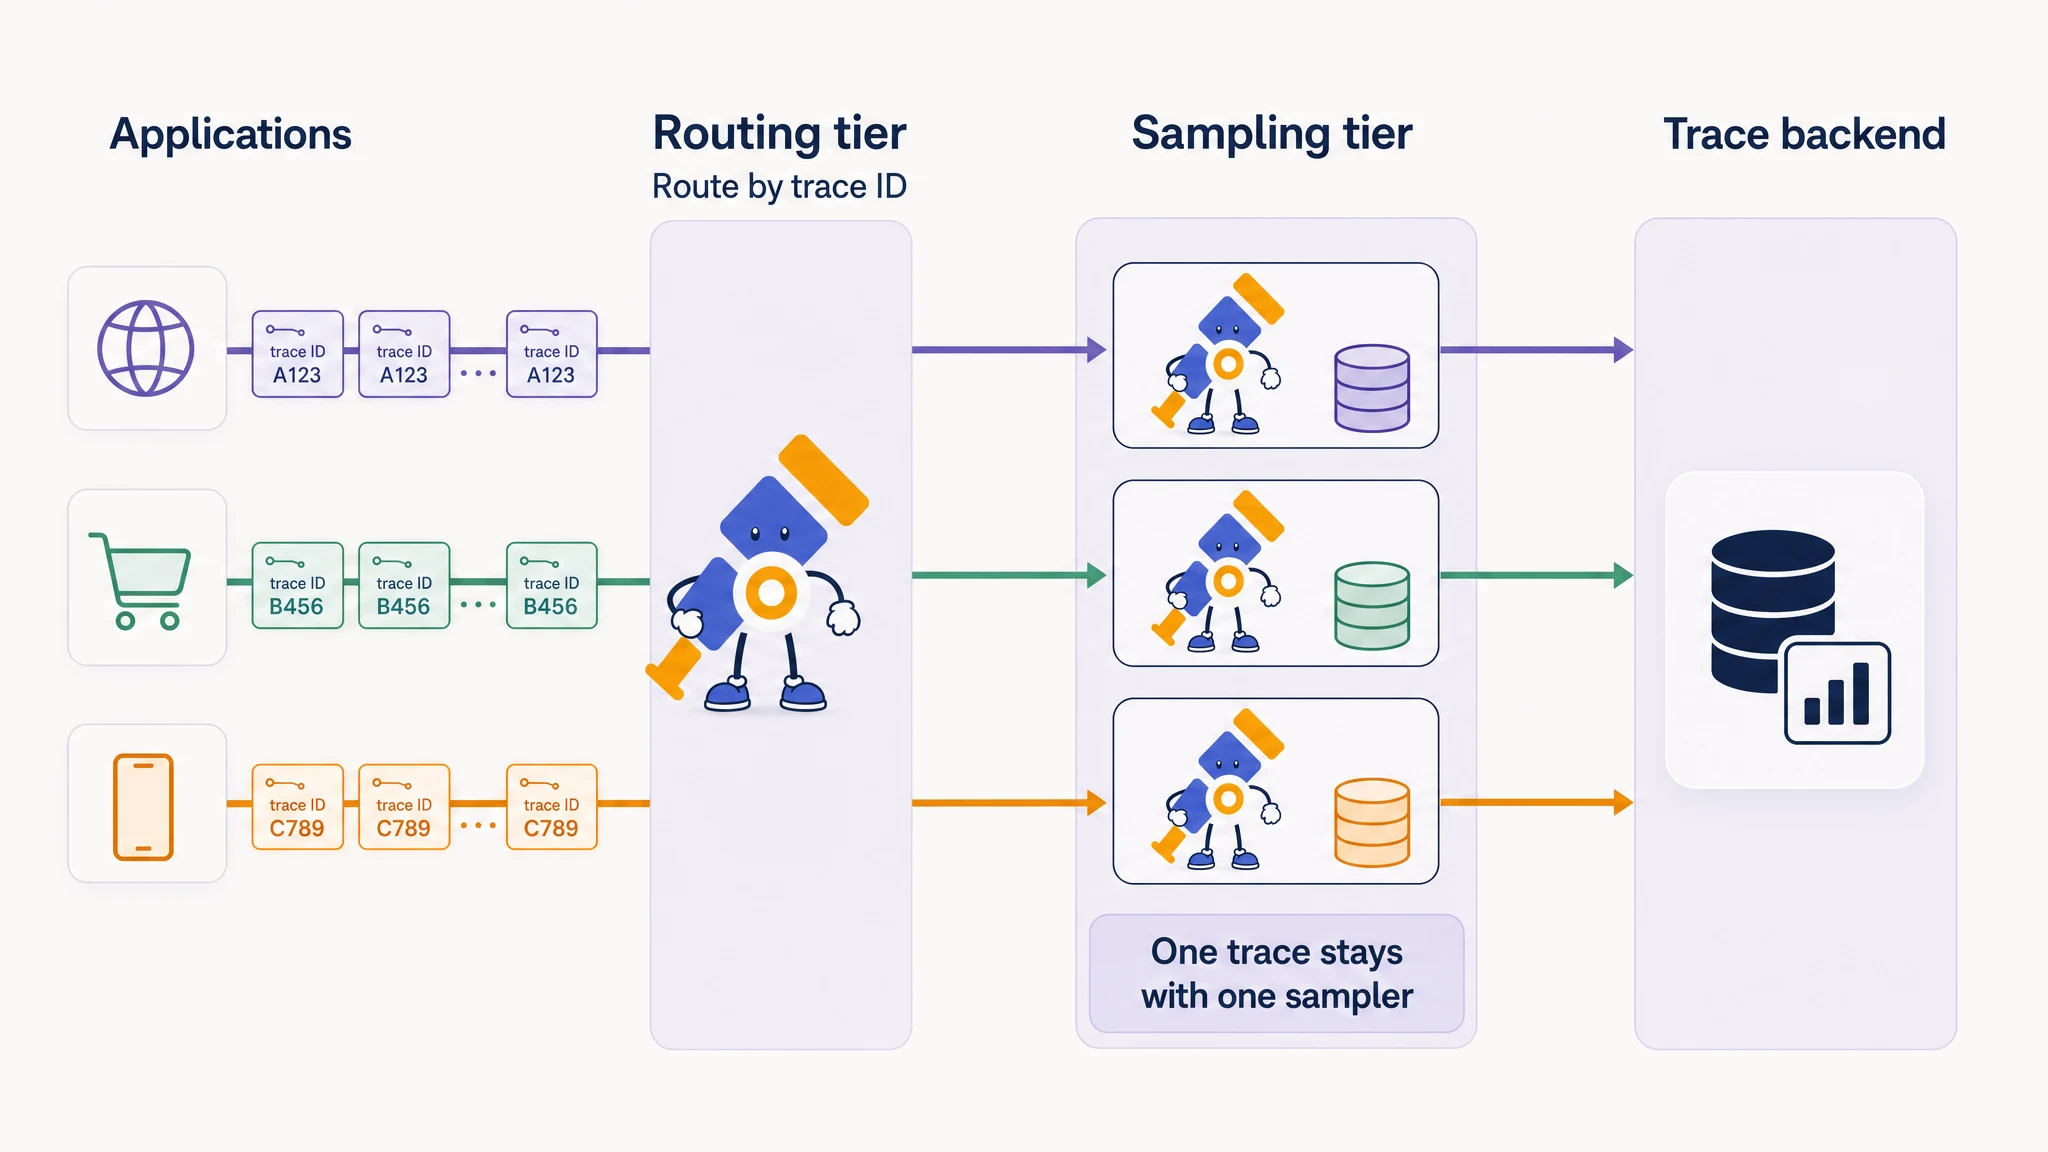
Tail sampling cannot be scaled by placing several sampling Collectors behind a round-robin Kubernetes Service. Spans from one trace may reach different pods, leaving each processor with only part of the trace.
Use a routing tier in front of the sampling tier:
applications or node agents
            |
            v
stateless routing Collectors
  load_balancing exporter
  routing_key: traceID
            |
            v
stateful tail-sampling Collectors
            |
            v
      trace backend
The routing Collectors use the load_balancing exporter with traceID routing. Consistent hashing sends spans with the same trace ID to the same sampling Collector.
The OpenTelemetry agent vs gateway deployment guide explains where the sampling tier fits beside DaemonSet agents and why a normal Kubernetes Service is insufficient for trace-aware routing.
A headless Kubernetes Service can provide the sampler endpoints to the load-balancing exporter. Separate routing and sampling deployments also allow each tier to scale for its own workload. The routing tier handles network throughput, while the sampling tier needs CPU and memory for trace state and policy evaluation.
Scaling or rolling out the sampling tier changes the backend set. Some trace IDs are then mapped to different pods while traces are still in flight. Use gradual rollouts, graceful shutdown and a PodDisruptionBudget to reduce incomplete traces during these changes.
Create span metrics before tail sampling
The position of the span_metrics connector changes what its metrics represent.
If the connector receives spans after tail sampling, it calculates request counts, error counts and latency from retained traces only. A policy that keeps every error but only five percent of successful traces produces a heavily biased error rate.
Branch the complete span stream before tail sampling when span metrics should represent all application traffic:
                         -> span_metrics -> metrics backend
all received spans ------|
                         -> tail_sampling -> traces backend
This requires separate pipelines connected with a connector. Reordering processors in a single traces pipeline is not enough. The OpenTelemetry SpanMetrics connector guide shows the complete connector and metrics pipeline configuration.
Metrics generated after tail sampling can still describe sampled traffic, but their raw values should not be used as total request counts or error rates.
Monitor the tail sampling processor
The Collector exports internal metrics for sampling decisions, late spans and buffer pressure.
otelcol_processor_tail_sampling_sampling_trace_dropped_too_earlycounts traces removed before a decision.otelcol_processor_tail_sampling_sampling_trace_removal_agerecords how long traces remain in the buffer.otelcol_processor_tail_sampling_sampling_late_span_agerecords spans arriving after a decision.otelcol_processor_tail_sampling_sampling_decision_timer_latencymeasures sampling evaluation and downstream handoff time.otelcol_processor_tail_sampling_global_count_traces_sampledreports the final sampling ratio.
Early trace drops should remain at zero during steady traffic. If they increase, check the incoming trace rate, num_traces, decision_wait, pod memory and the size of individual traces.
Test the final pipeline with known successful, failed and slow requests. Confirm that each retained trace contains all expected spans and that normal traffic approaches the configured baseline percentage. Test what happens when the Collector restarts or the trace backend becomes slow. A restart can lose traces waiting for a sampling decision, while a slow exporter can increase queues and memory usage.