
Enterprise observability platforms collect and connect telemetry across large production environments. Data volume, deployment constraints, incident workflow and cost at scale should drive the choice—not the longest feature list.
This guide compares 10 platforms across those practical concerns. It gives engineering leaders, platform teams and SREs a shortlist they can test against their own workloads.
What is an enterprise observability platform?
An enterprise observability platform collects and analyzes logs, metrics, traces, events and related operational data across distributed systems. Unlike a single-purpose monitoring tool, it also provides shared investigation workflows, access controls, auditability and data-management features for many services and teams.
Workflow separates a platform from a collection of tools. An engineer should be able to move from an alert to the affected service, related traces, relevant logs and a recent change without rebuilding the incident timeline across several disconnected systems.
If the main requirement is automated alert correlation, probable-cause analysis or incident response, compare the best AIOps platforms and tools. AIOps and observability overlap, but they solve different parts of the operational workflow.
What enterprise observability platforms actually do
At minimum, the platform must ingest telemetry, retain it, support investigation and alert the right team. Enterprise products add shared service context, tenancy boundaries, governance and predictable operating controls. If your priority is self-hosting and source-code access rather than a managed enterprise service, compare the best open-source observability platforms.
10 Best enterprise observability platforms at a glance
| Platform | Best for | Deployment and data model | OpenTelemetry | Pricing approach |
|---|---|---|---|---|
| Parseable | Unified telemetry with customer-controlled storage | Cloud, BYOC, or self-hosted; object storage | Native OTLP ingestion | Usage-based cloud and enterprise plans |
| Datadog | Broad managed observability and integration coverage | SaaS | Supported | Modular product and usage pricing |
| Dynatrace | Automated topology and root-cause workflows | SaaS and managed deployment options | Supported | Platform consumption pricing |
| New Relic | Managed full-stack observability with a unified UI | SaaS | Supported | Data ingest and user-based components |
| Splunk Observability Cloud | APM and infrastructure visibility for Splunk customers | SaaS | Supported | Sales-led and workload-dependent |
| Grafana Cloud | Teams using Prometheus, Loki, Tempo and Grafana | SaaS; open-source components can also be self-managed | Native support | Usage-based cloud plans |
| Elastic Observability | Search-led investigation and existing Elastic users | Elastic Cloud or self-managed stack | Supported | Cloud consumption or subscription |
| Chronosphere | Cloud-native telemetry governance at large scale | SaaS | Supported | Custom enterprise pricing |
| Coralogix | In-stream analytics and telemetry cost controls | SaaS with customer-owned archive options | Supported | Usage-based plans |
| Honeycomb | High-cardinality application debugging | SaaS | Native support | Event-based plans |
Pricing and packaging change frequently. The links in each review point to the vendor's current product or pricing page. Verify the quote against your ingest volume, retention, users and support requirements before buying.
We selected these observability companies because their platforms represent different deployment, storage and investigation models. The vendor order is not an aggregate ranking.
What to look for in enterprise observability platforms
We assessed each platform using the same six questions:
- Can it connect investigations across telemetry? Logs, metrics and traces are useful only when engineers can move between them with consistent service and deployment context.
- How portable is collection? Native OpenTelemetry support reduces dependence on proprietary agents and makes backend changes less disruptive.
- Where does the data live? SaaS, BYOC, self-hosted and customer-owned archive models have different implications for residency, security and operations.
- How does cost grow? We considered ingest, indexing, retention, users, hosts, custom metrics and separate product modules rather than one headline rate. This observability pricing guide explains the cost dimensions to model.
- Does it support enterprise governance? SSO, RBAC, audit logs, tenancy boundaries and data controls matter when many teams share a platform.
- Where is it strongest? A focused product can outperform a broad suite on the workload it was designed to handle.
This comparison draws from public product documentation and pricing information available in August 2026. Parseable publishes this article and is included in the list. We did not conduct independent laboratory tests. Validate product claims with a proof of concept using your telemetry.
Choose by your primary constraint
| If your priority is... | Start with... | Validate during the proof of concept |
|---|---|---|
| Customer-controlled storage or BYOC | Parseable, Elastic | Upgrade ownership, query performance, access controls and recovery |
| Broad managed integrations | Datadog, New Relic | Total cost after enabling the required products and retention |
| Automated topology and causal analysis | Dynatrace | Coverage across your actual services and change systems |
| Existing Splunk investment | Splunk Observability Cloud | Handoffs between observability, logs and security workflows |
| Prometheus and Grafana alignment | Grafana Cloud | Cardinality limits, logs and traces pricing and operational boundaries |
| Search-heavy investigations | Elastic Observability | Index lifecycle, shard operations and long-retention cost |
| Large cloud-native telemetry estates | Chronosphere | Governance, cost attribution and signal coverage |
| In-stream cost controls | Coralogix | Query experience across each storage tier |
| High-cardinality application debugging | Honeycomb | Infrastructure, logs and operational monitoring requirements |
10 enterprise observability platforms compared
1. Parseable: Best enterprise observability platform for cost-efficient unified telemetry
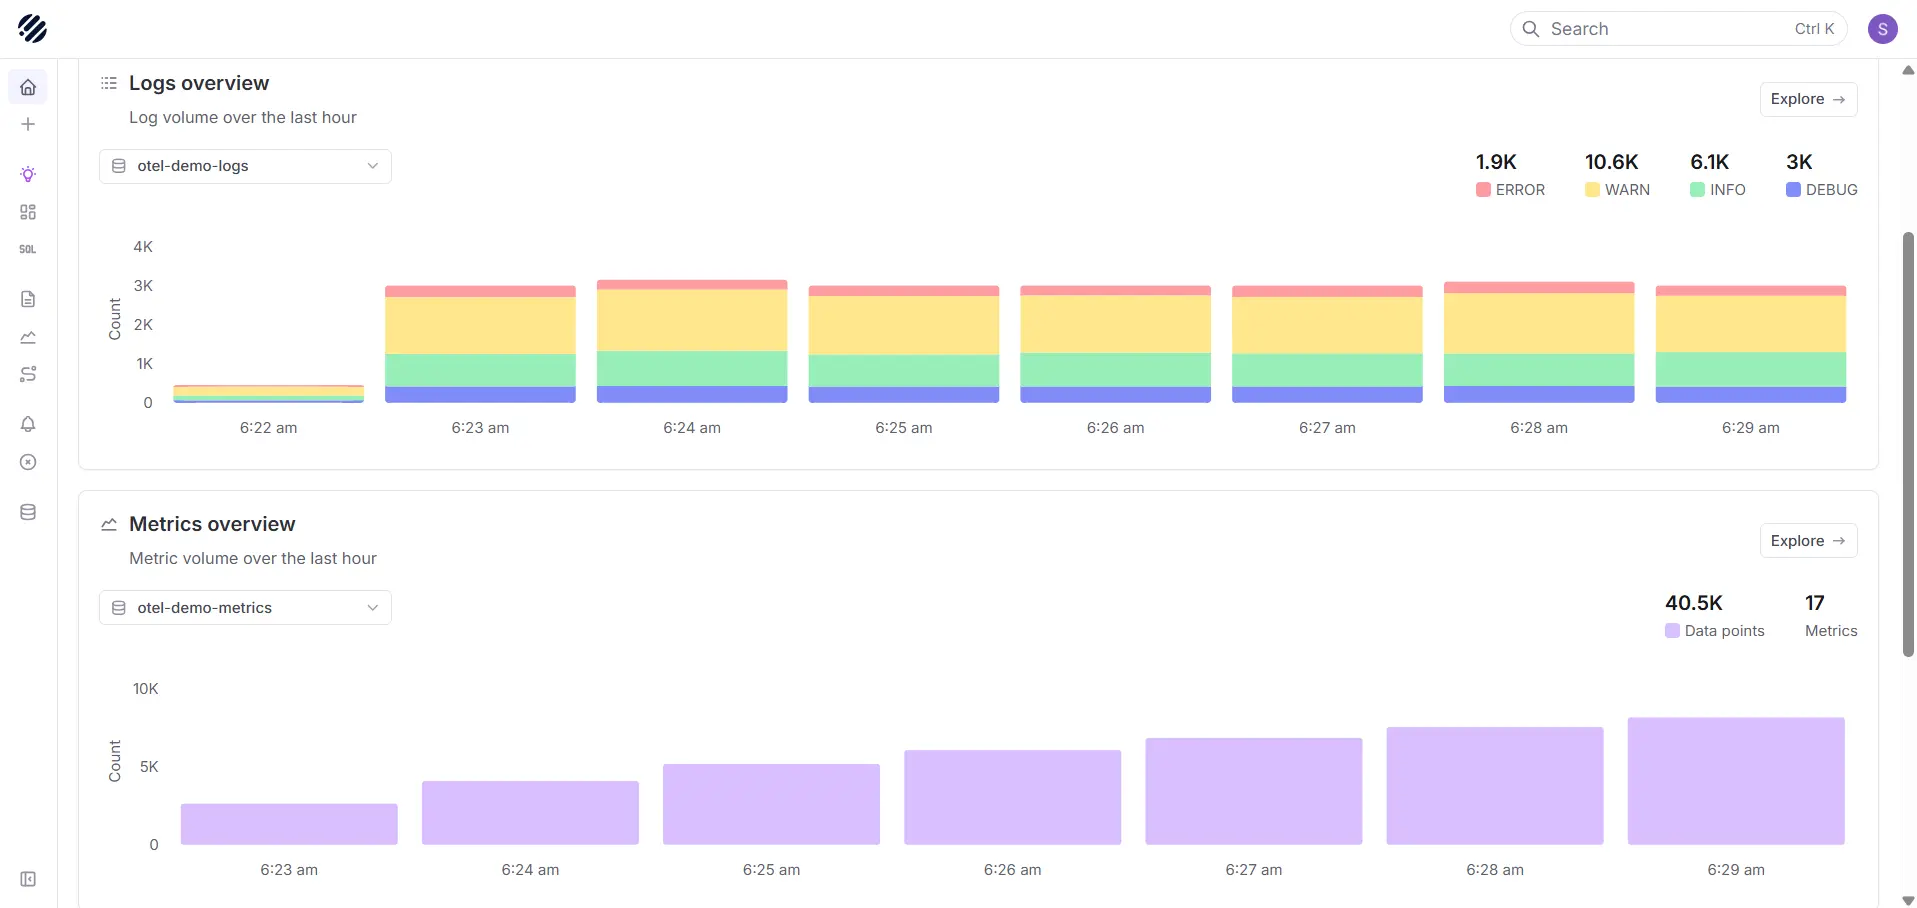
Parseable brings logs, metrics and traces into one OpenTelemetry-native platform. It stores telemetry in Apache Parquet on object storage and provides SQL-based exploration, dashboards, alerts and enterprise access controls. Teams can use Parseable Cloud, deploy it themselves, or use a bring-your-own-cloud model.
This architecture suits teams that prioritize retention and data ownership. Object storage separates durable telemetry from a vendor-owned hot-storage tier, while Parquet supports column-oriented reads and compression. Test ingestion throughput, query latency, recovery and operational ownership with your own data; storage architecture alone does not determine performance.
Shortlist Parseable when: you need OpenTelemetry ingestion, SQL access, flexible deployment and control over where telemetry is stored.
Trade-offs: Parseable has a smaller integration and services ecosystem than long-established SaaS suites. A migration also requires teams to recreate the dashboards, alerts and runbooks they want to keep.
Pricing: Parseable publishes current cloud and enterprise terms on its pricing page. Self-hosted cost depends on infrastructure, storage and the team operating the platform.
2. Datadog: Best for a broad managed ecosystem
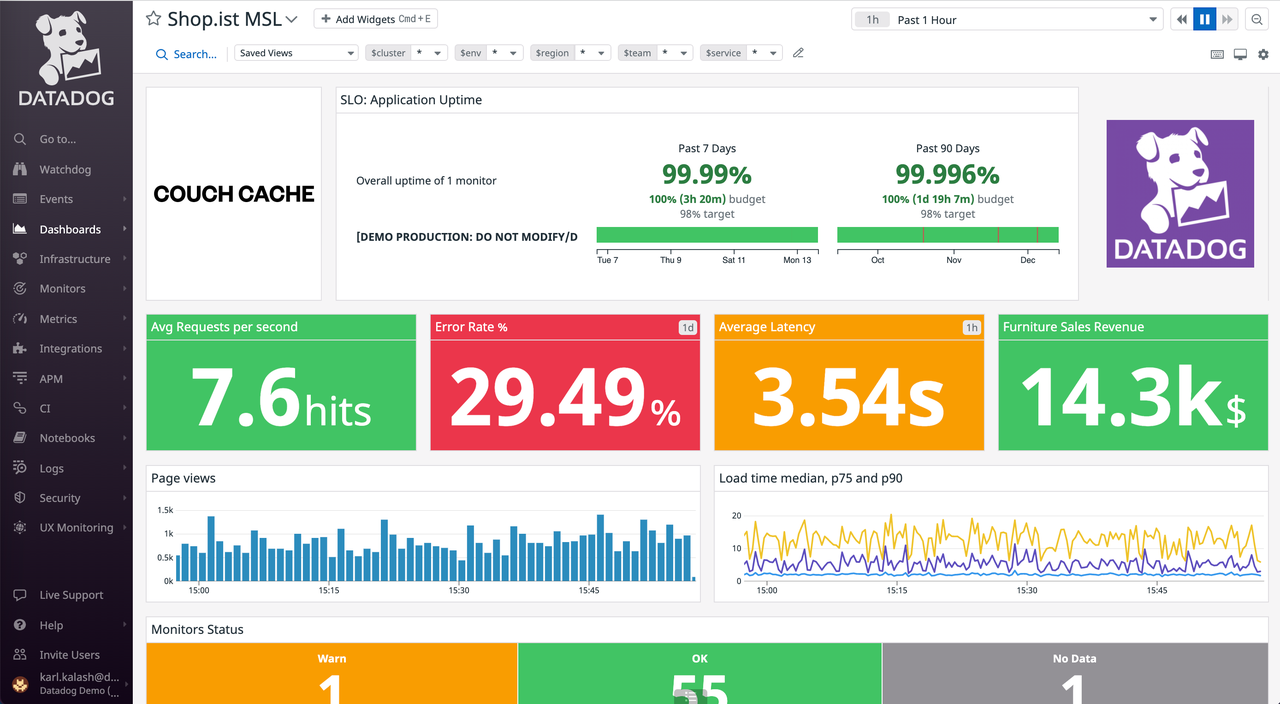
Datadog combines infrastructure monitoring, APM, logs, digital experience monitoring, security and incident workflows in a managed service. Its large integration catalog and guided onboarding make it a practical option for organizations that value coverage and time to first dashboard.
Datadog bills several products and usage dimensions separately, including indexed data, hosts, custom metrics, users and retention. Model the complete configuration instead of comparing one ingest rate.
Shortlist Datadog when: you want a mature SaaS experience, extensive integrations and one vendor across many operational use cases.
Trade-offs: the modular product model can make forecasting difficult as adoption expands. Teams should also assess how much instrumentation and workflow logic depends on Datadog-specific features.
Pricing: review the required products on Datadog's pricing page and request a workload-specific estimate.
3. Dynatrace
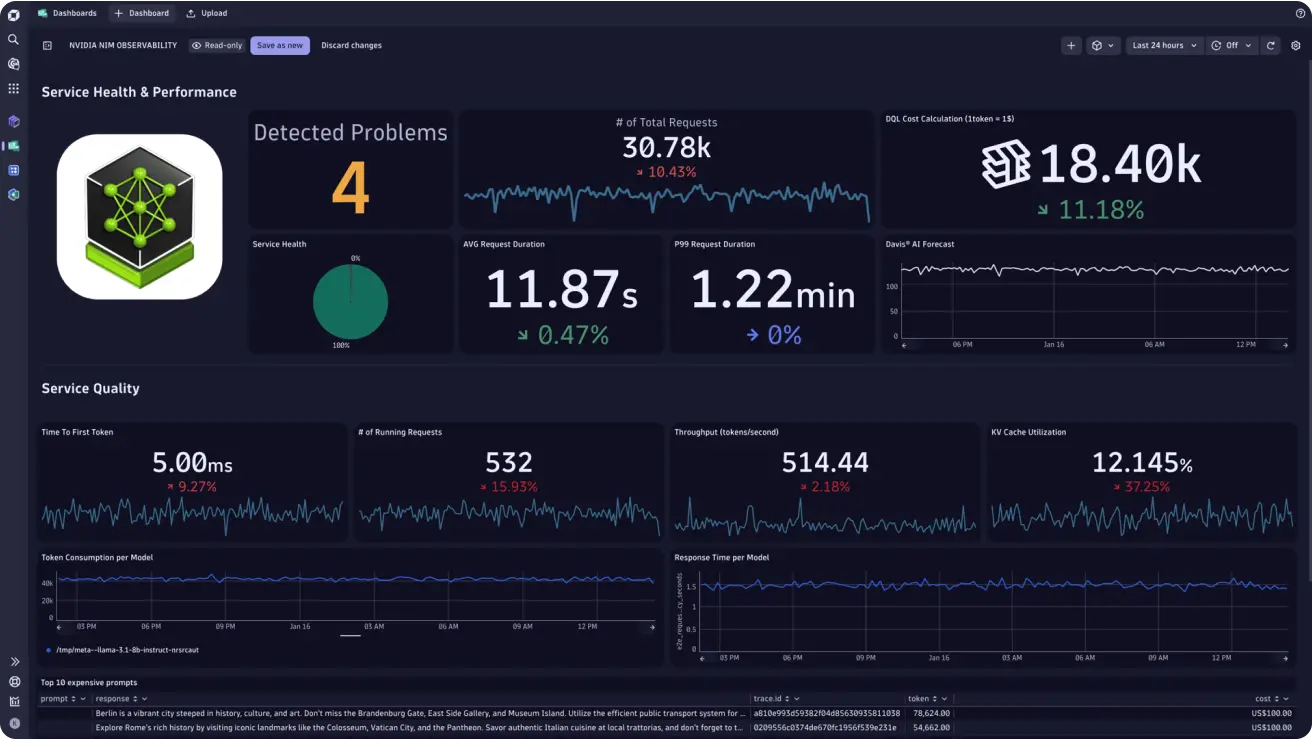
Dynatrace focuses on automatic service discovery, topology, dependency context and causal analysis. These capabilities suit large hybrid environments where manually maintaining service relationships is impractical.
During evaluation, check whether the platform maps your asynchronous workflows, managed services, Kubernetes workloads and deployment events correctly. A demonstration application cannot establish that coverage.
Shortlist Dynatrace when: automated topology and guided root-cause analysis matter more than assembling an open stack.
Trade-offs: it is a broad platform with its own data model and operating conventions. Migration effort and total platform consumption deserve the same attention as feature depth.
Pricing: Dynatrace documents its consumption model on the official pricing page.
4. New Relic: Best for managed full-stack visibility
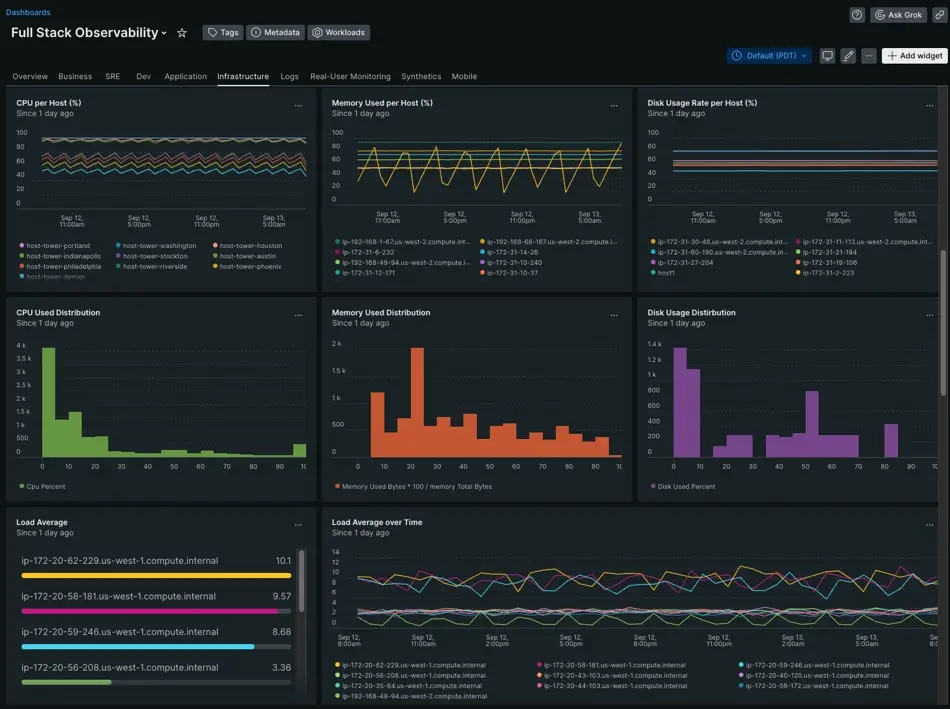
New Relic provides APM, infrastructure monitoring, logs, browser monitoring, synthetics, mobile monitoring and related workflows through a managed platform. NRQL gives teams a consistent query language across much of that data.
New Relic suits application teams that want broad coverage without operating the backend. Test cross-signal navigation and calculate the combined effect of ingest, users, retention and support.
Shortlist New Relic when: application performance and a managed full-stack interface are the main requirements.
Trade-offs: it is SaaS-first and existing NRQL dashboards and alerts become migration work if the organization later changes platforms.
Pricing: use New Relic's pricing page for current allowances and plan details.
5. Splunk Observability Cloud: Best for enterprise observability with security and log analytics depth
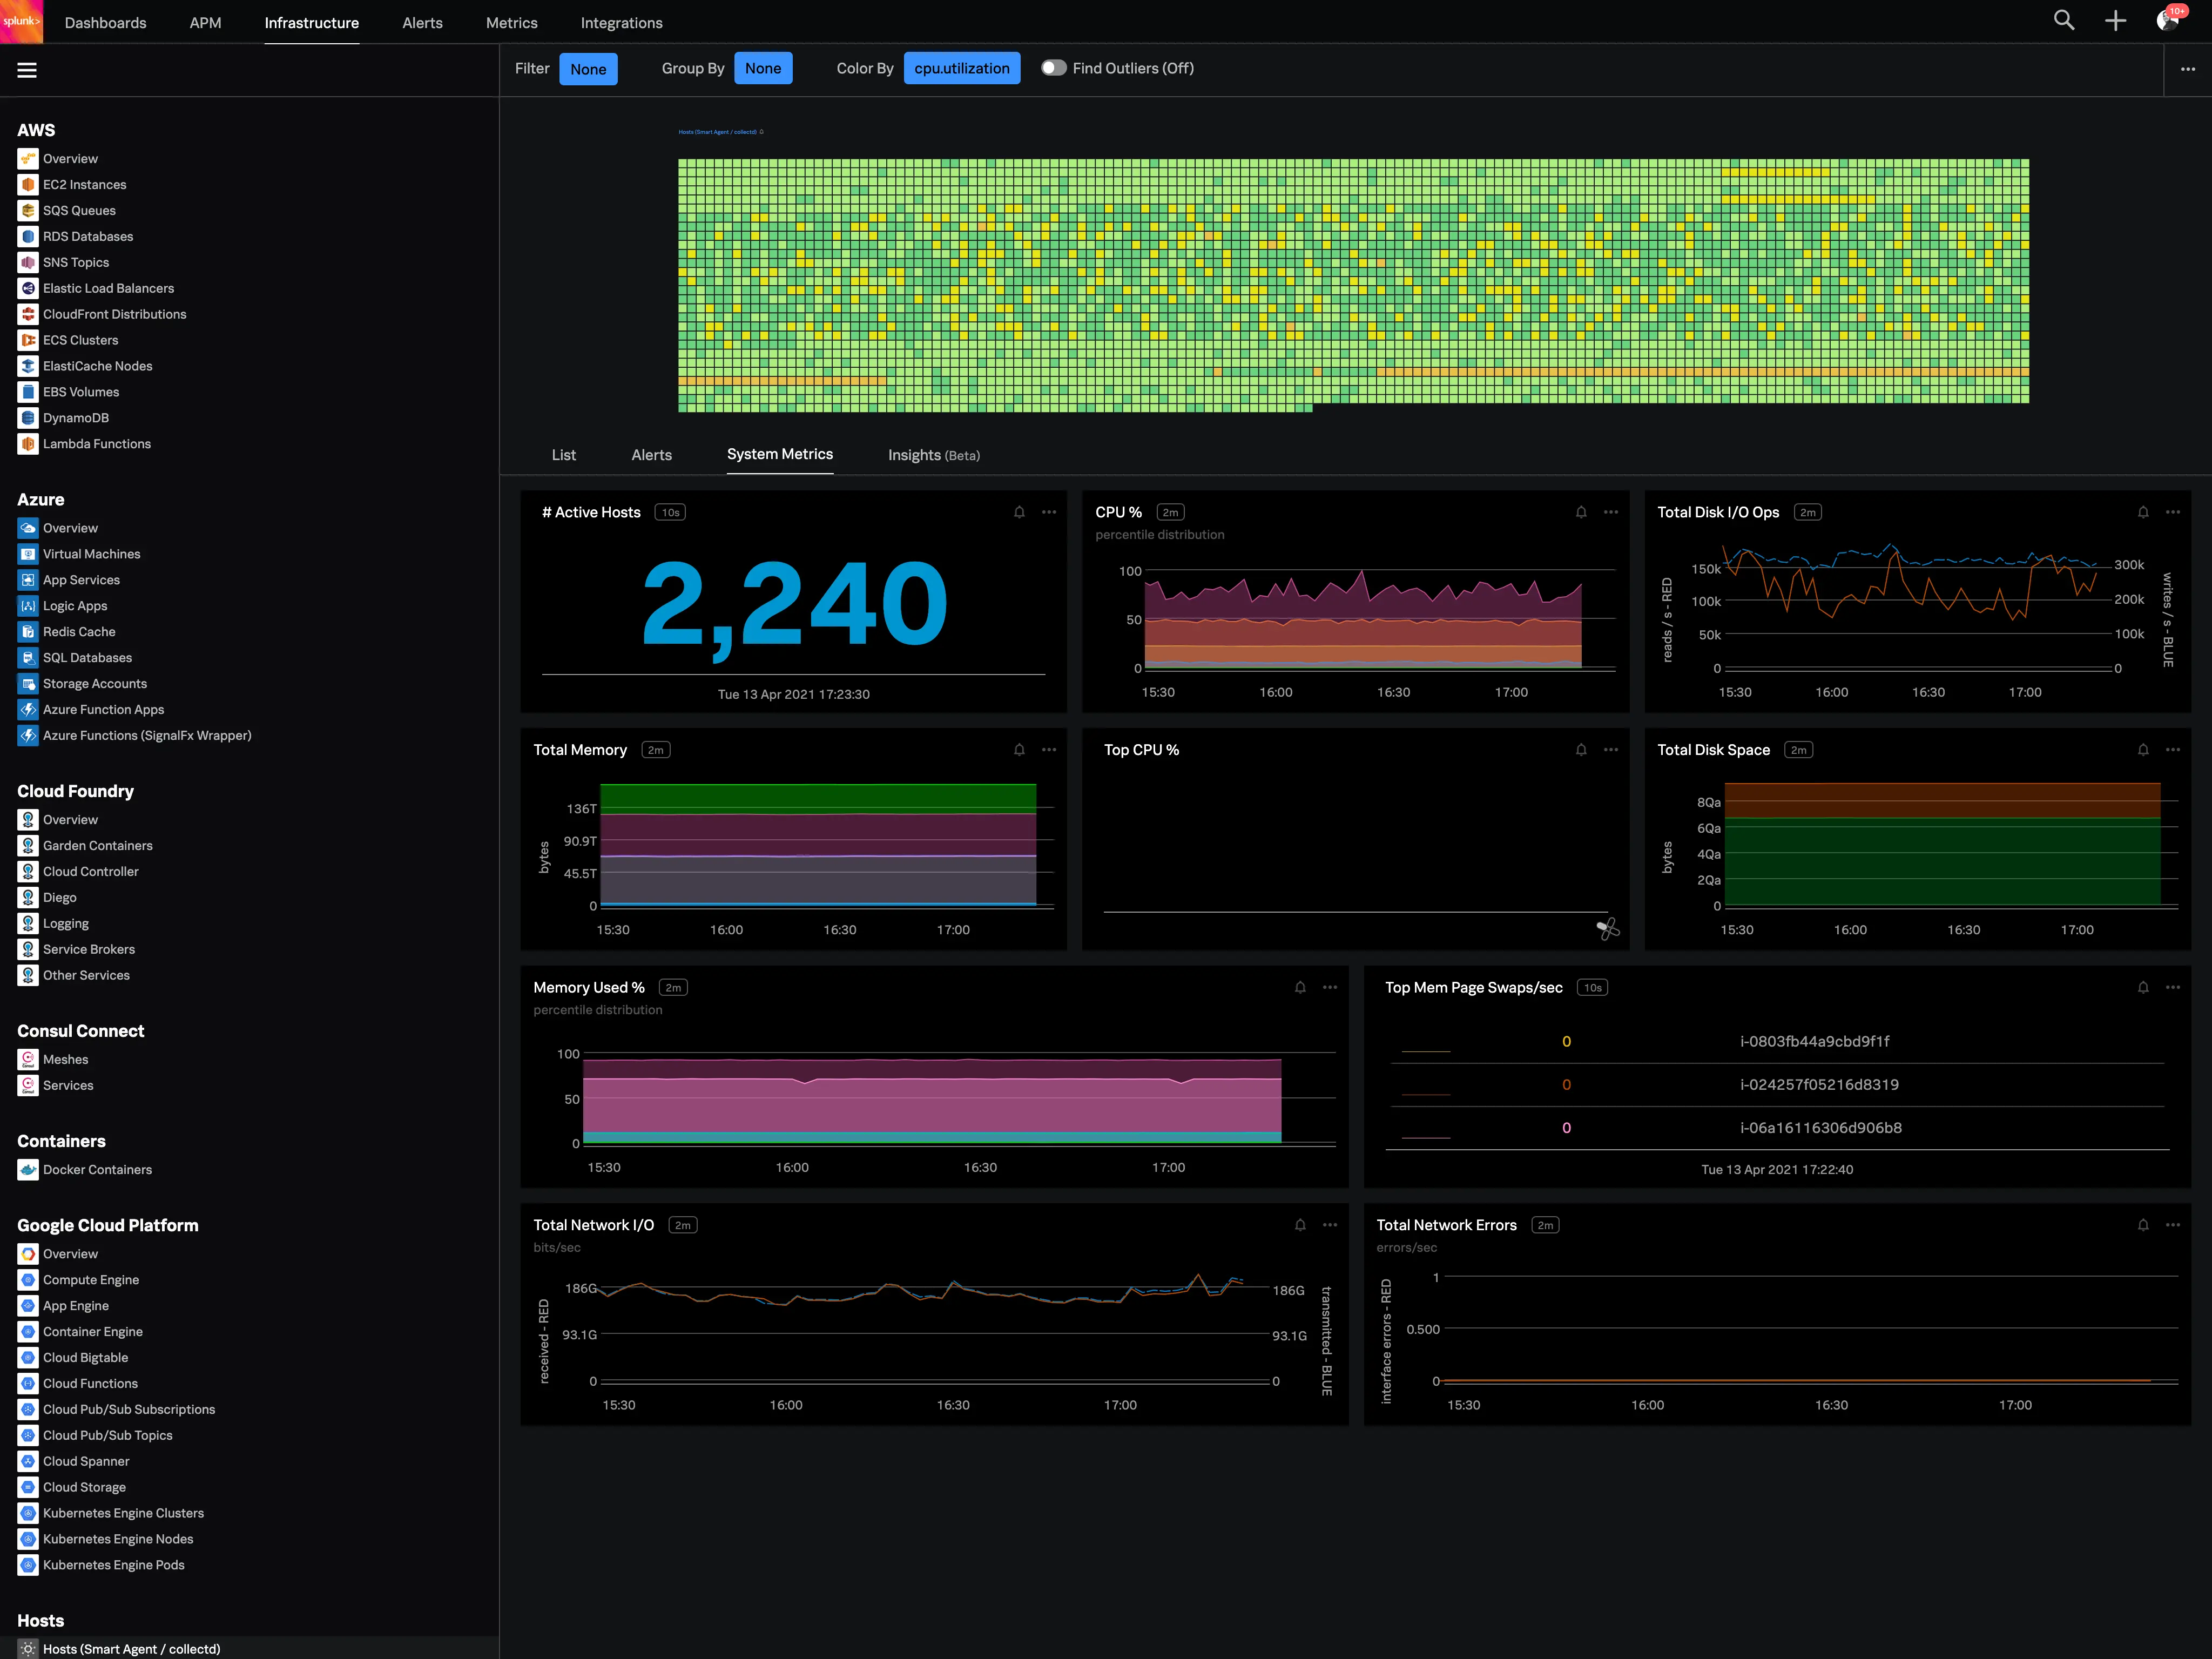
Splunk Observability Cloud covers infrastructure monitoring, APM, real-user monitoring, synthetics and incident response. It can be attractive when Splunk already supports log analytics or security operations and the organization wants closer operational alignment.
Splunk Observability Cloud is a SaaS product. Do not treat deployment options for Splunk Enterprise as deployment options for Observability Cloud. During evaluation, trace an incident across the exact Splunk products you plan to purchase and note where data, identity and queries cross product boundaries.
If both vendors are on the shortlist, the Datadog vs Splunk comparison separates their observability, log management, SIEM and deployment trade-offs.
Shortlist Splunk when: existing Splunk skills, contracts, or security workflows create a meaningful advantage.
Trade-offs: product boundaries, search languages and commercial packaging can add complexity. Validate the complete workflow and quote rather than evaluating APM in isolation.
Pricing: Splunk provides plan information through its observability pricing page and sales process.
6. Grafana Cloud
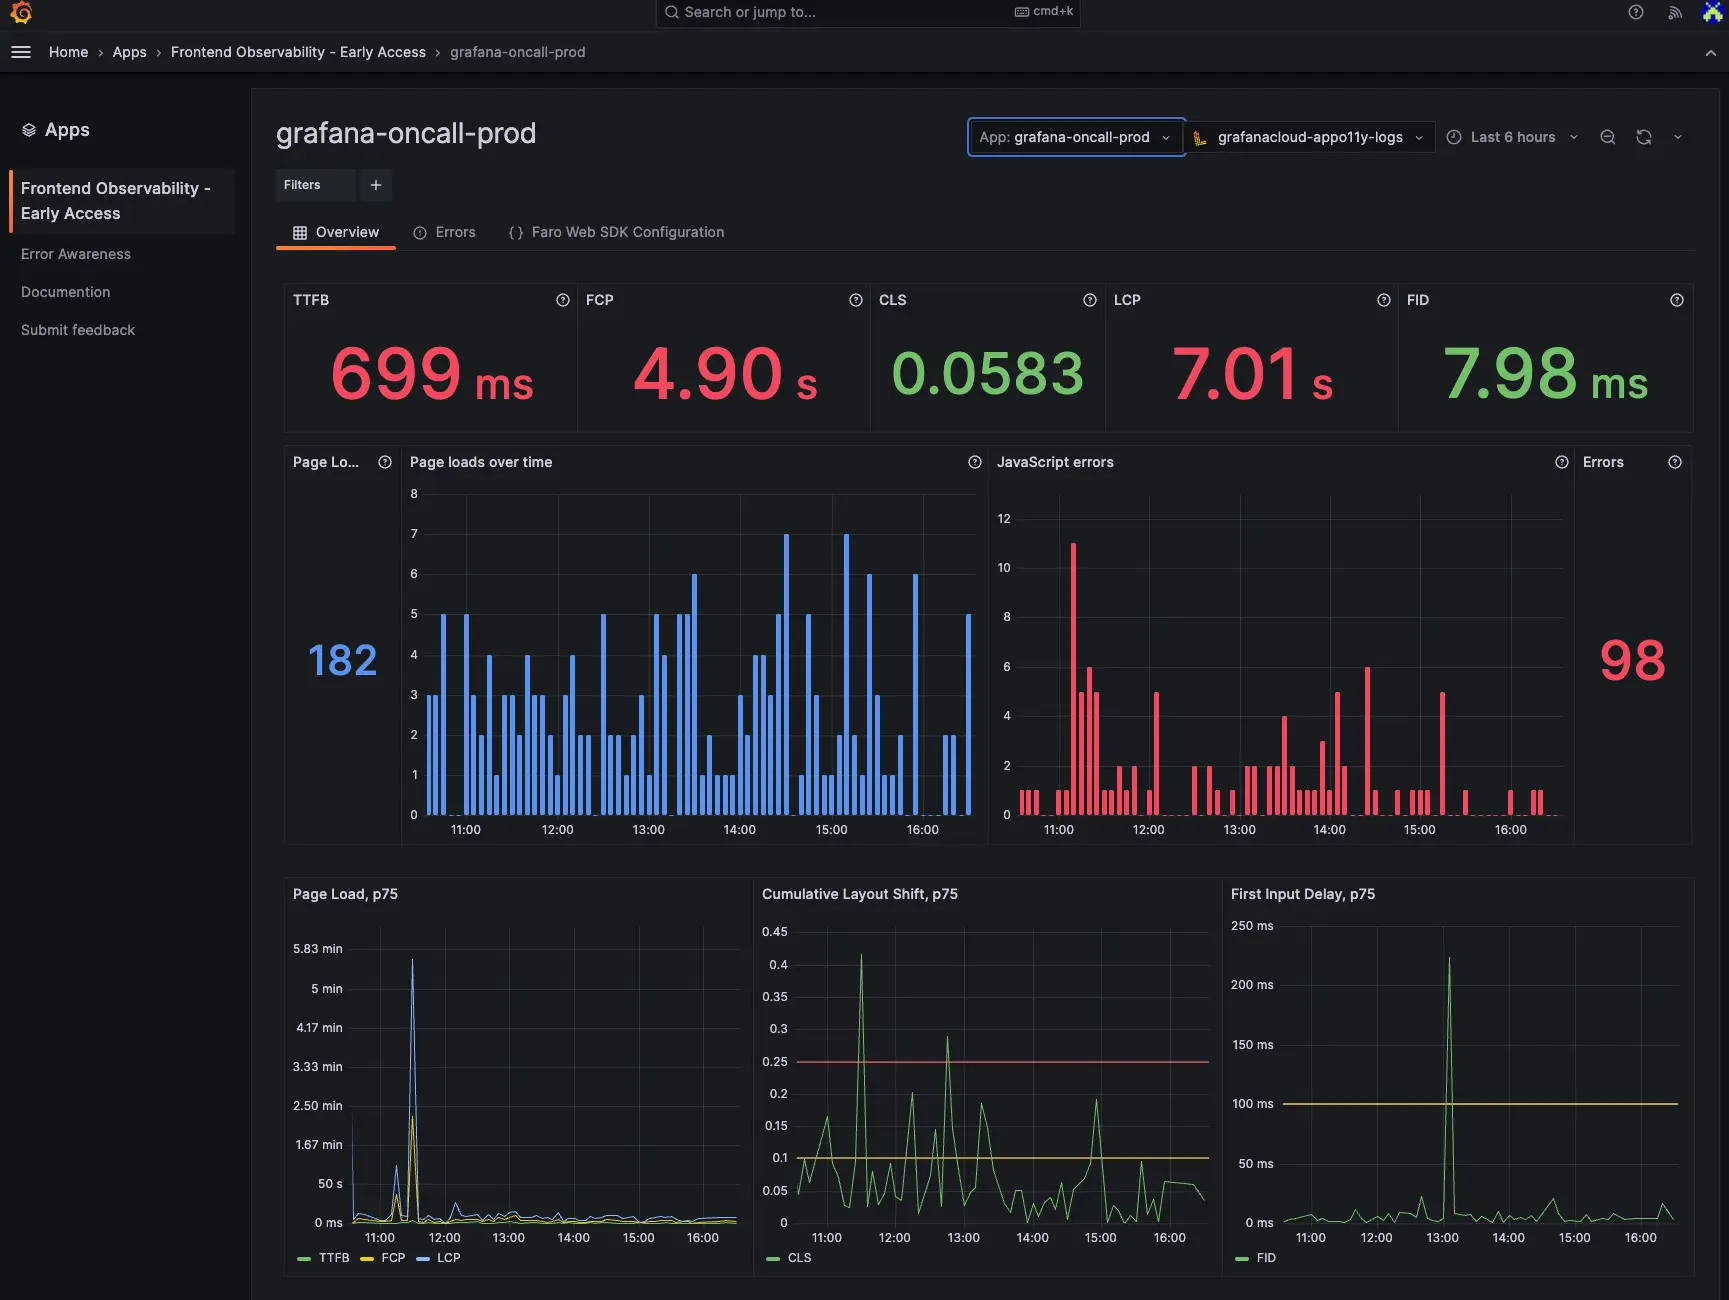
Grafana Cloud is a managed platform built around Grafana and the Prometheus, Loki and Tempo ecosystems. It is a natural fit for teams that already use Grafana dashboards and PromQL and want managed backends for metrics, logs and traces.
Grafana Cloud and a self-managed Grafana stack are different deployment choices. Grafana Cloud is SaaS; teams seeking full infrastructure ownership can operate the open-source components themselves, with the associated upgrade and reliability work.
Shortlist Grafana Cloud when: your teams already use Grafana and Prometheus conventions and want to preserve those skills.
Trade-offs: the metrics, logs and traces backends retain distinct data and query models. Test the investigation path across signals and estimate cardinality and retention costs separately.
Pricing: Grafana publishes usage allowances and rates on its cloud pricing page.
7. Elastic Observability: Best for search-centric observability and ELK teams
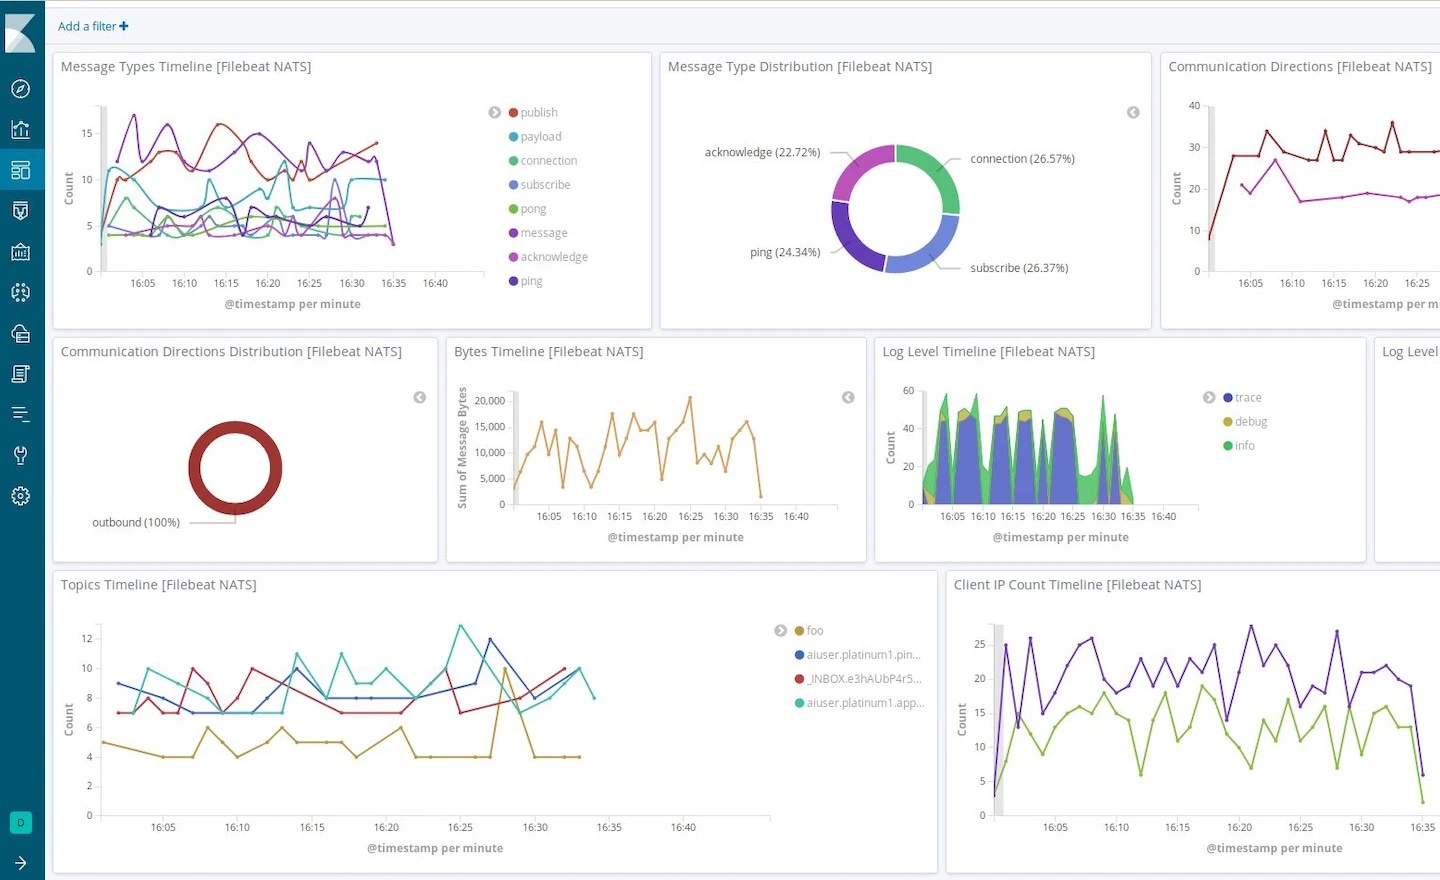
Elastic Observability combines Elasticsearch and Kibana with APM, infrastructure monitoring, logs, synthetics and user-experience data. It is particularly relevant for teams that already operate Elastic or depend on flexible full-text search over operational data.
Elastic Cloud removes much of the infrastructure work. A self-managed deployment offers more control but requires deliberate index lifecycle, shard, mapping, capacity and upgrade management.
Shortlist Elastic when: search is central to investigations or your organization already has substantial Elastic expertise.
Trade-offs: a self-managed cluster can demand significant platform ownership. Indexing and mapping choices also affect storage cost and high-cardinality behavior.
Pricing: compare managed and self-managed options using Elastic's pricing information.
8. Chronosphere: Best for governing large cloud-native telemetry estates
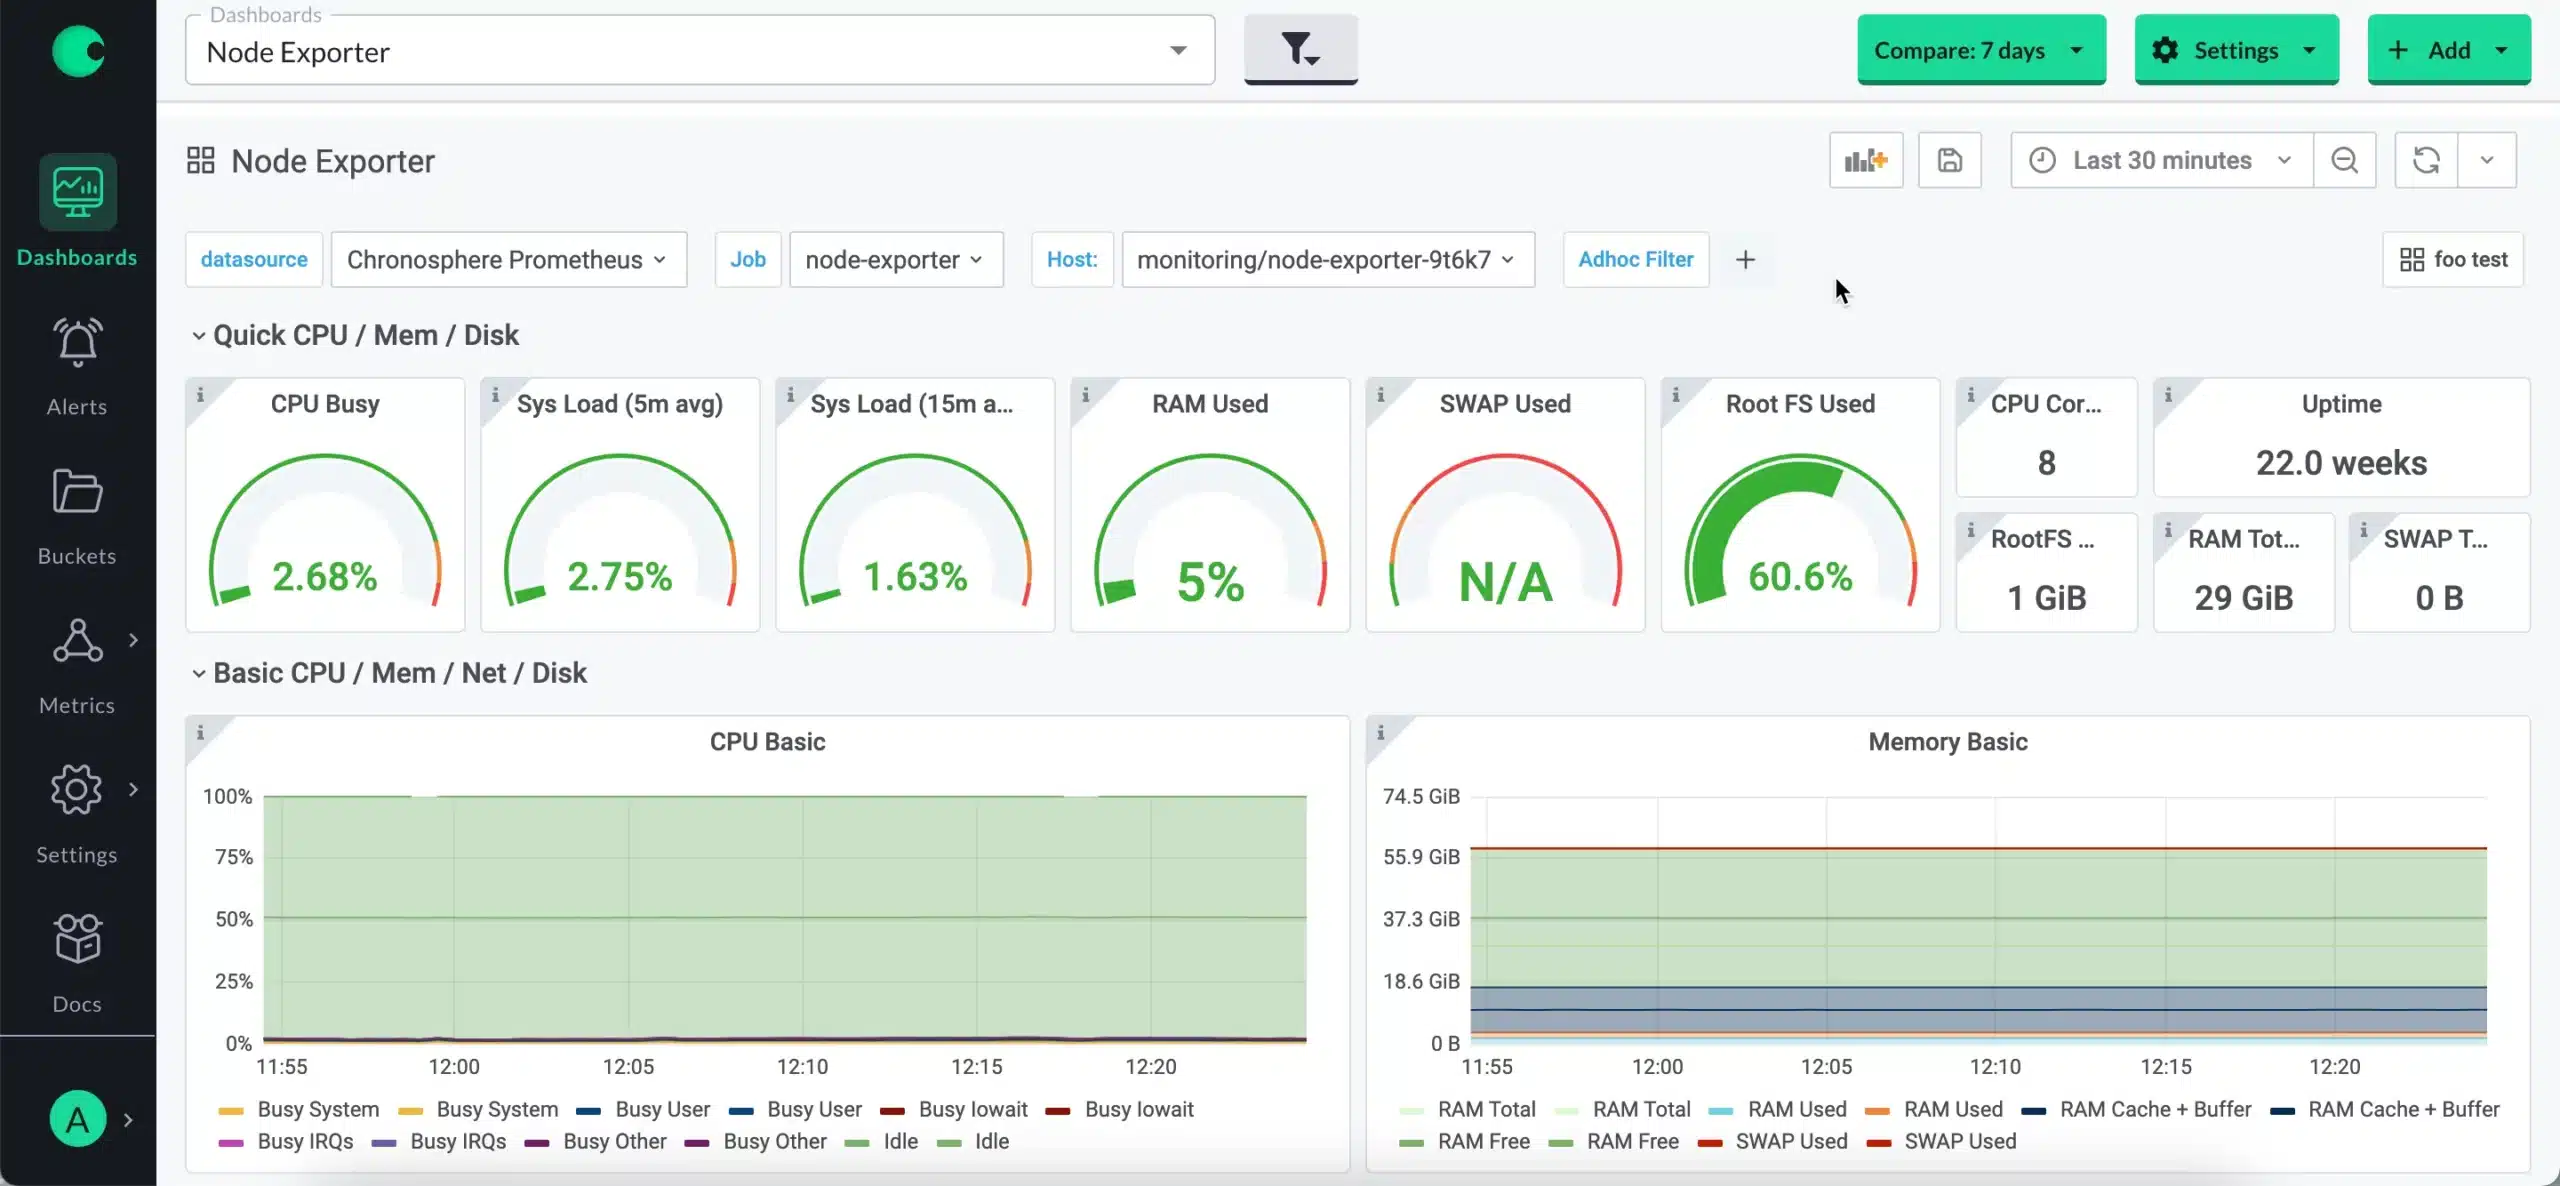
Chronosphere grew from experience operating cloud-native metrics infrastructure at large scale. Its platform emphasizes telemetry control, cost attribution and reliability across complex Kubernetes and service environments.
The product has expanded beyond its metrics origins, so buyers should assess its present logs and traces workflows directly rather than relying on older descriptions of the platform. Test the signal mix your teams use and the governance controls your platform group needs.
Shortlist Chronosphere when: cardinality, telemetry growth, cost attribution and platform governance are primary concerns.
Trade-offs: its enterprise focus and sales-led packaging may be more than smaller environments require.
Pricing: Chronosphere provides workload-specific pricing through its sales process.
9. Coralogix: Best for in-stream analytics and data-tier control
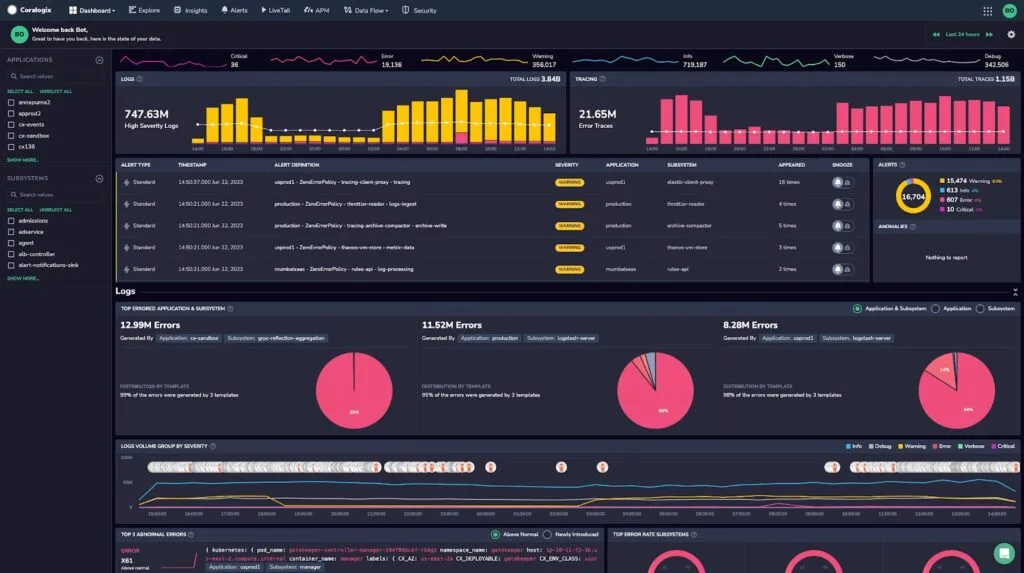
Coralogix processes telemetry in the streaming path and offers controls for routing data according to its operational value. This approach appeals to teams trying to reduce the amount of data placed in expensive searchable tiers without discarding everything else.
Customer-owned archive options are not the same as a fully self-hosted platform. Verify which services run in the vendor environment, where each data tier lives and what remains queryable after routing.
Shortlist Coralogix when: telemetry routing and cost control are central to your design.
Trade-offs: evaluate the query and correlation experience for data placed in different tiers. Frontend, APM and incident workflows should also be tested against your requirements.
Pricing: Coralogix publishes its current model on the pricing page.
10. Honeycomb: Best for high-cardinality application debugging
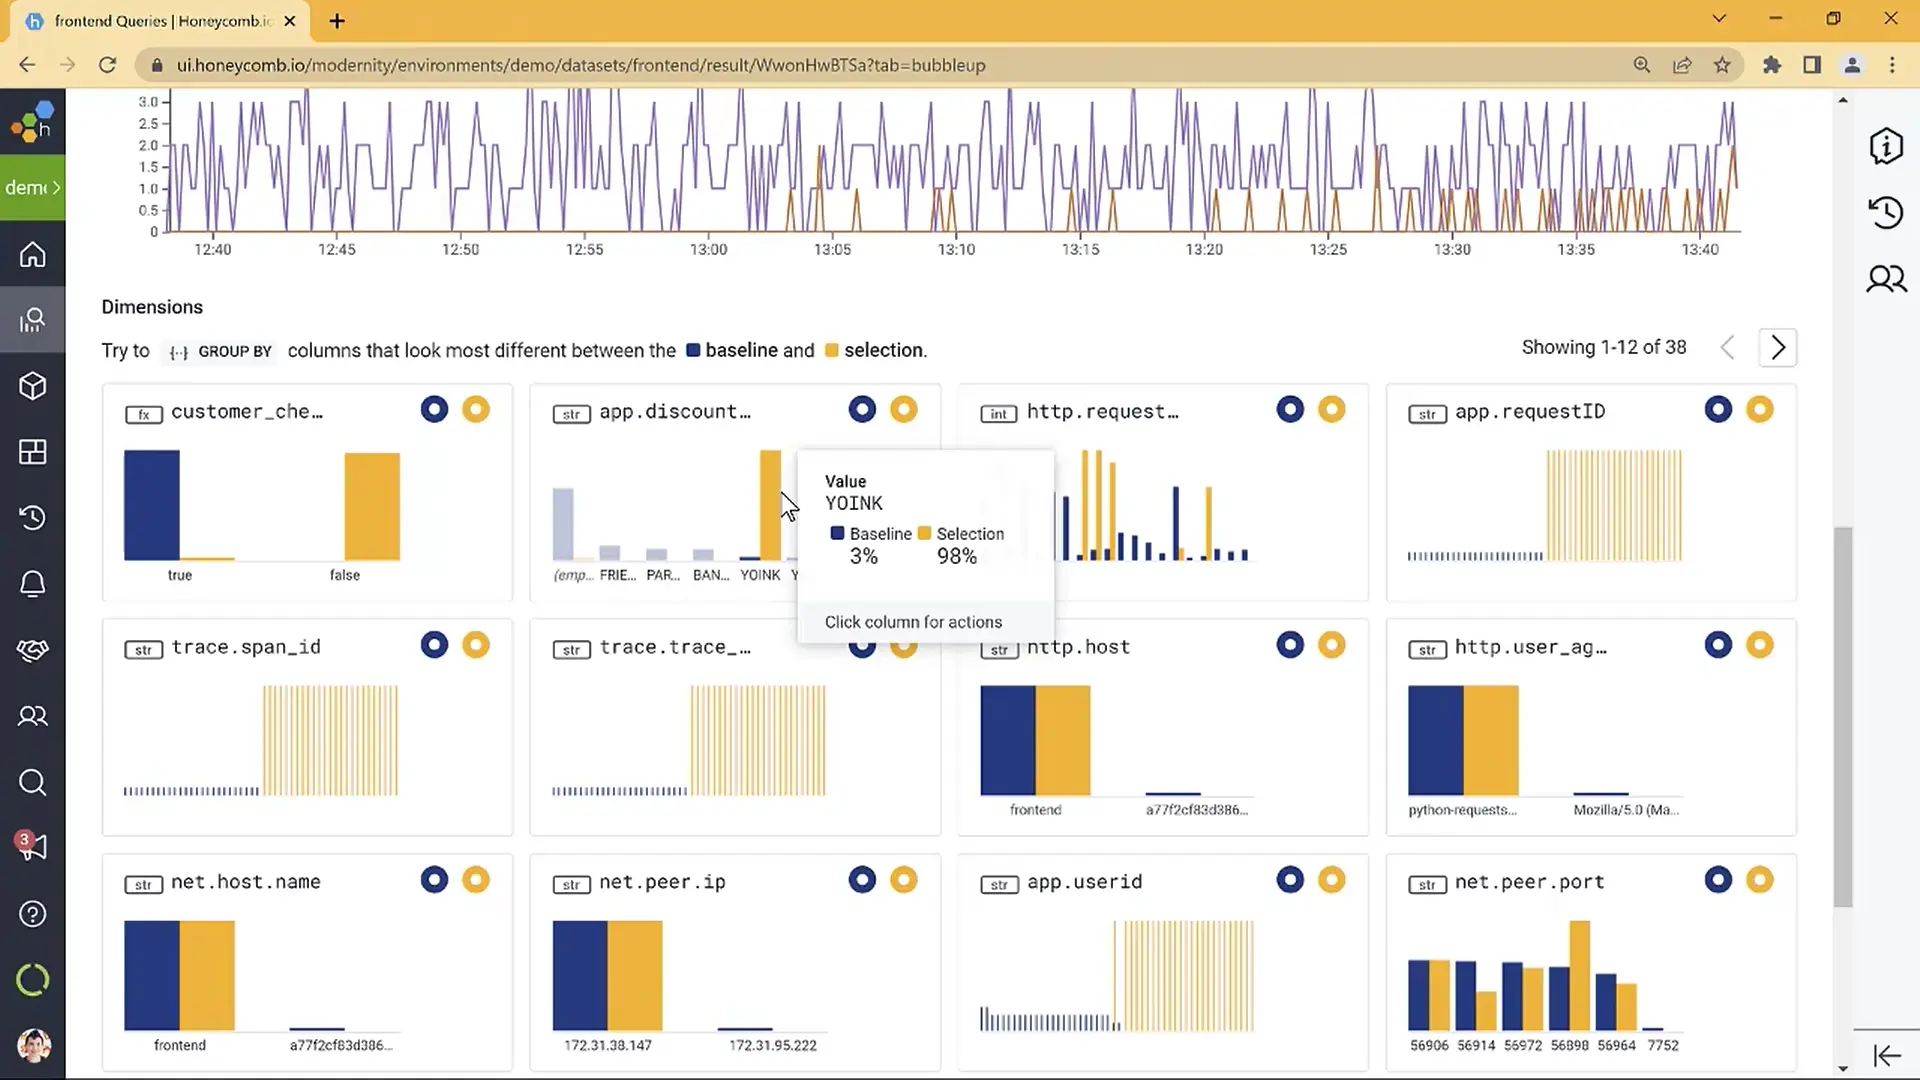
Honeycomb is designed for exploratory debugging over wide, high-cardinality events and distributed traces. Features such as BubbleUp help engineers compare anomalous and normal requests to identify dimensions correlated with a problem.
This workflow helps application teams debug distributed systems. Organizations that also require broad infrastructure monitoring, log management, synthetics, or security analytics should check whether Honeycomb will replace those tools or complement them.
Shortlist Honeycomb when: developers need to investigate unfamiliar failures across high-cardinality application data.
Trade-offs: its event-oriented workflow differs from dashboard-first operations. Broader operational coverage may require other products.
Pricing: Honeycomb lists current event allowances, retention and plans on its pricing page.
How to run the proof of concept
A vendor demo cannot show how a platform behaves under your workload. Run the same evaluation with each finalist:
- Send representative logs, metrics and traces through your OpenTelemetry pipeline.
- Reproduce two recent incidents and measure the path from alert to supporting evidence.
- Test high-cardinality fields, peak ingest, query concurrency and a realistic retention period.
- Verify SSO, RBAC, audit records, tenant boundaries and data deletion.
- Model cost at current volume, twice current volume and ten times current volume.
- Export data and change a backend to measure how portable the collection pipeline actually is.
Record time to first useful query, time to reconstruct each incident, query latency, dropped data, operator effort and the complete commercial estimate. Those numbers are more useful than a feature-count score.
Evaluating customer-controlled observability? Try Parseable with the same OpenTelemetry workload and compare the results with your other finalists.
Common evaluation mistakes
- Buying a dashboard instead of an investigation workflow: Test the route from symptom to evidence, including changes and service dependencies.
- Comparing one pricing unit: Include ingest, indexed data, retention, users, hosts, custom metrics, support and egress where they apply.
- Ignoring cardinality: Replay realistic labels and fields before signing a contract.
- Accepting AI summaries without evidence: Useful assistance should lead an engineer to queries, traces, changes, or records they can verify.
- Choosing self-hosting without an owner: Assign responsibility for upgrades, capacity, backup and recovery before treating self-hosting as the cheaper option.