
tl;dr: OpenTelemetry semantic conventions are standardized names, types, units, and meanings for telemetry data. They make attributes such as service.name, http.request.method, and http.response.status_code consistent across services, languages, and observability backends. For platform teams, that consistency is what turns instrumentation into reusable dashboards, alerts, migrations, and governance instead of another pile of one-off field names.
Everyone seems to be OpenTelemetry-native now, at least if you believe their landing pages. Every tool accepts OTLP, every architecture diagram has an OpenTelemetry Collector, and every platform promises logs, metrics, and traces in one place. Fine, but if your backend accepts OTLP and immediately turns service.name into app, http.response.status_code into a private field, and GenAI attributes into a custom schema, what exactly did you standardize?
That question lands squarely in platform engineering because observability is not just where telemetry goes after an application is already running. It is part of how teams build, ship, debug, own, and improve software. OpenTelemetry already gave us a huge win: application owners can decide what to instrument and how to instrument it with open APIs, SDKs, and auto-instrumentation. Semantic conventions are the next part of that win because they decide whether all those signals speak a shared language, or whether every team gets freedom at emit time and chaos at query time.
Instrumentation was the first win
Instrumentation used to be where observability platforms quietly took control away from teams. You installed the vendor agent, got the spans and fields it decided to produce, then tried to explain your actual application through that vocabulary. If the agent missed your framework or flattened your business flow into a few generic fields, you mostly lived with it or opened a support ticket.
OpenTelemetry changed that bargain by making instrumentation something application teams could own again: put the API in code where intent exists, use SDKs and auto-instrumentation where they help, send data over OTLP, and use the OpenTelemetry Collector to route, enrich, filter, or sample it without tying every service to one backend. If you want the full pipeline version of that story, the OpenTelemetry and Parseable stack guide goes deeper into the moving parts.
To be honest, from my side, OTLP ingestion inside an observability tool is not a privileged feature anymore because it is the baseline. If a tool does not have an OTLP endpoint to receive data, I would first ask what foundation it is building on, because accepting the standard protocol is the first check before we even talk about whether the tool is actually OpenTelemetry-native.
The real win is not "we have an endpoint." The real win is that a payment team can add a span around checkout authorization, a search team can track index refresh latency, and a platform team can enrich every signal with service.name, k8s.namespace.name, and deployment.environment.name. OpenTelemetry brought control of emitting signals back to engineering teams, and semantic conventions make sure that control does not become chaos.
Semantic conventions are the shared language
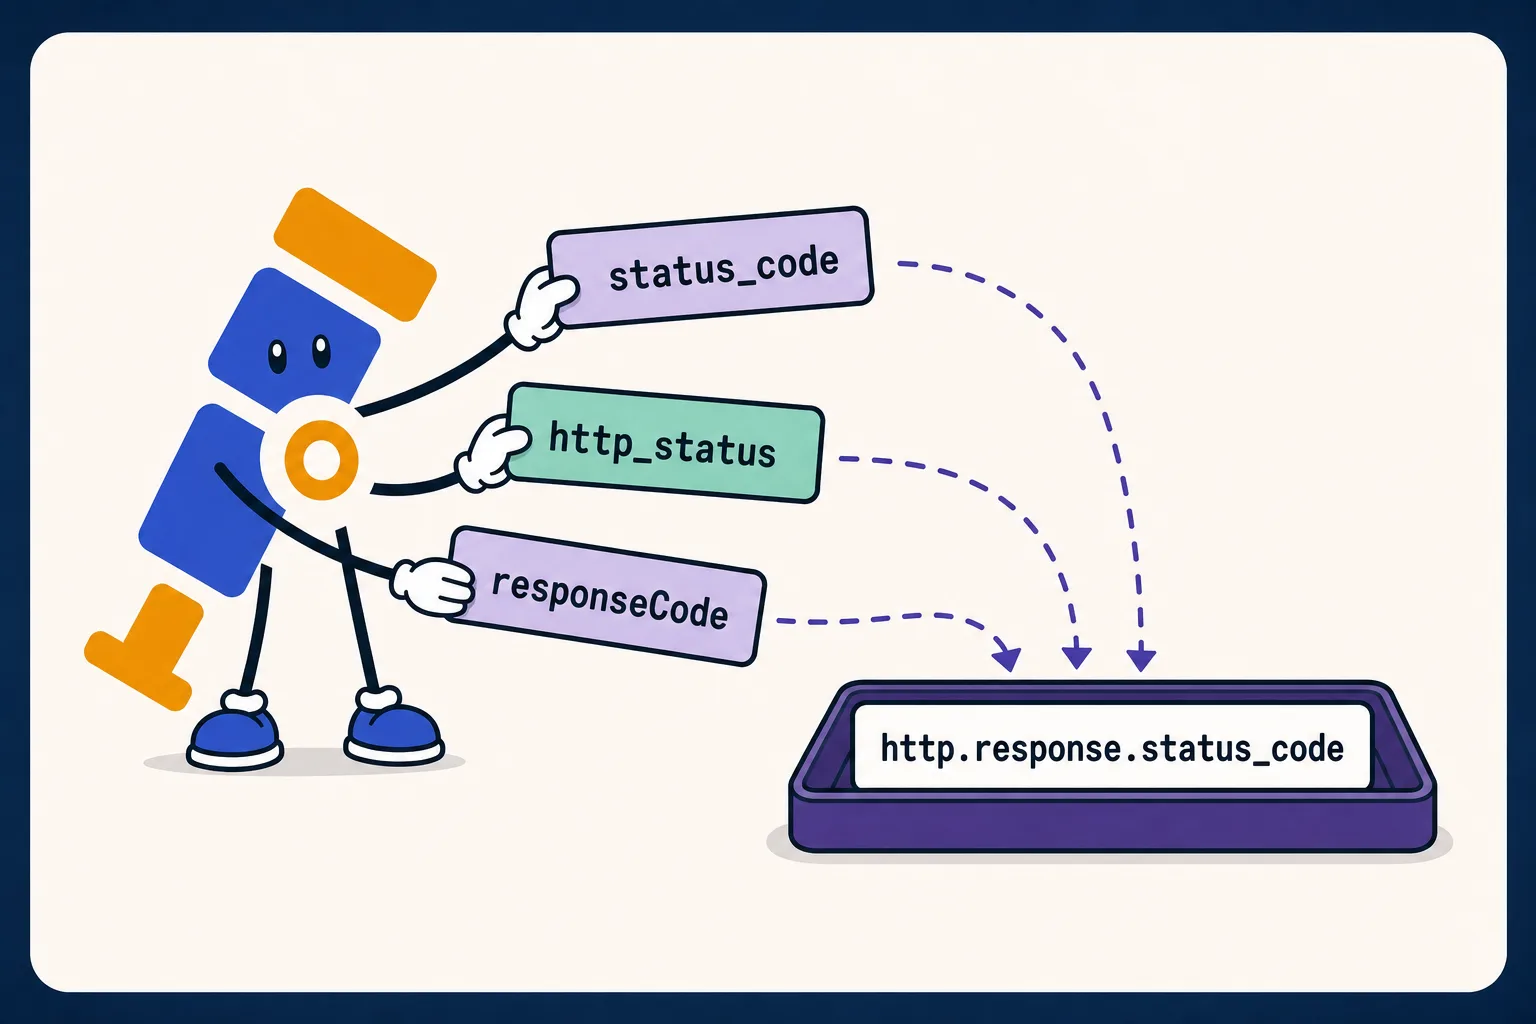
Standards are easy to make fun of until you are six dashboards deep in a production incident and every service has invented a new spelling for the same thing. One team calls it status_code, another calls it http_status, another calls it responseCode, and the trace is using a different field again. Nobody planned the mess, but that is what happens when teams ship code without a shared language.
OpenTelemetry semantic conventions are that shared language. They define names, types, units, meanings, and accepted values for the things telemetry describes, including resources, spans, metrics, logs, metric instruments, and attributes. When you see service.name, http.request.method, http.response.status_code, or db.system.name, you should not need a private legend to know what the field means.
Without that contract, telemetry turns into a group chat where every service speaks its own dialect. status can mean HTTP status, job status, order status, or error status. duration can be milliseconds in one place and seconds in another. The SDK emits one shape, the OpenTelemetry Collector enriches another shape, the backend stores a third shape, and by the time someone opens a dashboard, nobody knows which meaning survived. Semantic conventions are how platform teams keep that from happening because they make names portable across logs, metrics, traces, and the tools that read them, so teams can spend less time translating fields and more time understanding the system.
The platform engineering problem
Platform engineering starts when the same problem shows up in enough teams that solving it one service at a time becomes irresponsible, and observability is exactly that kind of problem. If every team has to learn the SDK, choose resource attributes, configure the OpenTelemetry Collector, name fields, build dashboards, and explain all those choices during an incident, you have not created ownership, you have created homework.
A good observability platform gives teams a paved path:
- a standard SDK bootstrap
- auto-instrumentation where it is useful
- an OpenTelemetry Collector pipeline with sane defaults
- resource attributes applied consistently
- reusable dashboards and alerts
- a clear place to add business-specific attributes
Semantic conventions are what keep that paved path honest. Without them, every team becomes a tiny schema committee. The Java service picks one field name, the Python service picks another, the gateway team uses its load balancer naming, and the AI team invents llm_model_name because it shipped on a Friday and looked reasonable. Then a platform engineer tries to build one request-error dashboard across the fleet, and a simple query turns into a museum of everyone's past decisions.
status_code >= 500
OR http_status >= 500
OR responseCode >= 500
OR http.status_code >= 500
OR http.response.status_code >= 500
That query is schema debt, not observability maturity. Semantic conventions are the platform contract that keeps this debt from spreading from one team into every dashboard, alert, runbook, and incident review.
A real example: one HTTP error
The best way to understand semantic conventions is not to admire the spec, it is to walk into a bad checkout incident. Orders are stuck, the gateway is throwing 502s, checkout logs are full of retries, payment spans have gone slow, and the metric everyone is staring at says the error rate just stepped off a cliff. The question in the room is painfully simple: which service is failing, for which users, in which environment, and what changed?
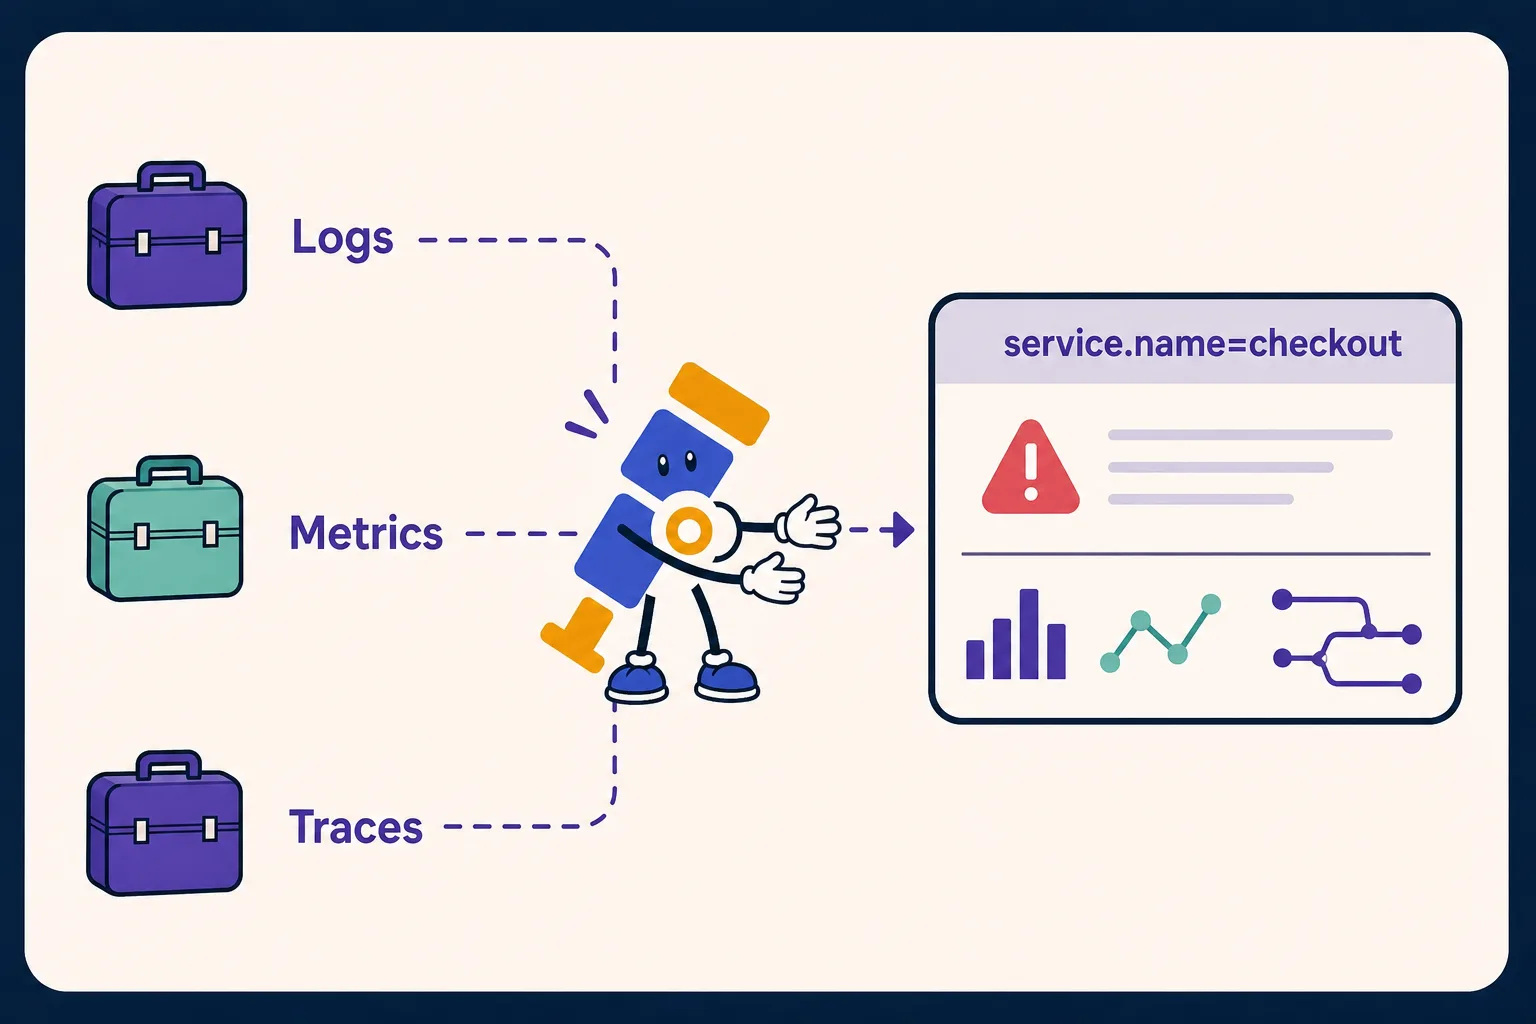
If logs, metrics, and traces share the same resource model, the first few moves are pleasantly boring. You pivot by service.name, service.version, k8s.namespace.name, and deployment.environment.name; you filter to production without guessing whether this team called it prod, production, or live; and you ask for HTTP failures using http.response.status_code instead of remembering each team's favorite spelling. You can move from a slow trace to logs from the same service, compare metrics for the same route, and keep the incident focused on the system instead of the schema.
Now compare that with the version many teams have actually lived with: logs have status, metrics have code, traces still have http.status_code because one service is on older instrumentation, the gateway emits upstream_status, and the dashboard works only because someone once hid a mapping table under the floorboards. That is not flexibility, it is cognitive load at the exact moment your brain is already full. Semantic conventions protect the operator's attention by removing one whole class of argument from the incident: what did this field mean again?
The use cases that make semantic conventions necessary
The value of semantic conventions does not show up in a spec review. It shows up on the third incident call, the fifth dashboard request, and the first time an SDK upgrade changes a field name someone quietly depended on. Here is where platform teams feel it first:
-
Correlation across signals: Logs, metrics, and traces are different signals, but they are usually describing the same system at the same time. If they share resource attributes, a trace from
checkout-apiinproductioncan lead you to logs and metrics from the same service without manual joins, aliases, or dashboard-specific magic. That is the difference between asking, "show me everything from this service," and asking three slightly different questions because every signal learned a different language. -
Reusable dashboards: Every team should not rebuild the same request latency, error rate, saturation, and dependency panels from scratch. Reusable dashboards only work when names are predictable, so if services use
http.server.request.durationfor server request duration and consistent HTTP attributes for method, route, and status, the platform team can ship one dashboard pattern that works across many services. If every service invents names, dashboards stop being a platform capability and become bespoke consulting work. -
Cleaner alerts: Alerts are only as good as the data they query. An elevated 5xx alert should not care whether a service writes
statusCode,httpStatus, orhttp.response.status_code, and a latency SLO should not break because one framework emitsroutewhile another emitshttp.route. Semantic conventions let platform teams define alerts around stable concepts, not local spellings that happened to make sense inside one repository. -
Easier SDK upgrades: SDK upgrades should not become surprise schema migrations. Semantic conventions make drift visible, so teams can see which convention version they emit, which dashboards depend on older names, and which backend views need to support both shapes during the migration window.
-
Better data governance: Observability data is production data, which means it can contain tenant identifiers, user identifiers, prompts, errors, URLs, tool arguments, and sometimes sensitive content. Semantic conventions help platform teams separate stable, low-cardinality dimensions from risky high-cardinality ones, and they make it easier to write OpenTelemetry Collector processors that redact, drop, or transform known fields without guessing what each team called them.
How to manage semantic-convention changes
Semantic conventions are standards, not museum pieces. Some convention groups are stable, some are still in development, and platform teams need to treat that status as operational information. Pin SDK and auto-instrumentation versions, publish the semantic-convention version your golden path expects, and check convention changes before rolling a new instrumentation image across every service.
The HTTP migration is the example most teams will recognize. Older instrumentation often emitted fields such as http.status_code, while stable HTTP conventions use fields such as http.response.status_code. During migrations, OpenTelemetry supports OTEL_SEMCONV_STABILITY_OPT_IN values such as http/dup, which lets old and stable HTTP attributes coexist for a window while dashboards, alerts, and backend views catch up. That is not glamorous work, but it is exactly the kind of work that keeps a platform from surprising every team at once. The HTTP semantic-convention migration guide is worth reading before you treat an SDK upgrade like a normal dependency bump.
Custom attributes need the same discipline. Use OpenTelemetry names first, then add domain fields such as tenant.id, checkout.step, or plan.tier only when you can name an owner, expected cardinality, and allowed values. Put those rules into SDK helpers, Collector processors, sample services, CI checks, or dashboard review. A naming guideline that nobody enforces is just a nice document people feel bad about ignoring.
GenAI makes this more urgent
Everything above gets sharper once AI enters the system. A normal web service has a shape we all recognize: receive a request, call a database, maybe call another service, return a response. Agents do not stay inside that neat little box because they read instructions, plan steps, call tools, retrieve context, ask models for outputs, inspect results, and then keep going on our behalf. That is why AI infrastructure observability cannot sit outside the platform observability story.
That is a different operational surface because agents write code, update tickets, run commands, call APIs, retrieve documents, and execute successive tasks based on our instructions. When one behaves strangely, a transcript is not enough. You need to know which agent ran, which model it requested, which model actually responded, how many input and output tokens it burned, which prompt version was active, what retrieval returned, which tool was called, and whether the failure was in the model, the tool, the database behind the tool, or the workflow around all of it.
Without a shared vocabulary, GenAI observability becomes schema drift at startup speed. One team logs model, another logs llm.model, another logs gen_model, one dashboard calls tokens prompt_tokens and completion_tokens, and another calls them input and output. The AI team can explain one agent, the platform team can explain one service, the support team can explain one ticket, but nobody can explain the system without a long translation exercise.
The OpenTelemetry GenAI semantic conventions are worth reading if you want to go deeper into the exact fields and signal shapes. The GenAI work now lives in its own OpenTelemetry repository, and many fields are still marked development, so check the current definitions before turning examples into policy. The useful direction is already clear: attributes such as gen_ai.operation.name, gen_ai.provider.name, gen_ai.request.model, gen_ai.response.model, gen_ai.agent.name, and gen_ai.tool.name give platform teams a common vocabulary for model calls, agent runs, and tool execution. Token usage can be captured with span attributes such as gen_ai.usage.input_tokens and gen_ai.usage.output_tokens, and with metrics such as gen_ai.client.token.usage where gen_ai.token.type separates input and output tokens.
This is where semantic conventions stop being a naming preference and become the thing that lets AI telemetry join the rest of the platform. The next example is what that looks like when a support agent suddenly gets expensive and nobody sees a clean error.
A GenAI example platform teams will recognize
Suppose a support agent gets expensive overnight, but nothing is technically on fire. The AI team sees token usage climb, the platform team sees customer database latency creep up, the support team sees slower ticket resolution, and nobody has a clean exception to point at. Everyone is looking at something true, but nobody is looking at the whole system.
Without shared GenAI conventions, this becomes a meeting about meanings. Does model mean the requested model or the model that actually answered? Are tokens input tokens, output tokens, cached tokens, or billable tokens? Does tool mean the function the agent called, the MCP server behind it, or the workflow step around it? This is how teams lose an afternoon while the agent keeps spending money.
With GenAI semantic conventions, the investigation gets boring in the best possible way:
gen_ai.agent.nametells you which support agent is involvedgen_ai.operation.nameuses current well-known values such aschat,embeddings,generate_content,execute_tool,invoke_agent,invoke_workflow,plan, andretrievalwhen they apply, and documented custom values when they do notgen_ai.request.modelandgen_ai.response.modelshow the model that was requested and the model that respondedgen_ai.usage.input_tokens,gen_ai.usage.output_tokens, orgen_ai.client.token.usageshow whether the agent is sending more context or receiving longer outputsgen_ai.client.operation.durationshows whether model-facing operations are getting slowergen_ai.tool.nameshows which tool calls are involved- normal HTTP and database conventions connect those tool calls back to platform services
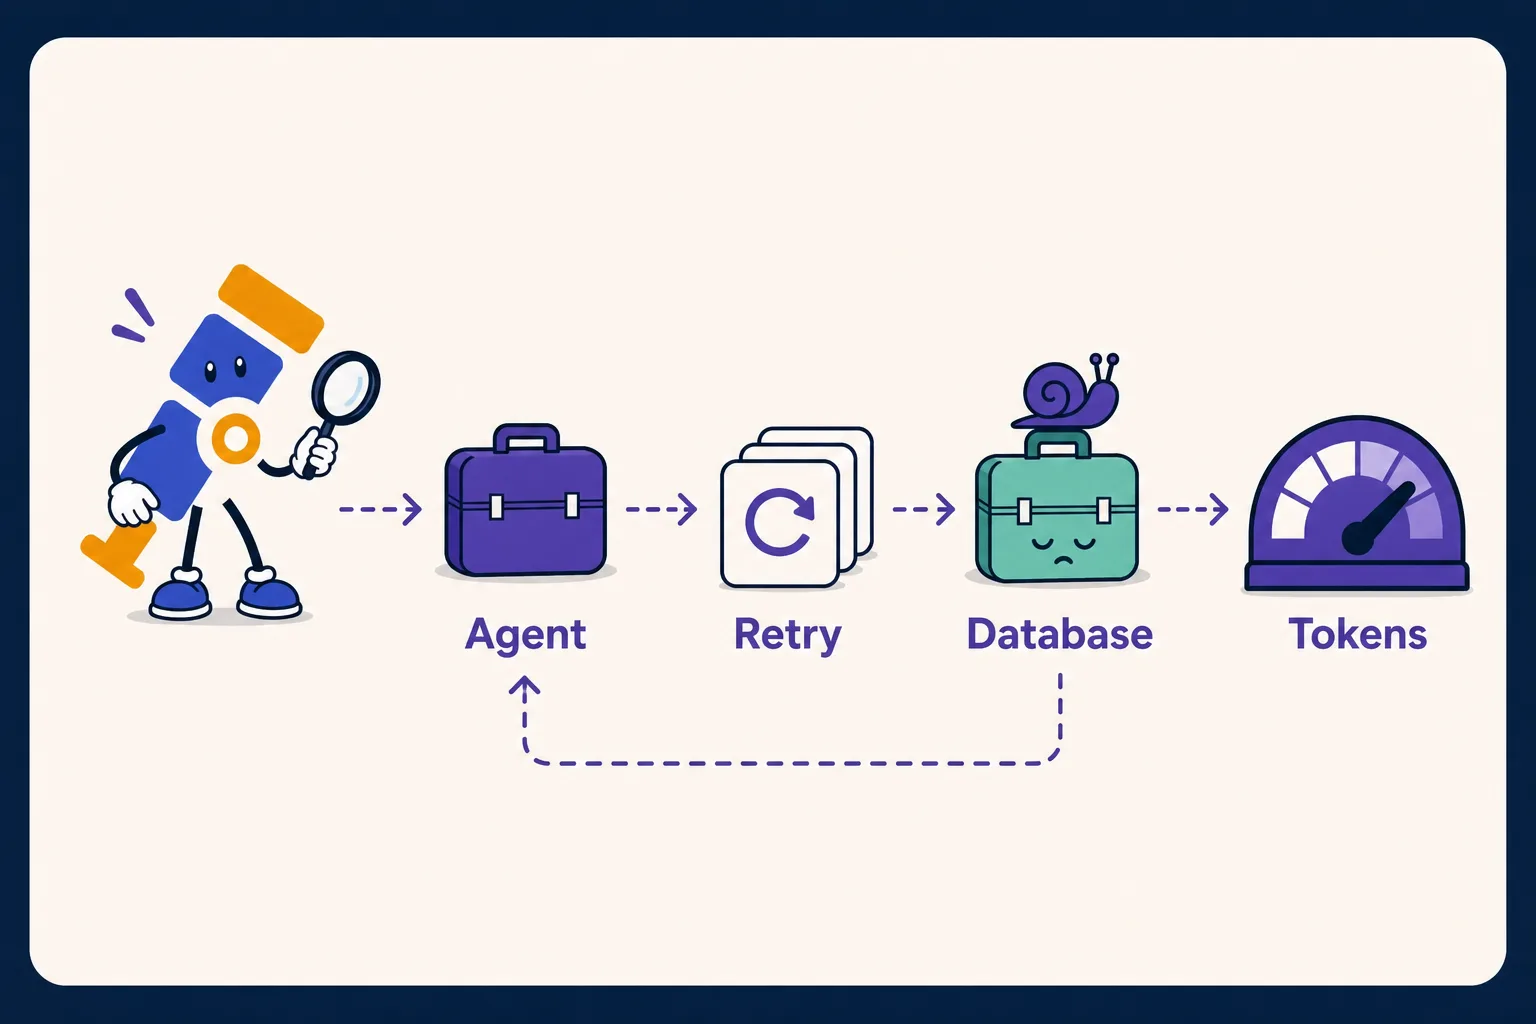
Now the story has shape: the support agent is not mysteriously "using more tokens"; it is retrying a customer lookup tool because the customer database is slow, the retry loop adds more context, the larger context increases input tokens, the model spends longer producing answers, and the support queue slows down. That is the platform engineering point: agent telemetry cannot live in a special corner if the thing causing the AI problem is a database, a network call, a deployment, or a tool the agent depends on.
One important note before we go from semantics to native support: GenAI telemetry can contain sensitive data. Prompts, messages, system instructions, tool arguments, tool results, and retrieval documents should be captured carefully with redaction, truncation, sampling, and opt-in content capture. Semantic conventions give you the field names, but platform policy still decides what is safe to store.
What OpenTelemetry-native support should mean
Recently I was reading Juraci's post, OTLP support is not OpenTelemetry support, and it gave me a cleaner way to articulate something I have felt for a while. I have seen plenty of tools say they support OpenTelemetry, or that they are OpenTelemetry-native, but native often means different things from vendor to vendor and tool to tool: for one tool it means an OTLP endpoint, for another it means an OpenTelemetry Collector example in the docs, and for another it means ingesting OTLP and then translating the data into a private schema that users have to learn at query time.
So if you are reading this and evaluating a tool, do not stop at the OpenTelemetry-native badge. Ask three harder questions:
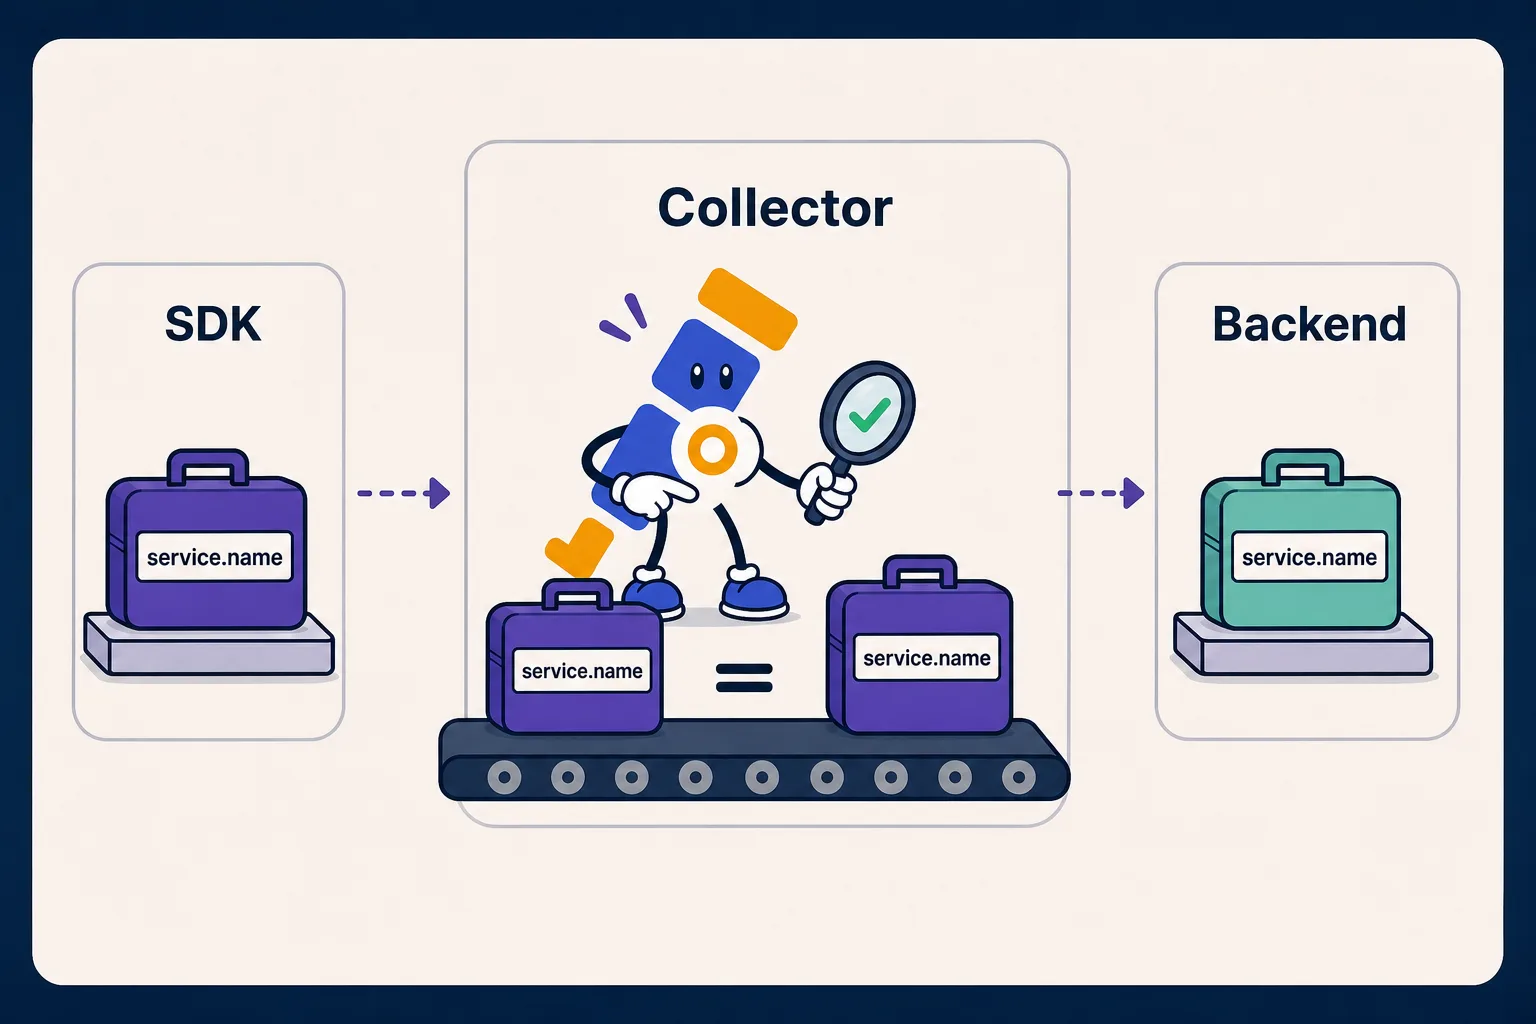
- Does the tool preserve OpenTelemetry semantics from ingest to query, so fields like
service.nameandhttp.response.status_codestay visible as the names your teams emitted instead of being mapped into a private schema? - Do logs, metrics, and traces share the same resource model, so a service, namespace, environment, version, or cloud region means the same thing across every signal without a join table or dashboard-specific workaround?
- Does the platform stay portable as conventions and pipelines change, meaning semantic-convention drift is handled explicitly, SDK upgrades have a migration path, and any OpenTelemetry Collector distribution can send data without having OTLP reshaped into a private dialect?
This distinction is the whole game because many tools accept OTLP ingestion and then internally reshape the data into proprietary fields. The bytes arrive through an open protocol, but the meaning gets translated into a private schema, so dashboards, queries, and exports start depending on that private vocabulary.
However, custom dashboards are sometimes different. If a team writes a dashboard directly against an older attribute, that dashboard may need to be updated during a convention migration. That is a reasonable line because native support does not mean pretending semantic conventions never change. It means preserving the original attributes, making built-in views resilient, and giving teams a clear migration path instead of silently rewriting their data.
What platform teams should standardize
After all of this, the wrong move is to create a 40-page naming policy and hope every team reads it before shipping. The platform move is to make the useful shape the default shape, so a new service starts with good telemetry before anyone opens a dashboard.
-
Start with resource identity: Make
service.name,service.version, deployment environment, Kubernetes, cloud, and region attributes consistent first. If these are messy, every higher-level view will be messy too because you cannot reliably answer which service, which version, which namespace, and which environment produced the signal. -
Standardize common protocols before inventing local names: HTTP, database, messaging, RPC, runtime, and infrastructure telemetry already have OpenTelemetry conventions, so use them before creating local field names. A company-specific name for a concept OpenTelemetry already covers is not customization, it is future migration work with a nicer label.
-
Give product teams a safe place for domain context: Business fields like
tenant.id,checkout.step, orplan.tiercan make telemetry far more useful, but they need owners, naming rules, and cardinality limits. Otherwise domain context slowly turns into a junk drawer that every incident has to search through. -
Treat GenAI fields as platform fields early: If AI agents are becoming part of production workflows, then model, provider, operation, agent, token usage, tool calls, retrieval, and prompt version should not be invented independently by each team. Standardize the shape early, then be strict about what content is captured, redacted, sampled, or dropped.
-
Test the round trip: Emit a known span, metric, and log from a sample service, send them through the OpenTelemetry Collector, query them in the backend, and confirm the attribute names are still the names you emitted. That small test tells you whether your platform is preserving OpenTelemetry or merely accepting OTLP.
Conclusion
OpenTelemetry gave teams control over instrumentation, and semantic conventions keep that control usable after the fifth team, the tenth service, and the first AI agent joins the production path. For platform engineers, this is the difference between "every team can emit anything" and "every team can emit useful telemetry in a shared language."
Without a shared vocabulary, freedom at emit time becomes translation work at query time. With semantic conventions, logs, metrics, traces, and GenAI telemetry can describe the same system in the same language, so platform teams can ship reusable dashboards, safer upgrades, cleaner alerts, and tooling that does not collapse into per-service exceptions. That is the conclusion for me: semantic conventions are not a side note in OpenTelemetry, they are the part that turns telemetry into platform infrastructure.