

An OpenTelemetry Collector configuration can look correct and still do nothing.
The receiver is present. The exporter has the right endpoint. The processor is indented properly. The Collector even starts. No telemetry moves because those components were never added to a pipeline.
That detail catches people because the configuration has two jobs. It defines components, then activates them under service.pipelines.
This guide builds one working configuration and reads it from the bottom up. By the end, you will have an OTel Collector config that accepts logs, metrics and traces, protects itself from memory pressure, batches data and exports it to a backend. Keep the official Collector configuration reference nearby when a component exposes options beyond this example.
If receivers, processors and exporters are new to you, read the OpenTelemetry Collector guide first. This article stays with the YAML.
A working OpenTelemetry Collector configuration
Start with a small configuration that can prove its own data path. The debug exporter prints a summary of received telemetry, so a remote backend cannot complicate the first test.
Save this as otel-collector.yaml:
receivers:
  otlp:
    protocols:
      grpc:
        endpoint: 0.0.0.0:4317
      http:
        endpoint: 0.0.0.0:4318

processors:
  memory_limiter:
    check_interval: 1s
    limit_mib: 512
    spike_limit_mib: 128
  batch:
    timeout: 5s
    send_batch_size: 1024

exporters:
  debug:
    verbosity: basic

extensions:
  health_check:
    endpoint: 0.0.0.0:13133

service:
  extensions: [health_check]
  pipelines:
    traces:
      receivers: [otlp]
      processors: [memory_limiter, batch]
      exporters: [debug]
    metrics:
      receivers: [otlp]
      processors: [memory_limiter, batch]
      exporters: [debug]
    logs:
      receivers: [otlp]
      processors: [memory_limiter, batch]
      exporters: [debug]
Run a pinned version of the Contrib distribution:
docker run --rm \
  -p 127.0.0.1:4317:4317 \
  -p 127.0.0.1:4318:4318 \
  -p 127.0.0.1:13133:13133 \
  -v "$PWD/otel-collector.yaml:/etc/otelcol-contrib/config.yaml:ro" \
  otel/opentelemetry-collector-contrib:0.158.0
Applications can now send OTLP/gRPC or OTLP/HTTP to ports 4317 and 4318 respectively. The Collector writes a summary to its own output. The health extension responds on port 13133.
With telemetrygen installed, send one log through the gRPC receiver:
telemetrygen logs \
  --otlp-endpoint localhost:4317 \
  --otlp-insecure \
  --logs 1
The Collector output should report one received log record. If it does, the receiver, processors and debug exporter are connected.
The version is pinned because a working production configuration should not change when an image tag moves. Update it deliberately after testing the new build and its components.
Read the config from service.pipelines
The bottom of the file tells you what the Collector will run.
service:
  extensions: [health_check]
  pipelines:
    traces:
      receivers: [otlp]
      processors: [memory_limiter, batch]
      exporters: [debug]
The traces pipeline activates four components:
otlpreceives tracesmemory_limiterchecks memory before more work happensbatchgroups spans before exportdebugprints the result
Defining batch under processors only makes that configuration available. Removing it from service.pipelines.traces.processors disables it for that pipeline. The same rule applies to receivers, exporters, connectors and extensions.
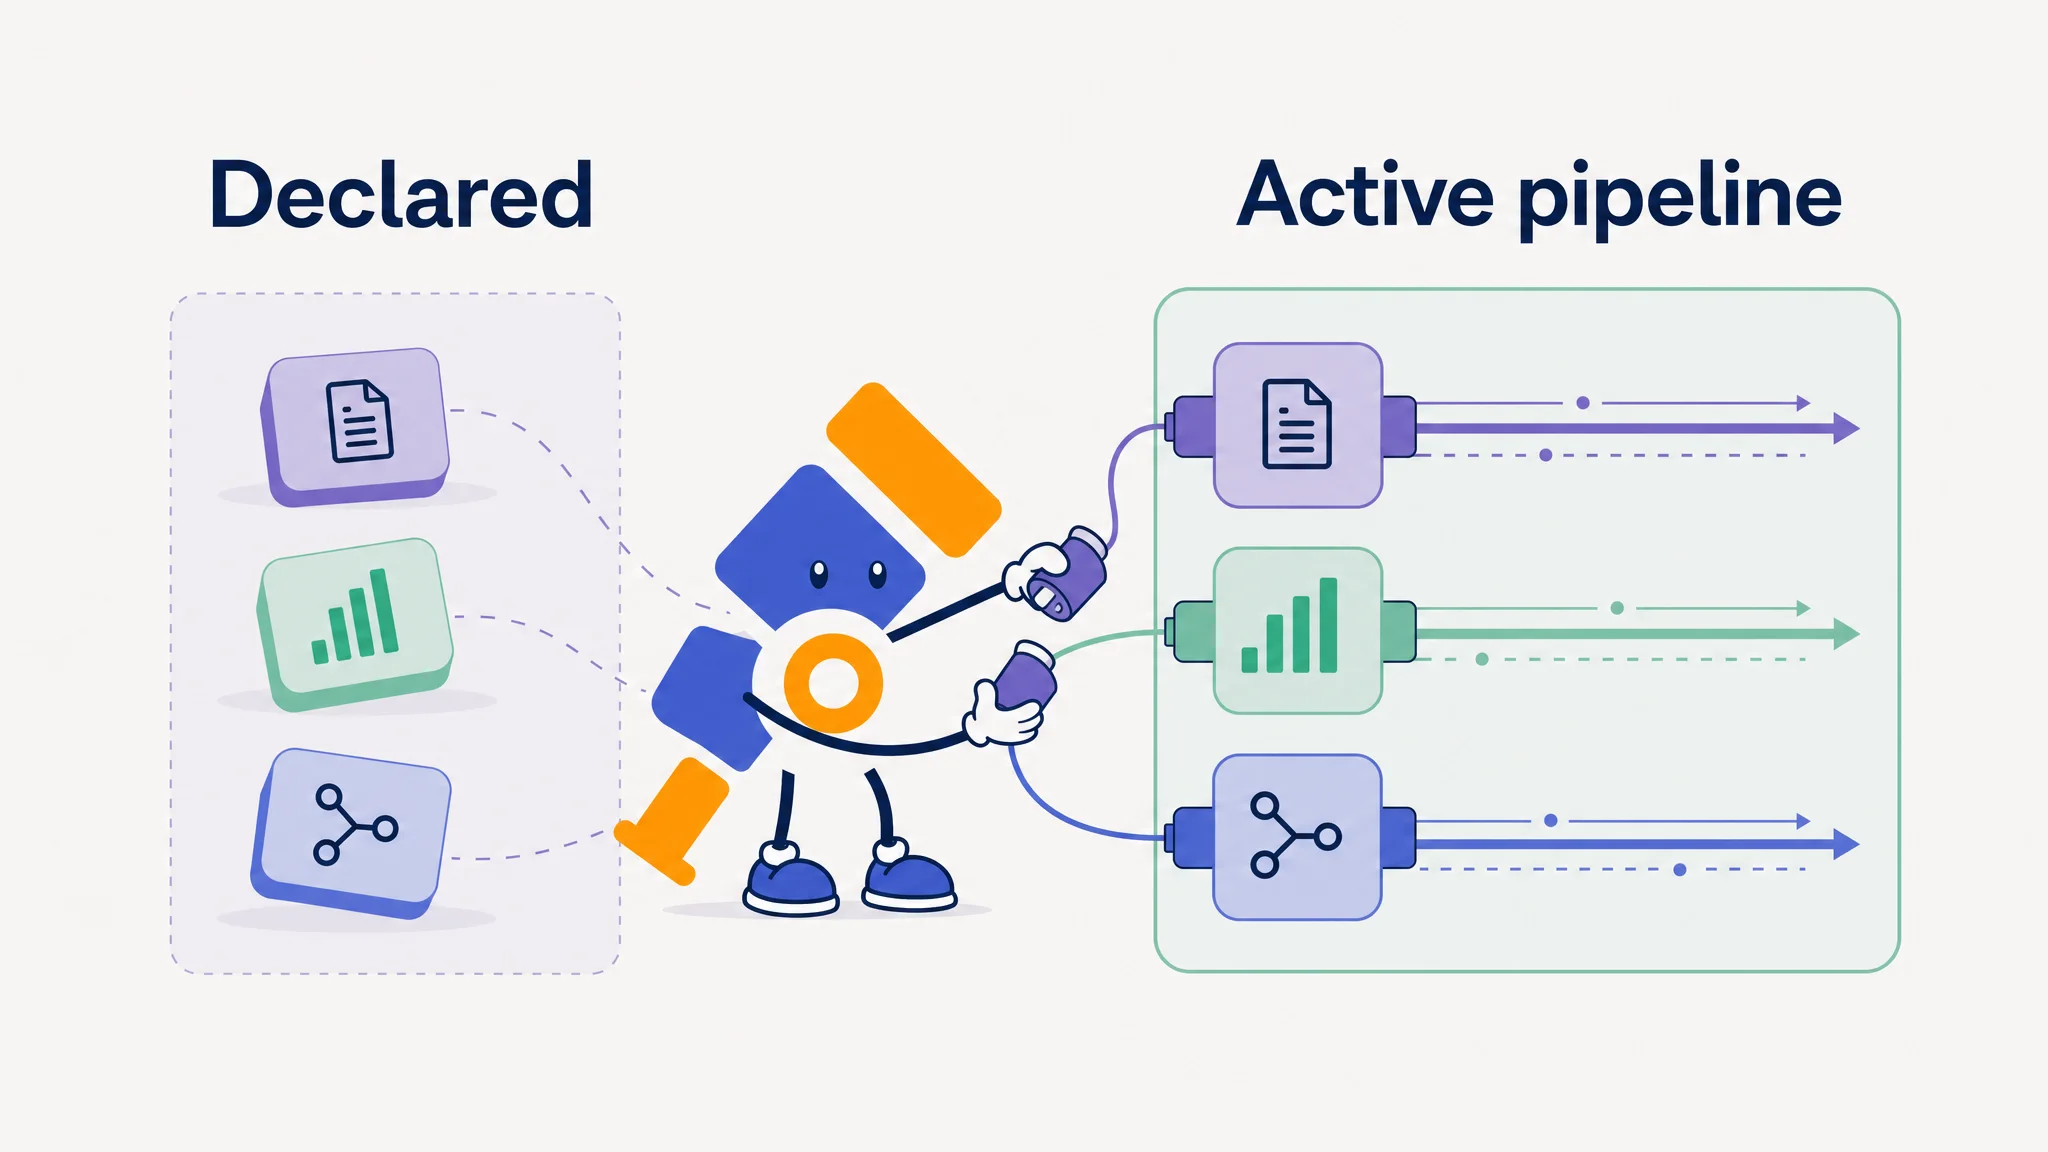
When a config grows beyond a screen, begin every investigation at service. Follow each referenced name back to its definition. This is faster than reading the YAML from line one and assuming every block is active.
Configure receivers
Receivers bring telemetry into the Collector. Some listen for pushed data, while others pull from a source.
The OTLP receiver supports logs, metrics and traces over gRPC and HTTP:
receivers:
  otlp:
    protocols:
      grpc:
        endpoint: 0.0.0.0:4317
      http:
        endpoint: 0.0.0.0:4318
Binding to 0.0.0.0 makes the receiver reachable on every network interface inside the container. That is useful when other containers or hosts must connect, but it also expands the exposed surface. Bind to localhost when every client runs on the same host, or restrict access through your network policy and authentication.
Receivers are signal-specific. OTLP supports all three signals, but filelog handles logs and prometheus handles metrics. A receiver can appear only in pipelines for signals it supports.
Configure processors in the order they should run
Processors modify or buffer telemetry between a receiver and an exporter. Their order in the pipeline is execution order.
processors:
  memory_limiter:
    check_interval: 1s
    limit_mib: 512
    spike_limit_mib: 128

  resource/environment:
    attributes:
      - key: deployment.environment.name
        value: production
        action: upsert

  batch:
    timeout: 5s
    send_batch_size: 1024
Then activate them in that order:
processors: [memory_limiter, resource/environment, batch]Put the memory limiter first so it can apply backpressure before transformations allocate more memory. Put enrichment, filtering and redaction in the middle. Batch after those operations so records are grouped close to export.

The exact limits and batch size depend on traffic and available resources. The memory limiter processor guide explains how to size that safeguard rather than copying 512 MiB into every deployment.
Configure exporters
Exporters send processed telemetry to a destination. Begin with debug, then add the real backend after the local pipeline works. The Collector exporters guide covers protocol selection, endpoint paths, fan-out, retries, and queues.
exporters:
  debug:
    verbosity: basic

  otlp_http/primary:
    endpoint: ${env:OTLP_ENDPOINT}
    headers:
      Authorization: ${env:OTLP_AUTH_HEADER}
The identifier uses type/name form. otlp_http selects the exporter implementation; /primary gives this instance a name. Older examples use otlphttp, but the OTLP HTTP exporter reference marks that alias as deprecated. You can create another instance of the same exporter type without a collision:
exporters:
  otlp_http/primary:
    endpoint: ${env:PRIMARY_OTLP_ENDPOINT}
  otlp_http/archive:
    endpoint: ${env:ARCHIVE_OTLP_ENDPOINT}
Reference the full identifier in a pipeline:
exporters: [otlp_http/primary, otlp_http/archive]Each destination can fail or slow down independently. This page stops at configuring the exporters; the Collector data loss guide covers queue capacity, retry policy and persistent storage.
Enable extensions separately
Extensions support the Collector process without carrying telemetry through a pipeline. Common examples provide health checks, authentication, persistent storage, profiling and diagnostic pages.
extensions:
  health_check:
    endpoint: 0.0.0.0:13133

service:
  extensions: [health_check]
Extensions have the same define-and-enable rule. A health_check block outside service.extensions is configured but inactive.
The endpoint is useful for liveness and readiness probes, but it cannot prove that telemetry is reaching the backend. Use OTel Collector internal metrics to monitor refused data, exporter queues and failed sends.
Use only components included in your Collector distribution. A config copied from a Contrib example may fail against the smaller Core build because the binary does not contain the referenced receiver or extension.
Keep secrets out of the YAML
Collector configuration supports environment-variable expansion with ${env:NAME}:
exporters:
  otlp_http/primary:
    endpoint: ${env:OTLP_ENDPOINT}
    headers:
      Authorization: ${env:OTLP_AUTH_HEADER}
Pass those values through your container runtime, secret manager or Kubernetes Secret. Do not commit API keys to the config file.
You can supply a default with ${env:NAME:-default}. Defaults are useful for harmless settings such as an environment name. They are risky for credentials because a missing secret can produce a Collector that starts with the wrong value.
If the configuration needs a literal dollar sign, escape it as $$. This matters in relabeling expressions and other values that use $1-style capture groups.
Validate before starting the Collector
The Collector can validate a configuration without opening receivers or exporting data:
docker run --rm \
  -v "$PWD/otel-collector.yaml:/etc/otelcol-contrib/config.yaml:ro" \
  otel/opentelemetry-collector-contrib:0.158.0 \
  validate --config=/etc/otelcol-contrib/config.yaml
Validation catches malformed YAML, unknown settings, missing components and pipeline references that do not resolve. Put this command in CI when Collector configuration is maintained with application or infrastructure code.

A valid config proves that the binary can understand the file. It does not prove that an endpoint is reachable, credentials work or telemetry reaches storage. Run the Collector with debug enabled, send known test data and inspect both the Collector output and the destination.
Common configuration mistakes
The component is defined but inactive
Symptom: The Collector starts, but a receiver does not listen or a processor has no effect.
Check: Confirm that the full component identifier appears in the correct service.pipelines list. Extensions belong in service.extensions.
The distribution does not contain the component
Symptom: Startup reports an unknown component type and lists the available components.
Check: Compare the configuration with the exact Core, Contrib, Kubernetes or custom binary you deploy. Configuration cannot load a component that was not compiled into the binary.
The component name does not match
Symptom: Validation says a pipeline references an unknown receiver, processor or exporter.
Check: Treat otlp_http/primary as the complete name. Referencing only otlp_http points to a different instance.
The receiver is listening on the wrong interface
Symptom: The Collector runs, but applications in another container or host get connection refused.
Check: Inspect the receiver endpoint and the published container port. Use 0.0.0.0 only when remote clients need it, then control access at the network boundary.
Processor order changes the result
Symptom: Sensitive attributes leave the Collector, filters miss records or memory climbs before the limiter reacts.
Check: Read the processor list from left to right. Apply memory protection early, perform redaction before export and batch after record-level transformations.
The PII removal guide covers redaction and transform rules with a focused configuration.
Send the pipeline to Parseable
Once the debug path works, add a named Parseable exporter:
exporters:
  debug:
    verbosity: basic

  otlp_http/parseable:
    endpoint: ${env:PARSEABLE_URL}
    encoding: json
    headers:
      X-API-Key: ${env:PARSEABLE_API_KEY}
      X-P-Stream: ${env:PARSEABLE_DATASET}
      X-P-Log-Source: otel
Set PARSEABLE_URL to the Parseable ingestor base URL without /v1/logs. The OTLP HTTP exporter appends the signal-specific path.
Keep both exporters during the first test:
service:
  pipelines:
    logs:
      receivers: [otlp]
      processors: [memory_limiter, batch]
      exporters: [debug, otlp_http/parseable]
If records appear in debug but not in Parseable, the receiving half of the pipeline works. Check the endpoint, API key, dataset and exporter errors. After the remote path is stable, remove debug or reduce its verbosity.
Create an ingestion-scoped key and pass it through X-API-Key; Parseable's API key documentation explains the required role and how the header is authenticated. The Parseable OpenTelemetry documentation has separate instructions for logs, metrics and traces. The OpenTelemetry and Parseable stack guide follows the complete multi-signal path.