
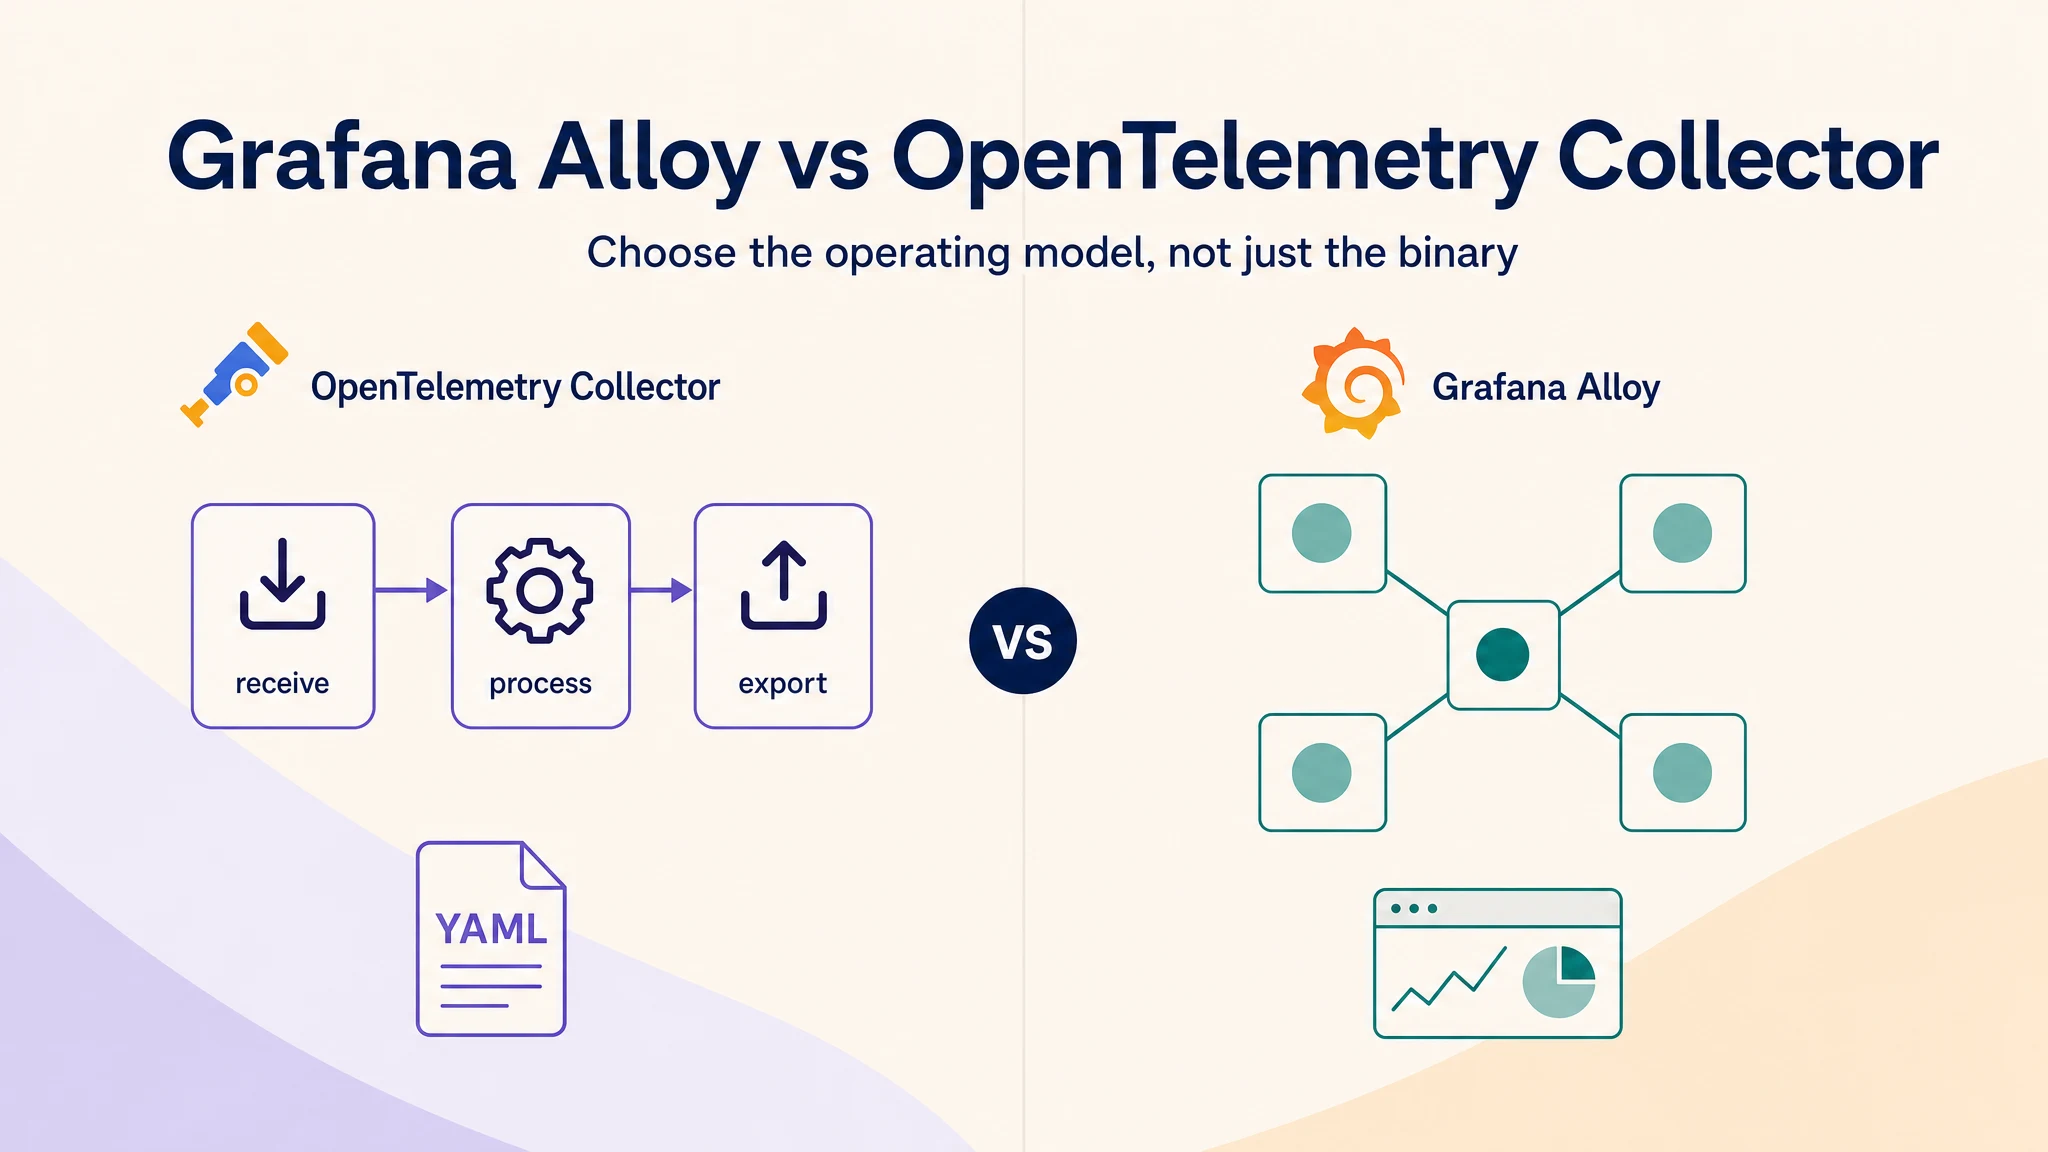
Grafana Alloy and the OpenTelemetry Collector can occupy the same box in an architecture diagram. Both receive telemetry, process it and send it to one or more backends. That makes the choice look simpler than it is.
The awkward part is that Alloy is not an unrelated alternative to the Collector. It embeds OpenTelemetry Collector components, adds Grafana and Prometheus components and gives you a different way to operate them. Grafana now also ships an experimental OTel engine that runs standard Collector YAML.
Both support OpenTelemetry. The decision comes down to which operating model your team should own.
Choose the upstream OpenTelemetry Collector when standard YAML, broad component availability and a backend-neutral operating model matter most. Choose Grafana Alloy’s default engine when Prometheus collection, Grafana integrations, a live component graph and Alloy’s clustering features matter more. You can also use both, but only when they have distinct jobs.
Grafana Alloy vs OpenTelemetry Collector at a glance
| Decision point | OpenTelemetry Collector | Grafana Alloy default engine |
|---|---|---|
| Project model | Upstream OpenTelemetry project | Grafana distribution that embeds OTel and Grafana components |
| Configuration | Collector YAML | Alloy syntax with an explicit component graph |
| Component choice | Core, Contrib or a custom distribution | Components included and supported by Alloy |
| Prometheus workflows | Prometheus receiver and related components | Native Prometheus discovery, scrape and remote-write components |
| Logs, metrics and traces | Yes | Yes |
| Profiles | Depends on distribution and component maturity | Native Grafana Pyroscope components |
| Debugging | Logs, internal telemetry, zPages and other extensions | Built-in UI, component health, live debugging and support bundles |
| Clustering | Deployment-specific; tools such as the Target Allocator solve particular cases | Built into Alloy, but each component must support and enable clustering |
| Backend portability | Standard Collector configuration patterns | Can export to non-Grafana backends, but Alloy syntax and native components remain Alloy-specific |
| Best fit | Portable OTLP gateways and broad integrations | Prometheus-heavy or Grafana-heavy collection estates |
Treat this table as a fit check. A feature only helps if your team needs it and can run it safely.
What Grafana Alloy actually is
The OpenTelemetry Collector is a vendor-neutral service for receiving, processing and exporting telemetry. A distribution packages the Collector binary with a chosen set of receivers, processors, exporters, connectors and extensions. The upstream project publishes several Collector distributions, while vendors and platform teams can build their own.
Grafana Alloy is one such distribution, but calling it “the Collector with a Grafana label” misses half the design. Alloy combines OpenTelemetry components with native Prometheus, Loki and Pyroscope pipelines. Its default engine uses Alloy syntax and wires components into a graph instead of declaring signal pipelines under service.pipelines.
As of September 2026, Alloy has two execution paths:
- The default engine runs Alloy syntax and includes Alloy’s full operational feature set. Grafana marks this as the stable, recommended way to run Alloy.
- The OTel engine runs standard OpenTelemetry Collector YAML and CLI conventions inside the Alloy binary. Grafana currently marks this engine as experimental.
That second option is useful, but it should not quietly decide a production migration. Experimental behavior can change and the OTel engine does not turn an existing YAML file into a default-engine Alloy configuration.
The differences you will notice in production
Configuration is a workflow choice, not a syntax contest
The upstream Collector separates component definitions from the pipelines that activate them:
receivers:
  otlp:
    protocols:
      grpc:
      http:

processors:
  batch: {}

exporters:
  otlphttp/backend:
    endpoint: https://telemetry.example.com

service:
  pipelines:
    logs:
      receivers: [otlp]
      processors: [batch]
      exporters: [otlphttp/backend]
The shape is predictable: receiver, processors, exporter. The same model appears across upstream documentation, vendor examples and many managed services.
Alloy’s default engine makes the connections explicit:
otelcol.receiver.otlp "apps" {
  grpc {}
  http {}

  output {
    logs = [otelcol.processor.batch.default.input]
  }
}

otelcol.processor.batch "default" {
  output {
    logs = [otelcol.exporter.otlphttp.backend.input]
  }
}

otelcol.exporter.otlphttp "backend" {
  client {
    endpoint = "https://telemetry.example.com"
  }
}
Alloy is more verbose for this tiny pipeline. It becomes easier to reason about when discovery, relabeling, several outputs and Grafana-native components enter the graph. The built-in UI can then show component health and connections without making you reconstruct the pipeline from a YAML file and log output.
Neither format prevents bad configuration. The better one is the format your team can review, test and debug at 2 a.m.
Alloy is stronger when Prometheus is a first-class workload
The OpenTelemetry Collector can scrape Prometheus endpoints through its Prometheus receiver. For an OTLP gateway with a few scrape jobs, that may be all you need.
Alloy carries more of the Prometheus operating model into one process: service discovery, relabeling, scraping and remote write are represented by native components. This matters when your collection layer already owns a large Prometheus estate or when you are replacing Grafana Agent.
It does not mean the upstream Collector “cannot do Prometheus.” It means Alloy gives Prometheus work more room in the design instead of treating it as one receiver feeding an OTel pipeline.
Check component coverage explicitly
The Collector Contrib distribution contains a broad catalog, but production deployments do not automatically inherit every component ever merged into the repository. The components available to you depend on the distribution and version you install.
Alloy embeds many OTel components and adds its own. It does not promise a one-for-one wrapper for every Contrib component on the day that component appears upstream. Before choosing either tool, check the exact receiver, processor, exporter and extension set you need rather than the project’s total component count.
This check is especially important when a pipeline depends on a less common receiver, a vendor-specific exporter or a connector whose stability level has recently changed.
Alloy has a better built-in view of itself
An upstream Collector exposes internal metrics and can use extensions such as zPages. Those signals are enough to build strong monitoring, but you have to assemble the operational view.
Alloy’s default engine includes a web UI for the component graph, health and debugging. It can also create support bundles and reload configuration without replacing the process. For a platform team supporting many pipelines, seeing the broken edge in the graph is often faster than reading a chain of component errors.
The UI is not a substitute for monitoring. You still need alerts for refused data, failed exports, queue growth, memory pressure and process restarts.
Clustering needs a footnote
Alloy can form a cluster, but enabling clustering does not distribute every workload automatically. A component must support clustering and have it enabled. Prometheus scrape distribution is a common use case; an arbitrary OTel processing graph does not become horizontally sharded because several Alloy instances can see each other.
The upstream Collector also has several scaling patterns rather than one global clustering switch. Stateless gateways can sit behind a load balancer. Stateful workloads such as tail sampling need trace-aware routing. Prometheus target allocation can use the OpenTelemetry Operator’s Target Allocator.
In both cases, write down what is being distributed: scrape targets, incoming OTLP traffic, stateful processing or export load. “It supports clustering” is too vague to design around.
Backend neutrality has two layers
Alloy can send telemetry to non-Grafana destinations. Using Alloy does not force you to buy Grafana Cloud and using OTLP exporters keeps the data path open.
The coupling appears in the operating layer. Alloy syntax, Grafana-native components and their debugging workflow are specific to Alloy. A move back to the upstream Collector may require configuration changes even when applications continue to emit the same OTLP data.
With the upstream Collector, the configuration model is shared across the OpenTelemetry ecosystem. Vendor-specific exporters can still introduce coupling, but the base pipeline knowledge transfers more easily.
Which should you choose?
Use the upstream OpenTelemetry Collector when:
- applications already emit OTLP and you need a straightforward gateway
- standard Collector YAML is used across teams or vendors
- a required component is available in Contrib but not in Alloy
- changing observability backends without changing the collection runtime is an explicit goal
- your platform team builds and owns a custom Collector distribution
Use Grafana Alloy’s default engine when:
- Prometheus scraping, discovery, relabeling and remote write dominate the workload
- you are migrating from Grafana Agent
- Loki, Mimir, Tempo or Pyroscope components are part of the collection path
- a built-in component graph and live debugging would reduce operational work
- Alloy’s component-level clustering solves a workload you actually have
Use Alloy’s OTel engine only after accepting its current experimental status. It can be a useful bridge for teams that want Alloy packaging while retaining Collector YAML, but it is not the conservative default for a new production estate yet.
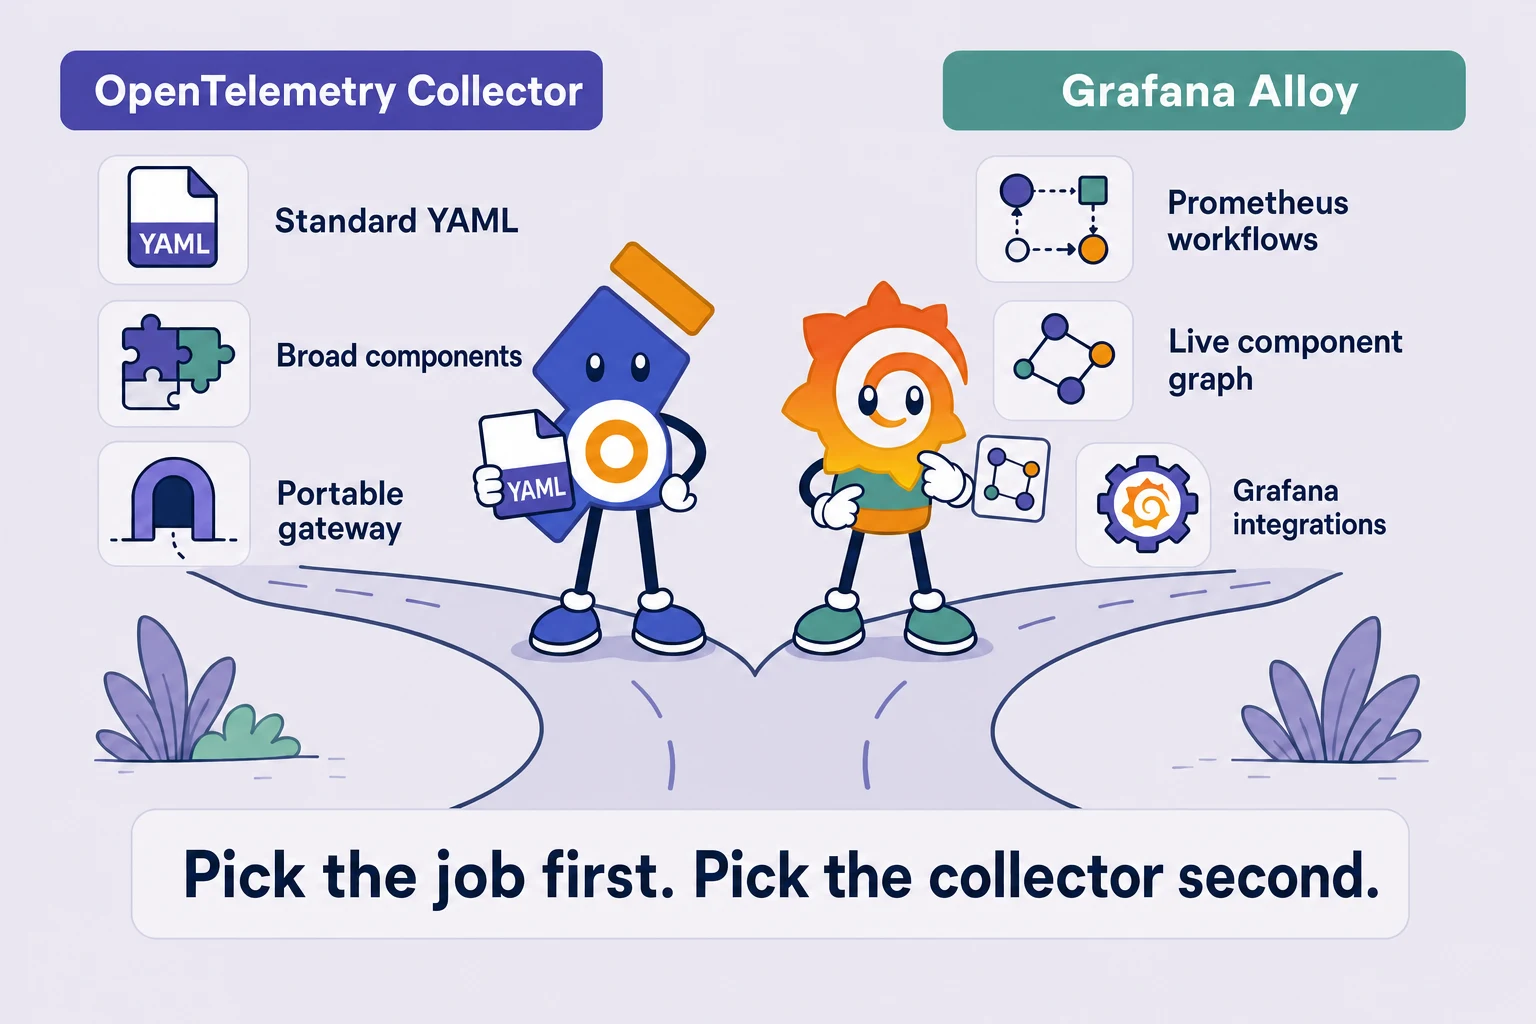
Can you run Alloy and the Collector together?
Yes, when each process has a defined job.
One useful split is:
Application telemetry --OTLP--> OpenTelemetry Collector gateway --> backend

Infrastructure targets -------> Grafana Alloy --------------------> backend
The Collector gateway receives application OTLP and applies shared processors. Alloy handles Prometheus discovery and infrastructure collection. Each process has a reason to exist and either can export to the same backend.
Another design uses Alloy at the edge and an upstream Collector as a shared gateway. That can work too, but it adds another queue, another failure boundary and another configuration surface. Do not add the hop merely because both tools are available.
Grafana also supports running its default engine beside the OTel engine through an Alloy extension. The pipelines do not directly exchange data inside the process, so treat them as two runtimes that happen to share packaging, not as one merged graph.
Migrating from the OpenTelemetry Collector to Alloy
Grafana provides alloy convert to translate a Collector configuration into Alloy syntax:
alloy convert \
  --source-format=otelcol \
  --output=converted.alloy \
  collector.yaml
The converter is a starting point. Grafana documents it as a best-effort conversion and unsupported components or fields can produce warnings and errors. Even a successful conversion may change generated metric or log names and may not preserve every service.telemetry setting.
Treat the migration as a telemetry change:
- Inventory every component and its stability level.
- Convert the file and resolve every warning.
- Compare accepted, refused and exported records in a staging path.
- Check resource attributes, metric names, log labels and sampling decisions.
- Run the old and new paths against representative load.
- Roll out gradually and keep a rollback path.
The official migration guide documents the converter and its limitations. If you stay with the upstream Collector, our Collector configuration guide covers validation, component activation and environment-based secrets.
Sending telemetry from either tool to Parseable
Parseable accepts OpenTelemetry logs, metrics and traces over OTLP/HTTP. Both Alloy and the upstream Collector can use an OTLP HTTP exporter, so the backend does not decide which collection runtime you need.
If you use the upstream Collector, follow the Parseable OpenTelemetry Collector documentation. If Alloy already runs in your estate, the Grafana Alloy and Parseable guide shows the setup path. That article owns the configuration tutorial; this comparison is meant to help you choose before copying one.
For a broader view of receivers, processors, exporters and deployment modes, start with how the OpenTelemetry Collector works.